SPATIAL DISTRIBUTION OF VEGETATION COVER IN ERBIL CITY DISTRICTS USING HIGH-RESOLUTION PLÉIADES SATELLITE IMAGE
SHWAN O. HUSSEIN
1,2*, FERENC KOVÁCS
1, ZALÁN TOBAK
1, HAIDI J. ABDULLAH
21Department of Physical Geography and Geoinformatics, University of Szeged, Egyetem u. 2-6, H-6722 Szeged, Hungary
2Department of Geography, College of Arts, Salahaddin University, Erbil, Iraqi-Kurdistan
*E-mail: shwan.huseen1@su.edu.krd
Received 15 January 2018, accepted in revised form 8 May 2018 Abstract
Green spaces are playing an essential role for ecological balance and for human health in the city as well.
They play a fundamental role in providing opportunities for relaxation and enjoying the beauty of nature for the urban population. Therefore, it is important to produce detailed vegetation maps to assist planners in designing strategies for the optimisation of urban ecosystem services and to provide a suitable plan for climate change adaptation in one fast growing city. Hence, this research is an investigation using 0.5 m high-resolution multispectral Pléiades data integrated with GIS data and techniques to detect and evaluate the spatial distribution of vegetation cover in Erbil City. A supervised classification was used to classify different land cover types, and a normalised difference vegetation index (NDVI) was used to retrieve it for the city districts. Moreover, to evaluate the accessibility of green space based on their distance and size, a buffer zone criterion was used. The results indicate that the built-up land coverage is 69% and vegetation land cover is 14%. Regarding NDVI results, the spatial distribution of vegetation cover was various and, in general, the lowest NDVI values were found in the districts located in the city centre. On the other hand, the spatial distribution of vegetation land cover regarding the city districts was non-equal and non-concentric. The newly built districts and the districts far from the Central Business District (CBD) recorded the lowest vegetation cover compared with the older constructed districts.
Furthermore, most of the districts have a lack of access to green spaces based on their distance and size.
Distance and accessibility of green areas throughout the city are not equally distributed. The majority of the city districts have access to green areas within radius buffer of two kilometres, whereas the lowest accessibility observed for those districts located in the northeast of the city in particular (Xanzad, Brayate, Setaqan and Raperin). Our study is one of the first investigations of decision-making support of the spatial planning in a fast-growing city in Iraq and will have a utilitarian impact on development processes and local and regional planning for Erbil City in the future.
Keywords: Pléiades, NDVI, urban vegetation, supervised classification
1. Introduction
Urban expansion has recently become a hot topic which has attracted much attention in the academic and scientific sectors. The expansion of built-up areas is commonly recognized as a way of creating an unacceptable environment regarding air quality and natural resource management.
This is because urban sprawl changes natural
land cover into man-made land cover in order to serve human needs. This also involves converting vegetation land into the built-up land (Mallick et al., 2008). In other words, the process of urbanization induces changes in the physical characteristics of ground surface components such as the thermal capacity of the land surface, surface albedo and the moisture of the soil. This brings about changes in the natural environment in
cities and surrounding areas. One of the most critical components in the urban areas is vegetation land cover which has a significant influence on the urban environment and, therefore, is widely used for environmental research and by policymakers (Anchang et al., 2016) It interacts with many aspects, e.g. life, mitigation of climate change. Furthermore, green vegetation has the potential to reduce the impact of sand storms particularly in the arid region (Middleton and Kang, 2017).
Therefore, nowadays, the role of urban vegetation is attracting much attention and it is considered to be an important component for the mitigation of climate change effects on the populations in cities.
It is important to produce detailed vegetation maps to assist planners in designing strategies for the optimization of urban ecosystem services and to produce a suitable plan for climate change adaptation (Tzoulas et al., 2007; Lovell and Taylor, 2013;
Ahern et al., 2014). Furthermore, it is a vital step to investigate the spatial distribution of green places in urban areas ensuring that they are available to all urban residents.
With the capacity to differentiate land cover (LC) types on a large scale, remote sensing data and techniques have been widely used for vegetation mapping in various environments and for different purposes.
Satellite imagery has been adopted for the monitoring of vegetation both in urban and rural areas (Hofmann et al., 2011). In general, the potential of remotely sensed data relies on a spatial and spectral resolution to map green areas within cities. Several studies have used spectral vegetation indices (SVIs) from low-to-medium resolution satellite data to mapping and studying the spatial distribution of vegetation cover within urban areas. These studies have mainly focused on using simple SVIs such as (NDVI, GNDVI, SAVI, EVI) to extract vegetation cover from the urban areas ( Buyantuyev et al., 2007;
Van de Voorde et al., 2008; Kaspersen et al., 2015; Balik et al., 2017). However, for effective and proper mapping and for a good management policy, the detection of green
areas with complex urban structures should be accurate enough to benefit and help local authorities to form the appropriate policy.
Therefore, a high-resolution satellite image is able to provide more detail and information regarding the spatial distribution of green areas in the urban region. It is important to note that several studies have explored the benefits of commercial remote sensing data such as IKONOS ( Noor et al., 2013; Anchang et al., 2016), Worldview-2 (Mustafa et al., 2015), SPOT, (Noor et al., 2013) to map and detect urban green areas. These studies revealed that the high-resolution remote sensing data is the proper tool to map urban green areas with accuracy.
For this reason, in this study, we attempted to use a very high spatial resolution satellite imagery from Pléiades platform with 0.5 m spatial resolution to map and detect the spatial distribution of vegetation land cover for the first time in the city of Erbil.
This is because the previous studies have mainly used low to medium resolution data (Abdullah, 2012; Rasul et al., 2015; Hussein et al., 2017). The main objectives of this study were (a) to investigate how vegetation cover is spatially distributed among the city districts and (b) to explore the accessibility of the areas of greenery within the city districts.
2. Materials and Methods:
Study area
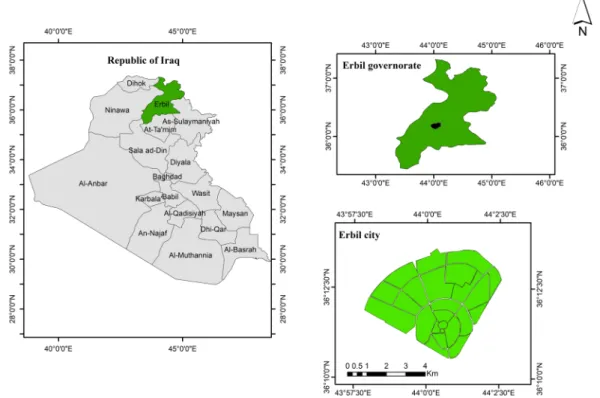
The study area, Erbil is the capital city of the Kurdistan Regional Government (KRG) located in northern Iraq (Fig. 1.). It lies between longitudes 43° 51’ 20”, 44° 12’
28” and latitudes 36° 05’ 58”, 36° 15’ 54”.
Swift and extensive economic and political development over the last two decades have triggered vast and rapid urban expansion on the fertile agricultural lands around the city, which is now one of the most populated cities in this region. According to the latest census conducted by the Erbil governorate in 2011, the total population was 1,025,000.
Regarding geographical location, it is located
11 Landscape & Environment 12 (1) 2018. 10-22
in the middle of the Erbil governorate, at the base of the Kurdistan mountains and looks over the vast Erbil plain at the meeting point of several major roads in the province of Kurdistan, in central and southern Iraq.
Regarding climate and weather, this region is characterised as having a semi-arid, continental and Mediterranean climate; type BSsh according to the Koppen classification (Köppen et al., 2011). Specifically, it is located Fig. 1. Map of Erbil governorate and Erbil city
Fig. 2. The flow chart of the methodology used
in a semi-arid climate but near the region of the dry climate to the south and west and, thus, it is defined as having a continental climate. It has two obvious types of weather;
cold and wet in winter and dry and hot in summer. In general, annual precipitation is between 300–500 mm. However, due to climatic and environmental changes, this has decreased recently, as shown by the data produced by the Erbil weather station.
Satellite data and image processing Commercial high-resolution multispectral satellite imagery from Pléiades was used in this study. To fulfil the aims of this research, cloud-free satellite data was requested on the 21th June, 2015. The data were delivered in ORTHO form which means geometrically corrected in the Universal Transverse Mercator (UTM) coordinate system and matched to each other with sub- pixel accuracy. Pléiades delivers high spatial resolution 0.5 m and 4 spectral bands image data (Table 1).
To prepare the satellite images for further analysis, a series of pre-processing was applied (Fig. 2.). First, image radiometric calibration was applied to convert the the radiance value to Top-of-Atmosphere (TOA) reflectance. A MODTRAN4-based
atmospheric correction software package (FLAASH) was used to convert the TOA Reflectance to surface reflectance (Adler- Golden et al., 1999) using ENVI software.
Second, supervised classification (maximum likelihood) method was used to assign the digital pixel values of the satellite images into different land cover classes (Mather and Koch, 2011). To achieve this, the standard RGB color composite was used, which consists of bands 3 (red,), 2 (green,) and 1 (blue). This band combination is the most appropriate for use in the process of supervised classification when using Pléiades images. Third, there were supervised classification works based on spectral pattern recognition of each land cover type represented by each pixel in the satellite image (Campbell and Wynne, 2011; Chuvieco, 2016). The collection of an appropriate training sample is the most important step in the process of supervised classification, and assembling accurate training data is the key to the success of the whole process. Assembling the training data requires effort regarding art and science. In supervised classification, training data are collected by drawing a boundary around areas that are representative of the land cover types you want to map in the image. In other words by collection these training areas you Fig. 3. Buffer zone criteria used and green areas Fig. 4. Result of the supervised classification.
13 Landscape & Environment 12 (1) 2018. 10-22
are “tell” the computer program what the classes you want to classify should look like spectrally. Therefore, careful drawing should be taken during this process. In this study, we have considered the following criteria during the selection process of the training sample, based on the recommendations of Gao (2008):
I. As mentioned earlier, the main concept of supervised classification is to assign pixels to different land cover classes. As a result, the quantity of pixels chosen for each class during the training stage plays an important role in obtain- ing correct results. For example, the more extensively land cover type is distributed over the scene; the more pixels should be selected for this class.
Lillesand et al. (2014) suggested using more than twenty training samples for each land cover class with forty pixels within each training sample. In addi- tion, Mather and Koch (2011) stated that, if the classifier type is a maximum likelihood, the quantity or number of the pixels within the training sample should be at least ten to thirty times the number of features for each class.
Therefore, in this study, at least twenty training samples were collected for each land cover class with around forty pixels located in each sample.
II. It is common that the training sample is usually selected by delimiting the
boundary around the target pixels. The size of these samples also has a great impact on the final result. In fact, there is no standard rule to determine the physical size of these training samples.
However, the variation of the classes may identify the size of each sample.
For example, if the study area has only one body of water, the sample size may cover the whole of the water instead of using smaller samples within the same location.
III. Location of a training sample is another important point. The analyst should collect samples from the whole scene in order to avoid missing particular classes or pixels relating to a specific land cover class (Chuvieco, 2009) IV. The uniformity regarding spectral
radiance has the greatest impact on the classification results, i.e. choices for a class should ideally all exhibit a unimodal distribution in their values of the spectral band used (Gao, 2008).
However, supervised classification requires some additional inputs before the application of any algorithms.
These inputs can be collected from fieldwork, air photo analysis, reports or from the study of appropriate maps of the area of interest (Mather and Koch, 2011). Therefore, the image analyst should have substantial refer- ence data and a thorough knowledge Table 1. Pléiades metadata
Satellite Pléiades-L1
Date 21- 6- 2015
Time 07:56:49 am
Image ID DS_PHR1A_201506210756157_SE1_PX_E044N36_0108_00724
Projection UTM Zone 38
Ellipsoid WGS 84
Processing level ORTHO
Spectral Bands Band 1 (430-550 nm); Band 2 (490-610 nm); Band 3 (600-720 nm);
Band 4 (750-950 nm)
Spatial resolution 0.5 meter
of the geographical area (Lillesand et al., 2011). Ancillary data are strongly recommended during the classifica- tion process of urban areas, in order to enhance the contextual interpretation of the spectral and spatial satellite data (Mesev, 2010). Therefore, ancillary data from Google Earth and maps of the Erbil city master plan were used during the process of collecting train- ing data, together with collecting 550 ground truth data using hand held GPS for each land cover class considered in this study.
The image was divided into four classes with regard to the main objectives of this study. These classes are barren land, water, vegetation and built-up land areas. Our classification of barren land follows that defined by Anderson (1976), as; “land of limited ability to support life and in which less than one-third of the area has vegetation or another cover. In general, it is an area of thin soil, sand or rocks. Vegetation, if present, is more widely spaced and scrubby than that in the Shrub and bush category of Rangeland”.
In addition, all types of vegetation, such as agriculture, parks and grassland are grouped into one class, due to the study objective of attempting to find out how vegetation land cover is spatially distributed in this city. Built up land includes all of the man-made types, such as residential, industrial, institutional, transportation and buildings. Based on these criteria, training data were collected, together with external data sources and the analyst’s experience of the study area. The reason for the division into the classes mentioned above is to facilitate the study objective, which is to
identify the spatial distribution of vegetation land cover and to extract the percentage of green areas in each district in the city. The percentage of each land cover classes areas for each buffer zone was extracted after converting the digital values to hectares.
Finally, to assess the classification accuracy, the most common and widely used method technique error matrix (confusion matrix) was used in this study (Congalton, 1991). An error matrix works by choosing a group of ground truth data (GPS point) in the classified image and comparing them with a real scene in the image. Thus, to check the accuracy assessment, a total of 550 ground truth points were collected for the study area as follows; 150 for each urban, vegetation, barren land and 100 for a body of water.
Afterwards, the overall user and producer accuracy was calculated. All analysis were done using ENVI v 5.3 and ArcGIS v 10.6 to establish supervised classification and producing the final maps, respectively.
Normalized Difference Vegetation Index (NDVI)
The NDVI is a widely used parameter in studies for evaluating vegetation land cover.
This is because NDVI is less sensitive to the changes in atmospheric conditions than other indices, therefore it has become the most widely used for monitoring vegetation status (Mather and Tso, 2016). The purpose of using NDVI in this study was to evaluate the percentage of vegetation land cover in each district of the city and to compare the result with our classification map. The basis of the NDVI is a rational calculation between Table 2. Evaluation of classification result base error matrix
Producer’s accuracy (%) User’s accuracy
Urban 92 96
Vegetation 96 94
Water 99 99
Barren land 95 97
Overall accuracy 96%
15 Landscape & Environment 12 (1) 2018. 10-22
near-infrared (NIR) band 4 and Red (R) band 3. The NDVI always ranges from -1 to +1, however there isn’t a distinct boundary for each type of land cover. For example, when you have negative values, it’s highly likely that it’s water. On the other hand, if you have a NDVI value close to +1, there’s a high possibility that it’s dense green leaves. But when NDVI is close to zero, there isn’t green leaves and it could even be an urbanized area.
The following equation proposed by (Tucker, 1979) was used to give the exact values of NDVI based on reflectance data:
NDVI = (NIR- Red) / (NIR+Red)
To establish whether the variation between
city districts, regarding vegetation land cover, is significantly different, analyses of variance (ANOVA) were performed. Analysis of variance is a statistical method used to examine the differences among group means in a sample. Furthermore, ANOVA analysis was used to evaluate whether NDVI value was significantly different among them. Finally, to examine visually how the city districts are different, a NDVI box plot technique was employed using mean and standard deviation. Furthermore, the percentage of each land cover class was extracted and compared for further analysis.
Name of District Land use and land cover classes Urban Water Barren land Vegetation
Sami Abdulrahman Park 34 1 21 44
≥ 20%
Zaniary 53 0 9 38
Tajeel 70 0 8 22
Brayate 70 0 9 21
Minara 70 0 11 18
10 -20 %
Shorsh 79 0 5 15
Raprein 81 0 6 13
Tairawa 86 0 3 11
Setaqan 86 0 3 11
Xanzad 81 0 8 11
Saidawa 82 0 8 10
Kuestan 64 0 27 9
< 10%
Naz 59 0 32 9
Dream City 48 0 43 9
Kany 81 0 11 8
Xanaqa 83 0 9 8
Mustawfi 89 0 3 7
Selaheddin 68 0 25 7
Bakhtiary 81 0 13 7
Arab 90 0 4 6
Qala 42 0 51 6
Parlieman 58 0 36 6
Kurany Ainkawa 68 0 27 6
Bazar 99 0 1 0
Table 3. Distribution of land use classes in each city districts covered by the satellite image
Converting Results into the GIS Environment
The nature of recorded data in remotely sensed images are pixel values, where each pixel records X, Y information for the ground location. Therefore, this allows the remotely derived information to be used with other data in spatially distributed modelling efforts, such as with GIS (Lindgren, 1985;
Jensen and Hodgson, 2004). In other words, the development and integration of remote sensing with Geographical Information Systems have led to the multi-spatial analysis of data (Chapman and Thornes, 2003).
For this reason, to achieve the study’s objectives, GIS techniques were used to analyse and evaluate spatial information.
These techniques included the input and conversion of all obtained results into ArcGIS software to facilitate the conversion of data type from raster to polygons. This step has rarely been used in literature and, thus, counts as a point of strength for this study.
The polygon data of the city was used to extract the NDVI value and the classification result based on each district in the city. The result of inputting and converting remotely sensed data into the GIS environment allows a variety of numerical and geographical analysis techniques to be employed, such as Zonal statistics to extract mean values of NDVI for each district’s class and mapping out results in an appropriate manner. In addition, it allows us to assess spatially the distribution of vegetation land cover and evaluate the variation among the city districts.
Moreover, to determine and explore the accessibility to green spaces within the city districts we used buffer zone criteria. The most commonly used way to objectively assess exposure to green areas is to determine the greenness within a circular buffer of the residential address (James et al., 2015). Accessibility, often measured as the proximity (linear distance or walking distance) of urban green spaces to communities (settlements), is also associated with various health advantages
and disadvantages. Generally, The radius of the buffers used to define surrounding green space varied among studies and ranged from 30 (McMorris et al., 2015) to 2000 m (Maas et al., 2008). Green space within a buffer can be assessed by using the Normalized difference vegetation Index (NDVI) or by classification of land use cover for the given area. In our study, we have used classification result to select the green areas. Our criteria for using buffer zone was; 1) green areas with the total area between 2-20 ha 300 m buffer were applied; 2) green areas bigger than 20 ha 2 km buffer was applied. Afterwards, the total area of each city districts within those buffer zones was extracted and converted to percentage (Fig. 3). Analyses to determine green space accessibility were performed in ArcGIS 10.6.
3. Results
Results of the supervised classification Classified Pléiades image is presented in Figure 4. Due to the high spatial resolution of the image, general classes, namely a body of water, urban, barren land and vegetation were considered as land use and land cover LULC classes. The results of the supervised classification show that the largest areas covered by urban land is 69 %, following this, barren land covers an area of 17%. However, the ratio of the vegetation land cover, is only 14% (Fig. 4). After generating a LULC image, an accuracy assessment was carried out using 550 ground truth points. Error matrices were used to assess classification accuracy.
In Table 2, the accuracy assessment report is presented. The overall accuracy is 96 %.
User’s and producer’s accuracies of individual classes were consistently high, ranging from 92% to 99%. The lower accuracy observed for vegetation land cover is 94% with a higher accuracy of 99% for the water class (the small lake in Sami Abdulrahman park).
Moreover, as Figure 4 shows, the land cover classes are unequally distributed among the city districts, for example, for 17
all twenty-four districts considered in this study, only Tajeel, Zaniary, Brayati and Sami Abdulrahman park have a vegetation cover which is more than 20 % (Table 3).
Interestingly, we observed more open lands and lower vegetation proportion in the new build districts compared to the older ones or those located close to the city center such as;
Dream city, Naz, Kuranyainkawa and Kuestan (Figure 4 and Table 3).
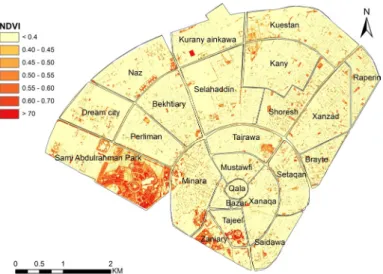
On the other hand, by comparing the results of supervised classification with the result of the spatial distribution of vegetation cover from NDVI raw values, it is apparent that the threshold value (NDVI > 0.40) can be used for vegetation classification (Figs 4, 6 and 7). As can be seen from these two figures, all vegetation areas that have NDVI > 0.40 are accurately identified as vegetation land cover using a supervised classification technique.
Spatial distribution of vegetation indica- tor using NDVI
In the downtown Qala and Bazar areas, the NDVI value (mean 0.16 and 0.074) tends to be low as it is dominated by built-in or built-up areas. In the new build districts like Dream city and Naz, it is still found that the NDVI values are (light yellow) low (< 0.4) (Figs. 6 and 7). In contrast, the higher NDVI values were observed over the Sami Abdularhaman Park, Zaniary and Minara (0.35, 0.25 and 0.18) where the areas are dominated by tall trees and grasses. This result is in line with our classification result as it shows that those new build districts have more barren lands compared to other places in the city (Fig. 4).
Green space access results
To assess the accessibility of green spaces based on each city district, a buffer zone technique was applied. Overall, the majority of the districts have low vegetation cover within 300 m buffer zone. However, 9 districts (Bazar, Qala, Arab, Mustawfi,Bakhtia ry,Parlieman,Dream city, Tajeel, Zaniary) has 100% to 2 km buffer zone around the Sami Abdulrahman Park (Fig. 5).
On the other hand, some of the parks and green areas located in the northeast of the city were small, such as small playgrounds or public gardens. Therefore, the districts located on the northeast of the city only has access to 300 m buffer zone. Similarly, four districts (Raprein,Setaqan, Brayate, Xanzad) has no access to green areas (Fig. 5)
4. Discussion and conclusion
High-resolution satellite data from the Pléiades satellite with 0.5 m spatial resolution was used to investigate the spatial distribution of vegetation in Erbil city. The results demonstrate that only 14% of the study site is covered by vegetation and this was not equally distributed among the city districts (Figs. 4 and 6). Furthermore, we observed that the districts located in north- east of the city have less access to the large green areas compared to the newly built districts (Fig. 3 and 5).
A common observation in our study was the urban area which consists of all kind of man-made materials such as; buildings, roads, etc., which covered 69 % of the total area under consideration. This is a clear indication of the lack of vegetation cover in Erbil city compared with the international standard of green areas in urban areas.
This finding is in line with earlier studies by Abdullah (2012) and Rasul et al. (2015) who found that the vast and fast expansion of Erbil city caused the disappearance of the vegetation land cover. Furthermore, a common observation in this study was that the districts such as (Setaqan, Xanzad, Raperin, Xanaqa,Mustawfi, Tairawa and Qala) have the lowest vegetation cover (Figs. 5 and 6). This result counts as a significant point in terms of justifying the study objectives. This is because insufficient vegetation (green) cover in those districts may have impacted on the ecosystem function, biodiversity and climatic variables (Southworth, 2004).
In addition, the lack of greenery in those districts is negatively affected regarding the process of the observation of solar radiation
by particular ground surfaces (Mallick et al., 2008). Thus, the other climatic indicators, such as surface temperature, evaporation and storage of heat, will also change.
Similarly, the districts located close to the city centre such as Mustawfi, Tairawa, Setaqan and Bazar show the lowest green space compared to the other city districts.
The possible reason for this finding might be related to the history of these areas. This is because Erbil is one of the oldest cities in the northern part of Iraq due to having an ancient castle at its centre. Over its history, the city has expanded in a circular shape around the castle. Therefore, the older districts, which are close to the castle, have a very low proportion of green space due to the lack of available land.
It is important to note that Sami Abdulrahman Park is the only area in the city that provides green areas (> 20 hectares).
According to the Accessible Natural Greenspace Standard (ANGSt), all people should have accessible natural green space
“of at least two hectares in size, no more than 300m (five minutes’ walk) from home” or “at least one accessible 20-hectare site within 2km of home”. As can be seen from Figure 3 and 5, Sami Abdulrahman park provided
% 100 access to green areas within 2 km buffer for 11 districts (Bazar,Qala,Arab, Must awfi,Bakhtiary,Parliament,Dream city, Tajeel, Zaniary) and other 4 districts ( Xanaqa, Tairawa, Selaheddin, Naz) has access higher than 50 % to this park.
The methods and satellite data which were applied and used in this study are sufficient for achieving the research objective and answering the research questions in a proper and scientific way. In addition, this study shows the importance of using high- resolution satellite data such as Pléiades Fig. 6. Normalized difference vegetation indices for the study area
19 Landscape & Environment 12 (1) 2018. 10-22
in the study of urban green areas. It also acts as an effective tool when it comes to helping people and urban planners to find the solution for problems caused by environmental changes. For example, this study offers several recommendations aimed at helping urban planners in the Erbil area to mitigate the impact of climate change and reduce the risks of environmental changes in this region.
• The government should plan to in- crease the ratio of areas of greenery in the city to the international standard, which is about 15% of the total land area within the city. In addition, they
should encircle the city with a green belt. This fits in with the government’s current plan to prevent the encroach- ment of dust during the dry and hot season which usually causes a rise in temperature.
• The government should help and encourage people to grow plants in the new build districts. This step may be remarkable in terms of decreasing the high land surface temperature associ- ated with the barren lands in those districts.
• Further research is required to make sure of the accuracy of the results which were obtained. This is necessary Fig. 6. Normalized difference vegetation indices for the study area
Fig. 7. Mean and standard deviation of NDVI for each city districts to the table 3
because this project is one of the rare studies on the spatial distribution of vegetation cover in this area. Research- ers should also use temporal satellite data to allow a comparison between land use and land cover changes over time and identify the direction and percentage of changes.
5. Reference
Abdullah, H., 2012. The Use of Landsat 5 TM Imagery to Detect Urban Expansion and Its Impact on Land Surface Temperatures in The City of Erbil, Iraqi Kurdistan. MSc, University of Leicester.
Adler-Golden, S.M., Matthew, M.W., Bernstein, L.S., Levine, R.Y., Berk, A., Richtsmeier, S.C., Acharya, P.K., Anderson, G.P., Felde, J.W. and Gardner, J., 1999. Atmospheric correction for shortwave spectral imagery based on MODTRAN4, SPIE’s International Symposium on Optical Science, Engineering, and Instrumentation.
International Society for Optics and Photonics, pp. 61-69.
Ahern, J., Cilliers, S. and Niemelä, J., 2014. The concept of ecosystem services in adaptive urban planning and design: A framework for supporting innovation. Landscape and Urban Planning, 125: 254-259.
Anchang, J.Y., Ananga, E.O. and Pu, R., 2016. An efficient unsupervised index based approach for mapping urban vegetation from IKONOS imagery. International journal of applied earth observation and geoinformation, 50: 211-220.
Anderson, J.R., 1976. A land use and land cover classification system for use with remote sensor data, 964. US Government Printing Office.
Balik, G., Aktaş, E., Önaç, A.K. and Birişçi, T., 2017.
Vegetation Cover Change of Çeşme Alaçatı Wind Power Plant Using Normalized Difference Vegetation Index (NDVI). Journal of International Environmental Application &
Science, 12(3): 204-211.
Buyantuyev, A., Wu, J. and Gries, C., 2007. Estimating vegetation cover in an urban environment based on Landsat ETM+ imagery: a case study in Phoenix, USA. International Journal of Remote Sensing, 28(2): 269-291.
Campbell, J.B. and Wynne, R.H., 2011. Introduction to remote sensing. Guilford Press.
Chapman, L. and Thornes, J.E., 2003. The use of geographical information systems in climatology and meteorology. Progress in
Physical Geography: Earth and Environment, 27(3): 313-330.
Chuvieco, E., 2009. Fundamentals of satellite remote sensing. CRC press.
Chuvieco, E., 2016. Fundamentals of satellite remote sensing: An environmental approach. CRC press.
Congalton, R.G., 1991. A review of assessing the accuracy of classifications of remotely sensed data. Remote sensing of environment, 37(1):
35-46.
Gao, J., 2008. Digital analysis of remotely sensed imagery. McGraw-Hill Professional.
Hofmann, P., Strobl, J. and Nazarkulova, A., 2011.
Mapping green spaces in Bishkek—how reliable can spatial analysis be? Remote Sensing, 3(6): 1088-1103.
Hussein, S., Kovács, F. and Tobak, Z., 2017.
Spatiotemporal Assessment of Vegetation Indices and Land Cover for Erbil City and Its Surrounding Using Modis Imageries, 10.
Jensen, J.R. and Hodgson, M.E., 2004. Remote sensing of selected biophysical variables and urban/suburban phenomena, Geography and technology. Springer, pp. 109-154.
Kaspersen, P.S., Fensholt, R. and Drews, M., 2015.
Using Landsat vegetation indices to estimate impervious surface fractions for European cities. Remote Sensing, 7(6): 8224-8249.
Köppen, W., Volken, E. and Brönnimann, S., 2011. The thermal zones of the earth according to the duration of hot, moderate and cold periods and to the impact of heat on the organic world (Translated from: Die Wärmezonen der Erde, nach der Dauer der heissen, gemässigten und kalten Zeit und nach der Wirkung der Wärme auf die organische Welt betrachtet, Meteorol Z 1884, 1, 215-226). Meteorologische Zeitschrift, 20(3): 351-360.
Lillesand, T., Kiefer, R.W. and Chipman, J., 2011.
Remote sensing and image interpretation. John Wiley & Sons.
Lillesand, T., Kiefer, R.W. and Chipman, J., 2014.
Remote sensing and image interpretation. John Wiley & Sons.
Lindgren, D.T., 1985. Land use/land cover: inventory and change, Land use planning and remote sensing. Springer, pp. 101-115.
Lovell, S.T. and Taylor, J.R., 2013. Supplying urban ecosystem services through multifunctional green infrastructure in the United States.
Landscape ecology, 28(8): 1447-1463.
Mallick, J., Kant, Y. and Bharath, B., 2008. Estimation of land surface temperature over Delhi using
21 Landscape & Environment 12 (1) 2018. 10-22
Landsat-7 ETM+. J. Ind. Geophys. Union, 12(3):
131-140.
Mather, P. and Tso, B., 2016. Classification methods for remotely sensed data. CRC press.
Mather, P.M. and Koch, M., 2011. Computer processing of remotely-sensed images: an introduction.
John Wiley & Sons.
Mesev, V., 2010. Classification of urban areas: inferring land use from the interpretation of land cover, Remote sensing of urban and suburban areas.
Springer, pp. 141-164.
Middleton, N. and Kang, U., 2017. Sand and dust storms: impact mitigation. Sustainability, 9(6):
1053.
Mustafa, Y., Habeeb, H., Stein, A. and Sulaiman, F., 2015.
Identification and mapping of tree species in urban areas using Worldview-2 imagery. ISPRS Annals of Photogrammetry, Remote Sensing &
Spatial Information Sciences.
Noor, N.M., Abdullah, A. and Manzahani, M.N.H., 2013.
Land cover change detection analysis on urban green area loss using GIS and remote sensing techniques. PLANNING MALAYSIA JOURNAL, 11(3).
Rasul, A., Balzter, H. and Smith, C., 2015. Spatial variation of the daytime surface urban cool island during the dry season in Erbil, Iraqi Kurdistan, from Landsat 8. Urban climate, 14:
176-186.
Southworth, J., 2004. An assessment of Landsat TM band 6 thermal data for analysing land cover in tropical dry forest regions. International journal of remote sensing, 25(4): 689-706.
Tucker, C.J., 1979. Red and photographic infrared linear combinations for monitoring vegetation.
Remote Sensing of Environment, 8(2): 127- 150.
Tzoulas, K., Korpela, K., Venn, S., Yli-Pelkonen, V., Kaźmierczak, A., Niemela, J. and James, P., 2007. Promoting ecosystem and human health in urban areas using Green Infrastructure:
A literature review. Landscape and Urban Planning, 81(3): 167-178.
Van de Voorde, T., Vlaeminck, J. and Canters, F., 2008.
Comparing different approaches for mapping urban vegetation cover from Landsat ETM+
data: a case study on Brussels. Sensors, 8(6):
3880-3902.