Article
Measuring and Predicting Long-Term Land Cover Changes in the Functional Urban Area of Budapest
József Lennert1 , Jen ˝o Zsolt Farkas1, András Donát Kovács1, András Molnár2, Rita Módos3, Dorián Baka4 and Zoltán Kovács5,6,*
1 Great Plain Research Department, Centre for Economic and Regional Studies, 6000 Kecskemét, Hungary;
lennert.jozsef@krtk.mta.hu (J.L.); farkas.jenozsolt@krtk.mta.hu (J.Z.F.);
kovacs.andrasdonat@krtk.mta.hu (A.D.K.)
2 Agriculture and European Affairs Directorate, MTB Zrt., 1117 Budapest, Hungary;
andras.molnar.aki@gmail.com
3 Environment Research Department, NARIC Research Institute of Agricultural Economics, 1093 Budapest, Hungary; modos.rita@aki.naik.hu
4 Department Faculty of Science, Institute of Geography and Earth Sciences, Eötvös Loránd University, 1117 Budapest, Hungary; keltafella@gmail.com
5 Department of Economic and Social Geography, University of Szeged, 6722 Szeged, Hungary
6 Research Centre for Astronomy and Earth Sciences, 9400 Sopron, Hungary
* Correspondence: zkovacs@iif.hu
Received: 31 March 2020; Accepted: 17 April 2020; Published: 20 April 2020 Abstract:The loss of farmland to urban use in peri-urban areas is a global phenomenon. Urban sprawl generates a decline in the availability of productive agricultural land around cities, causing versatile conflicts between nature and society and threatening the sustainability of urban agglomerations.
This study aimed to uncover the spatial pattern of long-term (80 years) land cover changes in the functional urban area of Budapest, with special attention to the conversion of agricultural land.
The paper is based on a unique methodology utilizing various data sources such as military-surveyed topographic maps from the 1950s, the CLC 90 from 1990, and the Urban Atlas from 2012. In addition, the multilayer perceptron (MLP) method was used to model land cover changes through 2040.
The research findings showed that land conversion and the shrinkage of productive agricultural land around Budapest significantly intensified after the collapse of communism. The conversion of arable land to artificial surfaces increased, and by now, the traditional metropolitan food supply area around Budapest has nearly disappeared. The extent of forests and grasslands increased in the postsocialist period due to national afforestation programs and the demand of new suburbanites for recreational space. Urban sprawl and the conversion of agricultural land should be an essential issue during the upcoming E.U. Common Agricultural Policy (CAP) reforms.
Keywords: urban sprawl; suburbanization; land conversion; peri-urban agriculture; artificial surfaces;
land use modeling; post-socialism; Budapest
1. Introduction
Urbanization plays a significant role in land use changes around the world. The rapid expansion of artificial surfaces in metropolitan regions has caused versatile conflicts between nature and society and has created challenges for sustainability [1–7]. Urban fringe areas are especially under the pressure of “urban sprawl”, as substantial areas of agricultural land along city boundaries have been converted into urbanized surfaces [8–15]. Land cover changes in suburban locations are driven by very complex socioeconomic factors and often result in environmental damage, landscape degradation, land fragmentation, and the shrinkage of wildlife habitat and undermine peri-urban agricultural capacity
Sustainability2020,12, 3331; doi:10.3390/su12083331 www.mdpi.com/journal/sustainability
Sustainability2020,12, 3331 2 of 20
and ecological balance [16,17]. However, experts have argued that suburban intensive farming is needed to supply food for a growing population and sustain quality, transparency, traceability, and security of food production [18–20]. In the past, many authors have documented how the growth of built-up areas has led to a rapid decline in agricultural land and other green surfaces around cities, generating negative impacts on biocapacity and sustainability [21–23]. Consequently, in the future, planning and managing urban expansion is “critical for ensuring agricultural growth and food security"
around cities and for the sustainable development of city regions [24,25].
Urban sprawl and the shrinkage of agricultural land are problems not only around the megacities of Asia, Africa, and the U.S., but also in large urban agglomerations in Europe [26–30]. In European metropolitan regions, an unbalanced mix of urban and rural functions have historically evolved.
Heterogeneous, fragmented mosaics of cultural landscapes are predominant, with complex land use patterns that function in combination with the prevailing socioeconomic characteristics around major urban centers [23]. During the postproductivist transition [31,32], when environmental protection received increasing attention, the loss of agricultural land became a central issue in European countries, particularly in the E.U. member states. There are basically two distinct processes behind the shrinkage of food supplying land: urban sprawl and land abandonment [33]. The fastest change takes place between the city and the countryside in the “urban–rural fringe” due to urban sprawl [34–36], mostly within 10 km of the boundaries of a compact city (i.e., built-up areas). Studies on Europe have summarized that in metropolitan zones, land conversion is often accompanied by the abandonment of agricultural land, mainly arable land and plantations [27,28,37,38]. As a result, many European cities have lost valuable, productive areas of agriculture, while there is a growing demand for multifunctional agricultural land [14,17,20,39,40]. The relevance of the process was also recognized by the European Environment Agency (EEA) in a comprehensive report published in 2006, entitled “Urban Sprawl in Europe—The Ignored Challenge” [41]. Several studies have focused on the socioeconomic, environmental, and infrastructural challenges caused by suburban growth in postsocialist countries. Assessing these phenomena, these papers have argued that the lack of appropriate policies and governance systems has played a decisive role in postsocialist urban sprawl [42–46].
The spread of urbanized surfaces has also been observed around Hungarian cities, especially in the metropolitan region of Budapest [47,48]. The spontaneity and unregulated nature of the process has created significant tensions and concerns [22]. Suburbanization has generated robust changes in the land use patterns around Budapest, resulting in the shrinkage of green areas and the destruction of natural values, while urbanized surfaces (e.g., commercial, office, and logistics centers) have expanded swiftly. “In 80 municipalities of the officially designated Budapest Agglomeration, the area of housing, economic, and leisure facilities increased from 180 to 411 km2between 1959 and 2014.” [47]. The peak of shrinkage in agricultural areas around Budapest was in the 1990s, immediately after the political and economic changes. According to some authors, suburbanization at that time was even faster than was Western European suburbanization a few decades earlier, with distinct spatial characteristics [48,49].
The “mass privatization” of the previously state-owned agricultural land as part of postsocialist transition caused the loss of vast farmlands in the outskirts of the Hungarian capital. Thus, the privatization of land significantly contributed to the acceleration of suburbanization processes and also gave way to intense land conversion producing new business developments (office parks, logistics centers, shopping centers), especially along motorways [49].
The main aim of this study was to uncover the spatial patterns (and their intensity) of long-term (80 years) land cover changes in the metropolitan region of Budapest and their underlying factors.
We also aim to provide some solutions. This research was partially built on the results of some previous works, such as findings on the general trends of urban sprawl in Budapest’s functional urban area (FUA) [48]; and the national [50] and regional land use change modeling from the National Adaptation Geo-Information System (NAGiS) [51]. The main objectives of these analyses were to explore the state-of-the-art of urban sprawl in the study area and to explore the links between future land use changes and climate change through a modeling approach. These studies have provided a good basis
for examining long-term land use changes in the Budapest FUA from the late 1950s to 2040; however, they did not pay attention to the loss of farmland and the restructuring of the agricultural sector.
The specific aim of this paper was to explore changes in agricultural land use under the constant pressure from urban sprawl, to shed light on the transformation of the agricultural sector, and to identify general characteristics that may provide a basis for comparison to other postsocialist cities in Central and Eastern Europe. The main research questions here were as follows:
• What have been the main sources of the growth of built-up areas in the FUA of Budapest in the past and what predictions can be made regarding future land conversion?
• What have been the main influencing factors?
• What have been the environmental, economic, and social impacts of sprawl from an agricultural perspective?
• What types of policy tools can be formulated to combat the loss of farmland around Budapest and other quickly transforming postsocialist cities?
In order to answer these questions, land use changes during the socialist (1959–1989) and the postsocialist era (1990–2012) are analyzed here in detail using different data sources. This is followed by modeling and predictions for the period 2012–2040. In the discussion and conclusion, we formulate policy recommendations.
2. Materials and Methods
2.1. The Study Area
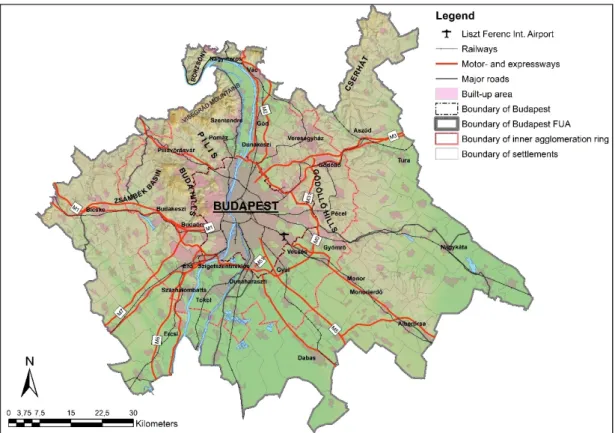
The study area covered the FUA of Budapest, which comprises 6077 km2with 186 municipalities.
It is the home of ca. 3 million people (1.7 million residing in Budapest). The 80 municipalities adjacent to Budapest constitute the inner ring of the metropolitan region, which is in an advanced stage of physical and functional fusion with the city, and hence it is also recognized legally as the Budapest Agglomeration. The rest of the municipalities in this study belong to the outer fringe of the wider metropolitan region (Figure1).
Sustainability2020,12, 3331 4 of 20
Sustainability 2020, 12, x FOR PEER REVIEW 3 of 19
2040; however, they did not pay attention to the loss of farmland and the restructuring of the agricultural sector. The specific aim of this paper was to explore changes in agricultural land use under the constant pressure from urban sprawl, to shed light on the transformation of the agricultural sector, and to identify general characteristics that may provide a basis for comparison to other postsocialist cities in Central and Eastern Europe. The main research questions here were as follows:
• What have been the main sources of the growth of built-up areas in the FUA of Budapest in the past and what predictions can be made regarding future land conversion?
• What have been the main influencing factors?
• What have been the environmental, economic, and social impacts of sprawl from an agricultural perspective?
• What types of policy tools can be formulated to combat the loss of farmland around Budapest and other quickly transforming postsocialist cities?
In order to answer these questions, land use changes during the socialist (1959–1989) and the postsocialist era (1990–2012) are analyzed here in detail using different data sources. This is followed by modeling and predictions for the period 2012–2040. In the discussion and conclusion, we formulate policy recommendations.
2. Materials and Methods
2.1. The Study Area
The study area covered the FUA of Budapest, which comprises 6077 km2 with 186 municipalities.
It is the home of ca. 3 million people (1.7 million residing in Budapest). The 80 municipalities adjacent to Budapest constitute the inner ring of the metropolitan region, which is in an advanced stage of physical and functional fusion with the city, and hence it is also recognized legally as the Budapest Agglomeration. The rest of the municipalities in this study belong to the outer fringe of the wider metropolitan region (Figure 1).
Figure 1. The functional urban area (FUA) of Budapest. Source: edited by the authors.
Figure 1.The functional urban area (FUA) of Budapest. Source: edited by the authors.
The study area featured a diverse landscape split into two parts by the Danube River. North (Börzsöny and Cserhát) and northwest (Visegrád Mountains, Pilis Mountains, and Buda Hills) of the river, mountainous, high-relief terrains prevail, while east of the Danube, the northern edge of the Great Hungarian Plain and the gentle slopes of the Gödöll˝o Hills provide low-lying and agriculturally more intensively used land. The diversity of the landscape and the Danube cutting through the mountain range were essential factors in the early development of the Hungarian capital [52].
Only a few decades after the unification of Buda, Pest, andÓbuda in 1873, the rapidly expanding new city outgrew its original boundaries. In the first half of the twentieth century, the municipalities surrounding the city were well-integrated into its urban texture. The present-day territory of Budapest (called Greater Budapest) was formed in 1950, with the incorporation of 7 towns and 16 villages in the close vicinity of the city. The weight of the city in the Hungarian urban system became disproportionate from that time on [53]. In the first decades of state socialism, the number of inhabitants quickly rose due to Soviet-type industrialization and the collectivization of agricultural land, resulting in a flow of farmers from rural areas to cities. At its peak, the population of Budapest reached over 2 million [54].
However, due to administrative constraints and the rapid industrial development of second-tier cities (county seats) in the country, the growth of Budapest gradually slowed down, and from the 1970s on, the population started to decrease due to demographic aging. At the same time, the population of the inner ring of the metropolitan region grew rapidly, mainly as an outcome of the first wave of suburbanization and the relocation of workplaces from Budapest to the periphery [55].
The diversity of the natural environment facilitated the formation of a spatially differentiated land use pattern around the city. The high-relief areas remained forested, while vineyards and fruit cultivation covered the hillslopes. In the low-lying plain areas, fertile brown forest and chernozem soils were occupied by arable land, while wetlands and salt-affected and sandy soils were traditionally used for extensive animal husbandry. In the 19th century, the introduction of labor-intensive horticulture made high yields even in the sandy areas possible, when Bulgarian farmers established lucrative gardening cooperatives on the riversides and wetlands (e.g., along the Danube) [56]. These changes turned the previously underutilized area into productive agricultural land with orchards and gardening
zones, feeding the rapidly growing population of Budapest. Additionally, in the second half of the 19th century, water regulations made the expansion of arable land at the expense of the former wetlands possible. The middle of the 20th century brought about the socialist reorganization of agriculture in the country, which finished around the time our analysis begins. Simultaneously, urban expansion accelerated, and urban use became a competitor to agricultural land use, resulting in the mass conversion of vineyards and garden zones into summer homes and permanent residences [53].
2.2. Methodological Considerations for Analyzing the Changes from 1959 to 1990
In order to unpack long-term land cover changes, various data sources were used, such as military-surveyed topographic maps from 1953 to 1959, the Corine Land Cover (CLC 90) from 1990, and the Urban Atlas from 2012. Since in their original form, these datasets are not compatible with each other, several harmonizing steps had to be taken.
The military survey maps from 1959 provided valuable information about the delimitation of artificial surfaces in this early period. However, agricultural, seminatural, and natural surfaces are displayed in these maps with much less detail. Its original raster form was interpreted and transformed into GIS vector data with onscreen digitizing. Digitization was limited only to artificial surfaces.
For the reconstruction of the more detailed land use patterns, supplementary county-level land cover data from the statistical yearbooks were used. In the process, a modified version (see later) of the Corine Land Cover map was used for detecting changes during the state socialist era. We investigated the new artificial surfaces appearing in the CLC 90 map by including all polygons over 15 ha and taking a random sample from the remainder. The examined area covered almost 20% of the artificial surface expansion between 1959 and 1990, and the original land cover categories were determined after individual consideration of the selected polygons.
2.3. Methodological Considerations for Analyzing the Changes from 1990 to 2012
Both the Corine Land Cover and Urban Atlas datasets are assembled by the European Environment Agency. For functional urban areas, the Urban Atlas offers a higher resolution and more elaborate classification of built-up areas [57], while the Corine Land Cover maps are more detailed regarding nonartificial surfaces [58,59]. To harmonize the data from the Urban Atlas, the CLC 90 was enhanced both in terms of resolution and built-up area classification.
For the improvement of resolution, two additional datasets were included: CLC 50, a special Corine map covering only Hungary [60], and the CLC Change 1990–2000. Both contain smaller mapping units and have higher spatial resolution than does the CLC 90 map. Therefore, they could be used for geometric corrections.
In the Urban Atlas, the “Discontinuous Urban Fabric” category is divided into four subcategories based on the percentage of soil sealing. To recreate this classification structure in the CLC 90 database, we used normalized difference vegetation index (NDVI) data derived from Landsat satellite images, a method successfully utilized by previous studies [61,62].
The lower resolution of the CLC could not display the elongated transportation network correctly.
To solve this problem, it was replaced with the detailed network of the Urban Atlas, with the exclusion of postsocialist expansions (e.g., motorways, roads around new housing blocks).
We also enhanced the Urban Atlas 2012 database: since in the case of agricultural and natural surfaces, the Corine Land Cover categories are more detailed, the areas described as agricultural or natural surfaces according to the Urban Atlas 2012 were replaced with the classifications taken from the Corine Land Cover 2012 database.
During these steps, we also paid special attention to filtering out false positive transformations, which can occur for the following reasons:
• Geometric mismatching caused by different resolutions and geometric accuracy;
• Classification mismatching caused by different classification systems;
Sustainability2020,12, 3331 6 of 20
• Interpretation mismatching caused by different interpretations of the same categories; and
• Detection mismatching caused by earlier (or later) categorization mistakes.
2.4. Future Predictions with the Use of the Land Change Modeler for ArcGIS
We chose the Clark Labs’ Land Change Modeler for ArcGIS as our modeling software, which is a popular and versatile tool (along with its IDRISI counterpart) for calculating land cover change models and forecasts [63–65]. To set up a land cover change model of a given area, two raster images with matching resolutions and classifications (depicting an earlier and later stage of land cover) are required.
We used our modified CLC 90 and Urban Atlas 2012 maps. To avoid data proliferation, some existing categories were aggregated, and others were excluded (e.g., water bodies, other artificial surfaces).
As a result, the number of analyzed categories was reduced to eight (urban fabric, industrial and commercial areas, arable land, vineyards, fruit gardens, heterogeneous agricultural areas, grasslands, and forested areas).
We used the Multilayer Perceptron (MLP) method for modeling, which utilizes an artificial neural network to recognize transition patterns based on a sample of transformed and unchanged raster cells.
To ensure a suitable sample size, we only kept the transitions with more than 1000 transitioned cells.
From the possible 56 transitions, only 31 were modeled, but the excluded 25 combinations made up only 2% of the total transitioning area.
The MLP requires additional spatial information in order to recognize meaningful transition patterns. The set of indicators can be freely assembled, taking the availability and the focus of research into consideration, which is a significant advantage over the similar SLEUTH model [66]. Our selected explanatory maps fell into four main thematic scopes:
• Neighborhood relations (e.g., distance from the road, built-up areas);
• Natural physical conditions (e.g., elevation, slope, soil type and quality);
• Agricultural indicators (e.g., subsidiaries, potential value from agricultural production, results from the agricultural census); and
• Socioeconomic indicators (e.g., population dynamics, average income).
The indices displaying spatial distance were calculated using base maps and other spatial datasets, while the rest of the indicators were collected from different data sources, including the following:
• The European Environment Agency/Copernicus Land Monitoring Service;
• The Agrotopographic database (AGROTOPO) of the Institute for Soil Sciences and Agricultural Chemistry (TAKI), Hungarian Academy of Sciences;
• Data from the Research Institute of Agricultural Economics;
• The Information System of Natural Protection (TIR);
• The National Adaptation Geo-Information System (NAGiS);
• The Hungarian Central Statistical Office—Inspire database;
• The Hungarian Central Statistical Office—T-STAR (municipality-level database);
• The Hungarian Central Statistical Office—population census;
• The Hungarian Central Statistical Office—agricultural census;
• The National Tax and Customs Administration (NAV) (the Hungarian National Spatial Development and Spatial Information System (TeIR)); and
• The General Transit Feed Specification database of the Centre of Budapest Transport (BKK).
From the provided information, the MLP generated transition potential maps for each category, which displayed the spatial probability of transition. These transition potential maps were used for future predictions. After this point, the prediction results could still be adjusted by declaring spatial constraints and incentives and by modifying the Markov matrix.
The “Constraints and Incentives” panel allowed us to declare areas with increased or decreased transition probability for each transformation of the model and even to rule out certain transitions in
designated areas. In this manner, MLP is similar to the exclusion layer of the SLEUTH model [66].
We used this function to introduce some planning regulations (e.g., Natura2000 areas, floodplains, areas designated for afforestation). We also used the “Constraints and Incentive” panel to integrate expectations about future demographic developments into the prediction. The demographic projection data were the output of parallel research focusing on the demographic prospects of Hungary [67].
Areas of population growth led to artificial surface expansion, while in other areas, urban sprawl was hindered.
Projections about climate change were also integrated into the prediction as constraints and incentives. Four different climate models from the Cordex database were used to create different scenarios [68]. In this paper, only the results of the EC45 scenario are presented, which we considered to be the most fitting version for the timescale of our research.
However, climate change not only influences the spatial configuration of some transitions, but can also alter the general rate of transformation. This could be integrated into the model by modifying the Markov matrix.
Without user involvement, the software estimates the number of future conversions based on the provided historical data by means of Markov chains. The calculated Markov transition probabilities are stored in a matrix that can be modified by the user to indicate alterations from historical trends.
From the available climate data, the number of frosty days and a drought indicator were used, and their influence on the 31 modeled transitions were estimated individually.
The Land Change Modeler offers two types of forecasts: a soft prediction depicting the spatial variance of the probability of change in the modeled area, and a hard prediction, which gives an exact land cover configuration for a given future date [69]. After setting up all the parameters, we created the predictions for 2040.
To validate our model, we used MLP precision and “Skill Measure” statistics, which were generated by the Land Change Modeler for each transition. The average MLP precision for the 31 submodels was 79.4% (14 were above 80%). The average “Skill Measure” value of the submodels was 0.58. The obtained results are considered good according to the software’s reference manual.
We also compared our results to the recently published Corine Land Cover Change data for 2012–2018. Due to its short timeframe (only covering 6 years of our 28-year-long predictions) and different methodology, the CLC Change dataset could not be used for quantitative and location validation, but it still supported our predictions of artificial surfaces, arable land, and forests.
3. Results
3.1. Land Use Changes during State Socialism (1959–1990)
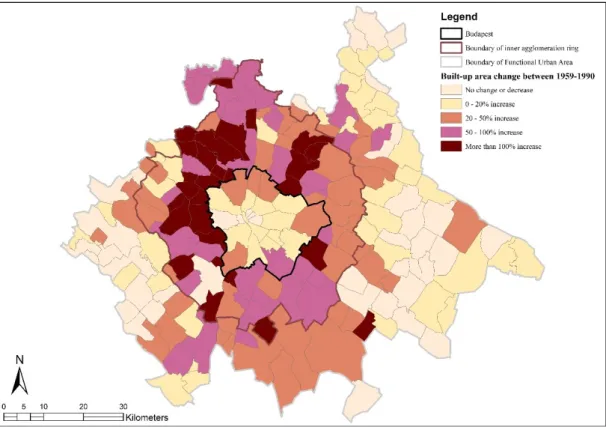
Between 1959 and 1990, the extent of built-up area increased by 22.3 thousand ha (from 71.8 to 94.1 thousand ha), which means an annual average growth rate of 719 ha. The growth in artificial surfaces was concentrated mainly within Budapest and the inner ring of the metropolitan region.
The gradual enlargement of Budapest International Airport and the establishment of an oil refinery in Százhalombatta in the southwest were the two biggest projects, which increased the artificial areas by almost 1000 ha in total (Figure2).
Sustainability2020,12, 3331 8 of 20
Sustainability 2020, 12, x FOR PEER REVIEW 7 of 19
submodels was 79.4% (14 were above 80%). The average “Skill Measure” value of the submodels was 0.58. The obtained results are considered good according to the software’s reference manual.
We also compared our results to the recently published Corine Land Cover Change data for 2012–2018. Due to its short timeframe (only covering 6 years of our 28-year-long predictions) and different methodology, the CLC Change dataset could not be used for quantitative and location validation, but it still supported our predictions of artificial surfaces, arable land, and forests.
3. Results
3.1. Land Use Changes During State Socialism (1959–1990)
Between 1959 and 1990, the extent of built-up area increased by 22.3 thousand ha (from 71.8 to 94.1 thousand ha), which means an annual average growth rate of 719 ha. The growth in artificial surfaces was concentrated mainly within Budapest and the inner ring of the metropolitan region. The gradual enlargement of Budapest International Airport and the establishment of an oil refinery in Százhalombatta in the southwest were the two biggest projects, which increased the artificial areas by almost 1000 ha in total (Figure 2).
Figure 2. The expansion of built-up zones between 1959 and 1990. Source: elaboration of the authors.
With the sample selection process described in the methodology section, we determined that the primary source of this increase was the conversion of agricultural land (86%), while the rest was comprised of different (semi-)natural areas (e.g., forests, grasslands, shrubs, and wetlands), former mining areas, and dump sites (Table 1).
A detailed analysis of the data showed that 51% of the artificial land extension was derived from the conversion of arable land and vineyards. However, it is worth noting that the conversion rate of the vineyards was higher in relative terms, indicating the vulnerability of this land use category. The relatively high share (14%) of complex cultivation patterns is in line with this result, since this category also contained a mixture of vineyards and orchards along with some other heterogeneous
Figure 2.The expansion of built-up zones between 1959 and 1990. Source: elaboration of the authors.
With the sample selection process described in the methodology section, we determined that the primary source of this increase was the conversion of agricultural land (86%), while the rest was comprised of different (semi-)natural areas (e.g., forests, grasslands, shrubs, and wetlands), former mining areas, and dump sites (Table1).
A detailed analysis of the data showed that 51% of the artificial land extension was derived from the conversion of arable land and vineyards. However, it is worth noting that the conversion rate of the vineyards was higher in relative terms, indicating the vulnerability of this land use category.
The relatively high share (14%) of complex cultivation patterns is in line with this result, since this category also contained a mixture of vineyards and orchards along with some other heterogeneous agricultural areas (e.g., scattered farm areas). Pastures and forests had relatively low rates of land conversion, indicating that these two categories were better-valued (more protected) during state socialism. Pastures were owned mainly by cooperatives and served the needs of dairy production targeting Budapest, whereas forests were managed predominantly by the National Forest Authority.
Thus, both land use categories were under strict state control.
Table 1.The share of built-up area extensions by former land use category, 1959–1990.
Land Use Category Share from the New Built-Up Zones (%)
Arable land 34.27
Vineyards 17.17
Orchards and berry plantations 5.77
Pastures 14.45
Complex cultivation patterns 14.66
Agriculture subtotal 86.32
Forests 5.10
Other 8.58
Total 100.00
Source: elaboration of the authors.
3.2. Land Use Changes after the Political Transition (1990–2012)
According to our analysis, the collapse of state socialism did not alter the general direction of land use change; however, it significantly affected the transition rate of some categories. As the data showed, the extent of artificial surfaces increased by 23.2 thousand ha between 1990 and 2012 (from 94.1 to 117.3 thousand ha). This means an average annual growth rate of 1055 ha, which is 46% higher than the rate before the political transition. This indicates the acceleration of the sprawl and concomitant land conversion in the postsocialist era. Another difference compared to the pre-1990 period was that the tempo of land conversion became more rapid in villages farther from Budapest with attractive landscapes (e.g., Zsámbék Basin) or in small towns with good transport network connections (e.g., Dabas). In both cases, residential suburbanization was the main factor. Regarding business functions, the most intensive land conversion took place in the southern fringe of Budapest, along the M0 corridor and near the first section of the M1 motorway leading to Vienna (e.g., Budaörs, Törökbálint).
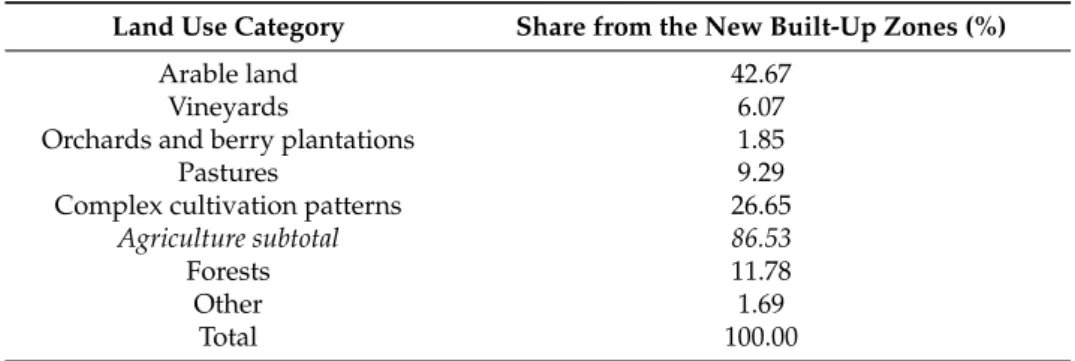
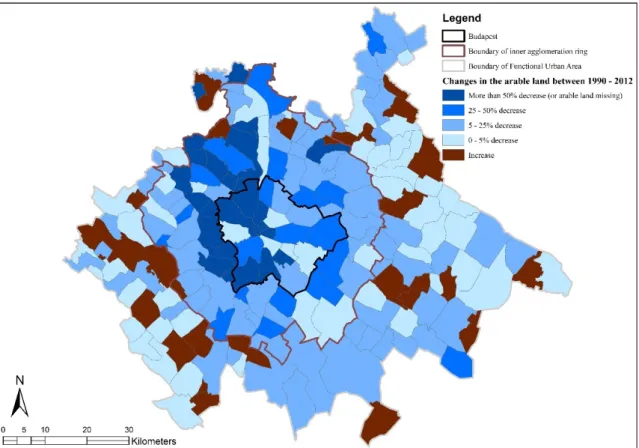
While the share of agricultural area converted to artificial areas remained the same (86%), some shifts between the different categories could be observed (Table2). The contribution of arable land increased, whereas the share of vineyards significantly decreased. The ratio of complex cultivation patterns also increased (by 13%), which indicates the rapid transition of the formerly loosely populated outskirts and scattered farm areas. However, the largest loss (of 22,400 ha) was recorded in the arable land category (Figure3), while the area of complex surfaces shrank by 7700 ha. The share of orchards and pastures also decreased by ca. 5%; nevertheless, the extent of pastures grew by 9500 ha.
Table 2.The share of built-up area extensions by former land use category, 1990–2012.
Land Use Category Share from the New Built-Up Zones (%)
Arable land 42.67
Vineyards 6.07
Orchards and berry plantations 1.85
Pastures 9.29
Complex cultivation patterns 26.65
Agriculture subtotal 86.53
Forests 11.78
Other 1.69
Total 100.00
Source: elaboration of the authors.
The conversion of forests to urbanized surfaces also intensified in the postsocialist period, which could have been associated with the increasing pressure of suburbanization on suitable construction land, especially in attractive hilly landscapes. Despite this trend, the extent of forests in the research area increased by 4400 ha between 1990 and 2012, mainly due to a state-led afforestation program affecting the Gödöll˝o Hills and the Danube–Tisza Interfluve in the east of Budapest.
Sustainability2020,12, 3331 10 of 20
Sustainability 2020, 12, x FOR PEER REVIEW 9 of 19
Other 1.69
Total 100.00
Source: elaboration of the authors.
The conversion of forests to urbanized surfaces also intensified in the postsocialist period, which could have been associated with the increasing pressure of suburbanization on suitable construction land, especially in attractive hilly landscapes. Despite this trend, the extent of forests in the research area increased by 4400 ha between 1990 and 2012, mainly due to a state-led afforestation program affecting the Gödöllő Hills and the Danube–Tisza Interfluve in the east of Budapest.
Figure 3. Changes in the area of arable land by municipality, 1990–2012. Source: elaboration of the authors
3.3. The Results of the Land Cover Change Forecast (2012–2040)
The main directions of the forecasted changes for the 2012–2040 period were in line with the trends of the postsocialist era, which was partially a consequence of the described modeling methodology. Our results indicated a further increase in artificial surfaces by 22.8 thousand ha by 2040. This means an average yearly conversion rate of 814 ha, which falls below the calculated growth rates of the postsocialist periods. These results can be understood as the interplay of further sprawl and the consequences of the “Act on Spatial Planning in the Agglomeration of Budapest (2005)”, which introduced planning constraints to control urban sprawl. According to our projections, the newly developed built-up areas will be located close to the already existing artificial surfaces. The conversion of the currently loosely populated complex agricultural areas (with mixed agricultural, economic, and demographic functions) into densely built-up areas is also predicted. The remaining open arable land in the growth axes of the agglomeration ring will also disappear, and thus an accelerated physical merging (conurbation) of the inner ring of the agglomeration is foreseen (Figure 4). This process has been acknowledged (and thus not hindered administratively) by planning documents such as the recently prepared “Structural Plan of the Budapest Agglomeration” [70].
Figure 3. Changes in the area of arable land by municipality, 1990–2012. Source: elaboration of the authors.
3.3. The Results of the Land Cover Change Forecast (2012–2040)
The main directions of the forecasted changes for the 2012–2040 period were in line with the trends of the postsocialist era, which was partially a consequence of the described modeling methodology.
Our results indicated a further increase in artificial surfaces by 22.8 thousand ha by 2040. This means an average yearly conversion rate of 814 ha, which falls below the calculated growth rates of the postsocialist periods. These results can be understood as the interplay of further sprawl and the consequences of the “Act on Spatial Planning in the Agglomeration of Budapest (2005)”, which introduced planning constraints to control urban sprawl. According to our projections, the newly developed built-up areas will be located close to the already existing artificial surfaces. The conversion of the currently loosely populated complex agricultural areas (with mixed agricultural, economic, and demographic functions) into densely built-up areas is also predicted. The remaining open arable land in the growth axes of the agglomeration ring will also disappear, and thus an accelerated physical merging (conurbation) of the inner ring of the agglomeration is foreseen (Figure4). This process has been acknowledged (and thus not hindered administratively) by planning documents such as the recently prepared “Structural Plan of the Budapest Agglomeration” [70].
Figure 4. The land cover of the core area of the Budapest Agglomeration in 2012 and the projected changes by 2040. Source: elaboration of the authors.
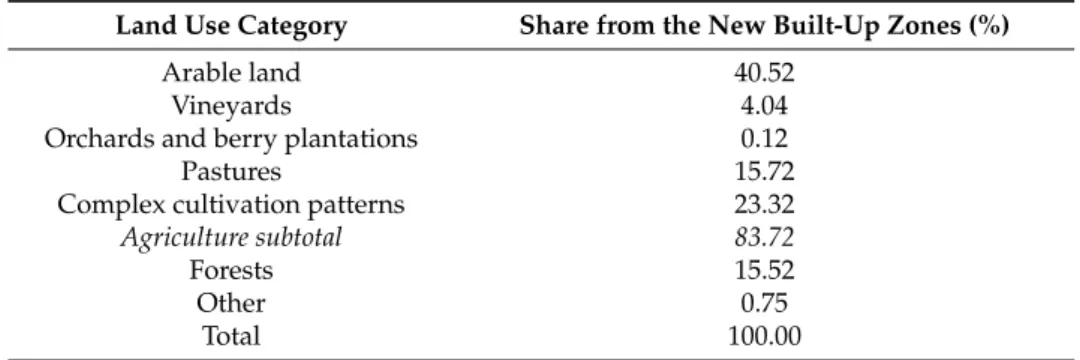
With only a slight decrease, agricultural land will continue to serve as the main source of urbanized surfaces (84%). Arable land is projected to contribute by 40%, while complex cultivation patterns will account for 23% of converted land, which means that arable land will face a 30 thousand ha loss in overall territory, while the area of complex cultivation patterns will be reduced by a further 5000 ha (Table 3).
Table 3. The projected share of built-up area extensions by former land use category, 2012–2040.
Land Use Category Share from the New Built-Up Zones (%)
Arable land 40.52
Vineyards 4.04 Orchards and berry plantations 0.12
Pastures 15.72 Complex cultivation patterns 23.32
Agriculture subtotal 83.72
Forests 15.52 Other 0.75
Total 100.00 Source: elaboration of the authors.
On the contrary, pastures may possibly increase their area by 10 thousand ha by 2040, even though this category will contribute 15% to the total land consumed by urban sprawl. The 15% share of forests is about the same as their share from the total land cover of the area (similar to pastures), whereas an increase of 5000 ha in forest land cover is predicted. According to the prediction, future urban sprawl will not pose a threat to the remaining orchards (and an increase of 500 ha is expected), while vineyards will provide 4% of the area lost to artificial surfaces and may lose one-third of their territory (around 1500 hectares) in the near future.
Figure 4. The land cover of the core area of the Budapest Agglomeration in 2012 and the projected changes by 2040. Source: elaboration of the authors.
With only a slight decrease, agricultural land will continue to serve as the main source of urbanized surfaces (84%). Arable land is projected to contribute by 40%, while complex cultivation patterns will account for 23% of converted land, which means that arable land will face a 30 thousand ha loss in overall territory, while the area of complex cultivation patterns will be reduced by a further 5000 ha (Table3).
Table 3.The projected share of built-up area extensions by former land use category, 2012–2040.
Land Use Category Share from the New Built-Up Zones (%)
Arable land 40.52
Vineyards 4.04
Orchards and berry plantations 0.12
Pastures 15.72
Complex cultivation patterns 23.32
Agriculture subtotal 83.72
Forests 15.52
Other 0.75
Total 100.00
Source: elaboration of the authors.
On the contrary, pastures may possibly increase their area by 10 thousand ha by 2040, even though this category will contribute 15% to the total land consumed by urban sprawl. The 15% share of forests is about the same as their share from the total land cover of the area (similar to pastures), whereas an increase of 5000 ha in forest land cover is predicted. According to the prediction, future urban sprawl will not pose a threat to the remaining orchards (and an increase of 500 ha is expected), while vineyards will provide 4% of the area lost to artificial surfaces and may lose one-third of their territory (around 1500 hectares) in the near future.
Sustainability2020,12, 3331 12 of 20
4. Discussion
The results of our research can be summarized as three theorems:
1. Due to urban sprawl, the extent of artificial surfaces in the FUA of Budapest will increase over time, irrespective of the economic and political system;
2. Land conversion will affect different types of agricultural, natural, and seminatural land use cover to varying degrees; and
3. The decline in agricultural, natural, and seminatural areas will not be a general phenomenon and will not cover all categories.
4.1. The Continously Expanding Urban Shadow of Budapest
The most important lesson from our 80-year analysis is that the area of artificial surfaces and their proportion within the land use of Budapest’s FUA have been dynamically increasing since the late 1950s; however, the periods before and after the change in regime (1989-90) had distinct characteristics as far as the intensity and spatiality of land conversion is concerned.
In the state socialist period (1959–1990), the rapid growth of population, both in the core city and the inner agglomeration, was decisive. Population growth in the inner agglomeration was also fostered by legal regulations prohibiting the free movement of people to the territory of Budapest after 1958. The growth in residential areas was the fastest in the eastern and southeastern sectors of the study area. The situation was similar for the economy, because industrial developments were banned in Budapest and 44 surrounding settlements after 1959. Despite this fact, industrial developments led to large-scale conversions that could not be controlled by bureaucratic measures or by favoring and supporting the industrialization of rural areas. Since possible sites of industrial expansion in Budapest were essentially exhausted by the 1960s, industrial development was increasingly taking place in the surrounding suburban settlements [71]. In the 1970s and 1980s, immigration to the urban region from the countryside gradually declined, and the tempo of industrial and economic development slowed down compared to the previous decades, which led to lower levels of land conversion.
After the political and economic transition (1990), due to suburbanization (similarly to other East-Central European metropolitan areas [72]), large numbers of residents moved from Budapest to the suburbs, mainly to the environmentally more attractive western and northwestern sectors.
The hilly municipalities of the Buda Hills and the Pilis Mountain became popular destinations for suburbanites. Another important difference compared to the previous period was that the effects of suburbanization appeared not only in the vicinity of Budapest but also in more remote areas [73].
This was also facilitated by the suburbanization of the economy, which expanded to as far as 50–60 km on the main roads leading to Budapest [74]. The construction of motorways (M0) and connecting highways improved Budapest’s accessibility, making a significant contribution to intensifying land use changes in more remote areas, in most cases in the outer agglomeration belt [48], a phenomenon that has been documented also by other case studies [75].
During the privatization and economic restructuring process of the 1990s, the emergence of western investors and transnational companies generated an upswing both in transport infrastructure and real estate development (e.g., offices). At the end of the decade, hypermarkets, shopping centers, and industrial and logistics parks emerged in the outskirts of Budapest as part of the suburbanization of the economy.
It is a common feature of both the state socialist and postsocialist periods that new developments appeared primarily near the existing residential and economic areas and along major roads, thereby strengthening the conurbation of urban fabric surfaces. Thus, accessibility and the availability of public infrastructure played a decisive role in new developments during both periods. However, it is also important to emphasize that although the growth of artificial surfaces showed many similarities in the two investigated periods, there were significant differences in the drivers of land conversion.
During state socialism, centrifugal forces (the nationalization of agricultural land, the mass migration
of labor, industry-based urbanization) sustained agglomeration tendencies. After the collapse of communism, centripetal forces (the privatization of land, suburbanization, the deconcentration of workplaces) generated a robust decentralization of urban functions and subsequent urban sprawl.
Another difference is the acceleration of the rate of land conversion after the change of regime, which meant significant spatial rearrangements in the society and economy liberated from state control.
4.2. The Role of Space and Policy
Our findings also confirmed that urban encroachment into peri-urban zones affected the different agricultural, natural, and seminatural land use categories to varying degrees. The growth of artificial surfaces occurred mainly adjacent to existing residential areas after 1959. They occupied land with good or outstanding agricultural potential, which were part of the traditional food supply zone of Budapest. The original land use was primarily gardens, vineyards, and orchards. However, not only did the growth of built-up areas threaten these land use categories, but they were also converted due to the second wave of cooperative consolidation. As a result of this process, the land was owned by the community, and cooperatives became the producers. These socialist agricultural cooperatives continuously struggled with labor shortages due to competition from the industrial sector. Gardening, vineyards, and fruit plantations were labor-intensive and could not be mechanized: the maintenance of production was, therefore, difficult even in backyard farms, so these areas were more beneficial for local municipalities if they were built up. Later, in the 1970s, with the emergence of industrial agriculture, the emphasis shifted to highly mechanized sectors such as field production even more, so vineyards and fruit plantations that had been converted earlier were not replaced. Although agriculture benefited from significant state subsidies during state socialism, and its exports were important to the national economy (especially for hard currency), it was nevertheless unable to compete with the development needs and land consumption of other sectors (e.g., industry, housing).
Rapid suburbanization after the change of regime meant a lot of pressure for agricultural land and a demand for new areas for development for the FUA of Budapest. At the same time, changes in the agricultural sector also allowed for the intensification of the conversion of agricultural land due to the deepening crisis caused by economic restructuring and privatization in Hungary and due to the loss of COMECON markets. A large proportion of the new landowners had neither the knowledge nor the capital to cultivate their newly acquired land. Even if we ignore the market crisis, these farms would not have been able to survive on production alone due to their small size (usually 1–2 ha) [76].
Between 1990 and 1998, agricultural subsidies were temporarily discontinued, and a new agricultural development program (with area-based payments similar to single area payment scheme (SAPS); in addition, agro-environmental measures after 2003) was launched before the E.U. accession [77].
As a consequence, farmers were left without income-stabilizing incentive programs during the most challenging period of transition, which, according to Alonso’s theory [78] of land rent (1964), facilitated the conversion of agricultural areas into new artificial surfaces. With regard to Freshwater’s [33] (2008) theory on the postproductivist transition period of agriculture, these conversions could have occurred in two places in space: in remote peripheral areas or in the vicinity of big cities, from which the latter was typical in our case study area. This situation did not change significantly even after accession to the E.U. in 2004, as the profitability of agriculture (especially the livestock sector) remained consistently low compared to other sectors [77]. This fact also indicates that even with agricultural subsidies, the income-producing ability of the agricultural sector could not compete with other land use forms.
According to Freshwater [33], this problem must be addressed by agricultural policy, so there are tasks to be done during the next reform of E.U.’s Common Agricultural Policy (CAP).
Over the last 30 years, urban sprawl has had a negative impact on vineyards and horticultural producers close to the boundaries of the compact city (in line with von Thünen’s model). The shrinkage in their size shows that the traditional metropolitan food supply area around Budapest has mostly disappeared in the inner agglomeration ring. Landowners and farmers acted according to their economic interests, but this did not coincide with the interests of the agro-business sector and, more
Sustainability2020,12, 3331 14 of 20
importantly, local society. Budapest is the biggest fresh food market and processor of agricultural products in Hungary. Because of sprawl, this demand can no longer be met locally, and more remote areas are now involved, which has resulted in higher food prices, longer supply chains, and a bigger carbon footprint, which is economically and environmentally unsustainable [79].
4.3. Grasslands and Forests: Deviations from a General Trend?
Even though the decline of agricultural, natural, and seminatural areas seems to have been a general trend in the agglomeration of Budapest between 1990 and 2012, there were two exceptions:
grasslands and forests, which grew by 9500 ha and 4400 ha, respectively. In the case of grasslands, this could be observed primarily in the northern/northwestern part of the FUA. The reasons are complex, but residential mobility certainly played a role here. The mass arrival of high-status residents in the framework of suburbanization generated a high demand for grasslands for recreational purposes, and many of the new grassland areas were used for free-time activities or recreation (e.g., equestrian tourism). The growth of grasslands may also indicate the mushrooming of plots for investment/real estate developments, which were no longer cultivated by the owners and were only maintained to preserve their good environmental condition (e.g., the clearance of ragweed) until sale. This behavior is exactly in line with Sinclair’s theory [80] (1967), which claims that the intensity of agricultural land use and investment decreases in anticipation of urban land development. Another possible factor is the introduction of European agro-environmental measures (e.g., Natura 2000), which may also have directed land use.
Deforestation and reforestation, especially in the upland (western/northwestern) parts of the metropolitan region, were not typical for any of the investigated periods, and therefore their share in land conversion was negligible. This was also the result of the successful implementation of forest management and nature conservation objectives, a process further strengthened by the preferences of new (mostly high-status) residents arriving in the framework of the suburbanization process. These residents generally tended to appreciate and preserve unbuilt areas, which they deemed valuable for recreational purposes.
According to our modeling, the area of fruit plantations may grow by about 500 ha by 2040.
However, the realization of this will depend to a large extent on sectoral (e.g., plantation support measures) and environmental factors (climate change).
The above examples illustrate that changes in land use caused by urban sprawl are not necessarily one-way, i.e., the conversions are not just from agricultural and natural areas to artificial surfaces. Land conversion processes are complicated because of the diverse needs and interests of residents and other stakeholders (e.g., firms, local governments) involved in suburbanization.
4.4. The Aftermarth of Sprawl
According to our land use change model, by 2040, the expansion of artificial surfaces in the metropolitan region of Budapest will strongly influence the sustainability of the FUA and the resilience of its settlements (Figure5):
• Sprawl will negatively impact the biological capacity of the agglomeration and reduce carbon sequestration by vegetation and soils;
• It will also reduce the amount of food that can be produced at a given technological level;
• Soil sealing will reduce the utilization of rainfall, help the drainage of water (especially in the hilly areas of the northwest and west of the region), increase the possibility of flash floods and other
“havaria” events, and altogether worsen the area’s water management capabilities;
• Open views of landscapes will disappear because of conurbation, and this will also close ecological corridors and cause the fragmentation of habitats and populations;
• The disappearance and degradation of agro-ecosystems will also adversely affect the state of the seminatural ecosystems still present in the area.
The above-mentioned environmental impacts will also have consequences on the FUA’s society and economy. The growth of artificial surfaces will increase the area and effects of urban heat islands.
The conurbation of individual settlements will hinder the ventilation of densely built areas, making it difficult to access water surfaces and forests or to enjoy their benefits. Moreover, this can induce adverse changes not only in the climate but also in other parameters that determine living conditions.
As a result, suburban municipalities may lose the very values and benefits (living space of sufficient size, an attractive environment, outdoor recreational opportunities, etc.) that, in principle, are crucial for their attractiveness. Deteriorating living conditions are expected to be accompanied by growing environmental pressures, such as commuting, which increases energy consumption, ecological footprints, and emissions [81,82].
Sustainability 2020, 12, x FOR PEER REVIEW 14 of 19
The above-mentioned environmental impacts will also have consequences on the FUA's society and economy. The growth of artificial surfaces will increase the area and effects of urban heat islands.
The conurbation of individual settlements will hinder the ventilation of densely built areas, making it difficult to access water surfaces and forests or to enjoy their benefits. Moreover, this can induce adverse changes not only in the climate but also in other parameters that determine living conditions.
As a result, suburban municipalities may lose the very values and benefits (living space of sufficient size, an attractive environment, outdoor recreational opportunities, etc.) that, in principle, are crucial for their attractiveness. Deteriorating living conditions are expected to be accompanied by growing environmental pressures, such as commuting, which increases energy consumption, ecological footprints, and emissions [81,82].
Figure 5. The impacts of urban sprawl on the functional urban area of Budapest. Source: elaboration of the authors.
4.5. Concluding Remarks
This paper aimed to shed light on the complex environmental, economic, and social impacts of urban sprawl in the metropolitan region of Budapest over a long period of time. The triggering factors during state socialism and postsocialism were essentially different, as were the planning frameworks;
nevertheless, the intensity and the logic of land conversion were quite similar during the two historical periods. According to our projection, urban sprawl will pose increasing challenges for urban planning and management in the future. The conversion of agricultural land is an agricultural policy issue that has not received sufficient attention among European and Hungarian policymakers.
In our opinion, urban sprawl and land consumption should be slowed down, which would serve both economic and social interests. The problem of urban sprawl should be an essential issue in the upcoming E.U. Common Agricultural Policy (CAP) reforms because agricultural subsidies and efforts to develop short food chains can play an important role in consolidating or reversing the negative impacts of sprawl—not just in Hungary, but in all of Europe.
Future research in the field should focus on related topics that can provide useful information for urban planners and agricultural policymakers regarding the long-term effects of urban sprawl.
Of these topics, urban heat island effects and changes in the output of agricultural production as an outcome of urban sprawl deserve particular attention. In addition, we think our land use change modeling and prediction methodology could easily be used for other postsocialist cities in Central and Eastern Europe, making a comparative analysis possible.
Author Contributions: conceptualization, J.L., J.Zs.F., and Z.K.; methodology, J.L., Z.K., J.Zs.F., and A.M.; formal analysis, J.L. and J.Zs.F.; investigation, J.L., Z.K., J.Zs.F., A.D.K., and R.M.; data curation, J.L., Z.K., J.Zs.F., D.B., A.M., and R.M.; writing—original draft preparation, J.L., J.Zs.F., and A.D.K.; writing—review and editing, Z.K., A.M., and R.M.; visualization, J.L. and J.Zs.F.; supervision, Z.K; funding acquisition, J.L. and Z.K. All authors have read and agreed to the published version of the manuscript.
Figure 5.The impacts of urban sprawl on the functional urban area of Budapest. Source: elaboration of the authors.
4.5. Concluding Remarks
This paper aimed to shed light on the complex environmental, economic, and social impacts of urban sprawl in the metropolitan region of Budapest over a long period of time. The triggering factors during state socialism and postsocialism were essentially different, as were the planning frameworks;
nevertheless, the intensity and the logic of land conversion were quite similar during the two historical periods. According to our projection, urban sprawl will pose increasing challenges for urban planning and management in the future. The conversion of agricultural land is an agricultural policy issue that has not received sufficient attention among European and Hungarian policymakers. In our opinion, urban sprawl and land consumption should be slowed down, which would serve both economic and social interests. The problem of urban sprawl should be an essential issue in the upcoming E.U.
Common Agricultural Policy (CAP) reforms because agricultural subsidies and efforts to develop short food chains can play an important role in consolidating or reversing the negative impacts of sprawl—not just in Hungary, but in all of Europe.
Future research in the field should focus on related topics that can provide useful information for urban planners and agricultural policymakers regarding the long-term effects of urban sprawl.
Of these topics, urban heat island effects and changes in the output of agricultural production as an outcome of urban sprawl deserve particular attention. In addition, we think our land use change modeling and prediction methodology could easily be used for other postsocialist cities in Central and Eastern Europe, making a comparative analysis possible.
Author Contributions:Conceptualization, J.L., J.Z.F., and Z.K.; methodology, J.L., Z.K., J.Z.F., and A.M.; formal analysis, J.L. and J.Z.F.; investigation, J.L., Z.K., J.Z.F., A.D.K., and R.M.; data curation, J.L., Z.K., J.Z.F., D.B., A.M., and R.M.; writing—original draft preparation, J.L., J.Z.F., and A.D.K.; writing—review and editing, Z.K., A.M., and R.M.; visualization, J.L. and J.Z.F.; supervision, Z.K; funding acquisition, J.L. and Z.K. All authors have read and agreed to the published version of the manuscript.
Sustainability2020,12, 3331 16 of 20
Funding:This research was funded by the Hungarian Scientific Research Fund (OTKA), grant number K119710;
the National Research, Development, and Innovation Fund of Hungary, grant number PD 128372; the Ministry of Human Capacities, Hungary grant number 20391-3/2018/FEKUSTRAT; and the Ministry for Innovation and Technology, Hungary grant number TUDFO/47138-1/2019-ITM.
Conflicts of Interest:The authors declare no conflicts of interest.
References
1. Ewing, R.H. Characteristics, Causes, and Effects of Sprawl: A Literature Review. InUrban Ecology: An International Perspective on the Interaction between Humans and Nature; Marzluff, J.M., Shulenberger, E., Endlicher, W., Alberti, M., Bradley, G., Ryan, C., Simon, U., ZumBrunnen, C., Eds.; Springer: Boston, MA, USA, 2008; pp. 519–535.
2. Marsden, T.; Sonnino, R. Human health and wellbeing and the sustainability of urban–regional food systems.
Curr. Opin. Environ. Sustain.2012,4, 427–430. [CrossRef]
3. Mora, O.; Lançon, F.; Aubert, F. Urban-rural linkages and their future: Impacts on agriculture, diets and food security. Food Security: Meanings, Practices and Policies, Agriculture in an Urbanizing Society. Second International Conference on Agriculture in an Urbanizing Society, Reconnecting Agriculture and Food Chains to Societal Needs: Rome, Italy, 14–17 September 2015. Available online: https://halshs.archives- ouvertes.fr/halshs-01292342(accessed on 22 September 2019).
4. Bren d’Amour, C.; Reitsma, F.; Baiocchi, G.; Barthel, S.; Güneralp, B.; Erb, K.H.; Haberl, H.; Creutzig, F.;
Seto, K.C. Future urban land expansion and implications for global croplands.Proc. Natl. Acad. Sci. USA 2017,114, 8939–8944. [CrossRef] [PubMed]
5. Anas, A.; Pines, D. Anti-sprawl policies in a system of congested cities. Reg. Sci. Urban Econ. 2008,38, 408–423. [CrossRef]
6. Wilson, B.; Chakraborty, A. The Environmental Impacts of Sprawl: Emergent Themes from the Past Decade of Planning Research.Sustainability2013,5, 3302. [CrossRef]
7. Oueslati, W.; Alvanides, S.; Garrod, G. Determinants of urban sprawl in European cities.Urban Stud. 2015, 52, 1594–1614. [CrossRef] [PubMed]
8. Anas, A.; Arnott, R.; Small, K.A. Urban Spatial Structure.J. Econ. Lit.1998,36, 1426–1464.
9. Brueckner, J.K. Urban Sprawl: Diagnosis and Remedies.Int. Reg. Sci. Rev.2000,23, 160–171. [CrossRef]
10. Johnson, M.P. Environmental Impacts of Urban Sprawl: A Survey of the Literature and Proposed Research Agenda.Environ. Plan. A2001,33, 717–735. [CrossRef]
11. Robinson, L.; Newell, J.P.; Marzluff, J.M. Twenty-five years of sprawl in the Seattle region: Growth management responses and implications for conservation.Landsc. Urban Plan.2005,71, 51–72. [CrossRef]
12. Da Silva Machado, F. Rural change in the context of globalization. Hung. Geogr. Bull. 2017,66, 43–53.
[CrossRef]
13. Irwin, E.G.; Bockstael, N.E. The evolution of urban sprawl: Evidence of spatial heterogeneity and increasing land fragmentation.Proc. Natl. Acad. Sci. USA2007,104, 20672–20677. [CrossRef] [PubMed]
14. Gutzler, C.; Helming, K.; Balla, D.; Dannowski, R.; Deumlich, D.; Glemnitz, M.; Knierim, A.; Mirschel, W.;
Nendel, C.; Paul, C. Agricultural land use changes—A scenario-based sustainability impact assessment for Brandenburg, Germany.Ecol. Indic.2015,48, 505–517. [CrossRef]
15. Lagrosa, J.J.; Zipperer, W.C.; Andreu, M.G. Projecting Land-Use and Land Cover Change in a Subtropical Urban Watershed.Urban Sci.2018,2, 11. [CrossRef]
16. Livanis, G.; Moss, C.B.; Breneman, V.E.; Nehring, R.F. Urban sprawl and farmland prices.Am. J. Agric. Econ.
2006,88, 915–929. [CrossRef]
17. Padasas, R. Farming in the Urban Shadow. Agricultural Innovation and Adaptation Strategies in Peri-Urban Valencia and Copenhagen. Master’s Thesis, 4CITIES Master Program, VRIJE Universiteit, Brussels, Belgium, 2019. Available online: https://www.4cities.eu/wp-content/uploads/2019/10/C10_MAthesis_
4CITIES_PADASAS_Robern.pdf(accessed on 11 October 2019).
18. Cavailhès, J.; Peeters, D.; Sekeris, E.; Thisse, J.F. The periurban city: Why to live between the suburbs and the countryside.Reg. Sci. Urban Econ.2004,34, 681–703. [CrossRef]
19. Coisnon, T.; Oueslati, W.; Salanié, J. Urban Sprawl Occurrence under Spatially Varying Agricultural Bid-Rent and Amenities.Reg. Sci. Urban Econ.2014,44, 38–49. [CrossRef]
20. Piorr, A.; Zasada, I.; Doernberg, A.; Zoll, F.; Ramme, W.Research for AGRI Committee—Urban and Peri-Urban Agriculture in the EU; European Parliament, Policy Department for Structural and Cohesion Policies: Brussels, Belgium, 2018. Available online:http://www.europarl.europa.eu/RegData/etudes/STUD/2018/617468/IPOL_
STU(2018)617468_EN.pdf(accessed on 16 November 2019).
21. Frumkin, H. Urban sprawl and public health.Public Health Rep.2002,117, 201–217. [CrossRef]
22. Szirmai, V. Urban sprawl in Europe.Reg. Stat.2012,2, 129–148. Available online:http://www.ksh.hu/docs/
hun/xftp/terstat/2012/RS02109.pdf(accessed on 6 December 2019). [CrossRef]
23. Ravetz, J.; Fertner, C.; Nielsen, T.S. The Dynamics of Peri-Urbanization. InPeri-Urban Futures: Scenarios and Models for Land Use Change in Europe; Nilsson, K., Pauliet, S., Bell, S., Aalbers, C., Sick Nielsen, T.A., Eds.;
Springer Verlag: Heidelberg, Germany, 2013; pp. 13–44. [CrossRef]
24. Gumma, M.K.; Irshad, M.; Nedumaran, S.; Whitbread, A.; Lagerkvist, C.J. Urban Sprawl and Adverse Impacts on Agricultural Land: A Case Study on Hyderabad, India.Remote Sens.2017,9, 1136. [CrossRef]
25. Nguyen, H.L.; Duan, J.; Zhang, G.Q. Land Politics under Market Socialism: The State, Land Policies, and Rural–Urban Land Conversion in China and Vietnam.Land2018,7, 51. [CrossRef]
26. Couch, C.; Leontidou, L.; Petschel-Held, G. (Eds.)Urban Sprawl in Europe: Landscapes, Land-Use Change and Policy; Blackwell Publishing: Oxford, UK, 2007.
27. Patacchini, E.; Zenou, Y. Urban sprawl in Europe.Brook. Whart. Pap. Urban Aff.2009,10, 125–149.
28. Arribas-Bel, D.; Nijkamp, P.; Schoelten, H. Multidimensional urban sprawl in Europe: A self-organizing map approach.Comput. Environ. Urban Syst. 2011,35, 265–275. Available online:https://spinlab.vu.nl/wp- content/uploads/2016/09/ERSA2010finalpaper485.pdf(accessed on 16 August 2019). [CrossRef]
29. Christiansen, P.; Loftsgarden, L.Drivers behind urban sprawl in Europe; Institute of Transport Economics Report, Norwegian Centre for Transport Research: Oslo, Norway, 2011. Available online:https://www.toi.
no/getfile.php/1317329/Publikasjoner/T%C3%98I%20rapporter/2011/1136-2011/1136-2011-el.pdf(accessed on 1 October 2019).
30. Guastella, G.; Oueslati, W.; Pareglio, S. Patterns of Urban Spatial Expansion in European Cities.Sustainability 2019,11, 2247. [CrossRef]
31. Marsden, T.K.; Munton, R.J.C.; Whatmore, S.J.; Little, J.K. Towards a political economy of capitalist agriculture:
A British perspective.Int. J. Urban Reg. Res.1986,10, 498–521. [CrossRef]
32. Lowe, P.; Murdoch, J.; Marsden, T.; Munton, R.; Flynn, A. Regulating the new rural spaces: The uneven development of land.J. Rural Stud.1993,9, 205–222. [CrossRef]
33. Freshwater, D. Maintaining Farmland: A New Focus for Agricultural Policy. In Multifunctionality in Agriculture, Evaluating the Degree of Jointness, Policy Implications; OECD Publishing: Paris, France, 2008;
pp. 47–64. [CrossRef]
34. Allen, A. Environmental planning and management of the peri-urban interface: Perspectives on an emerging field.Environ. Urban.2003,15, 135–147. [CrossRef]
35. Seto, K.C.; Sánchez-Rodríguez, R.; Fragkias, M. The new geography of contemporary urbanization and the environment.Annu. Rev. Environ. Resour.2010,35, 167–194. [CrossRef]
36. Rauws, W.S.; de Roo, G. Exploring transitions in the peri-urban area.Plan. Theory Pract.2011,12, 269–284.
[CrossRef]
37. Caruso, G.; Cavailhès, J.; Peeters, D.; Rounsevell, M.; Thomas, I. Peri-Urbanisation: The Situation in Europe. A Bibliographical Note and Survey of Studies in the Netherlands, Belgium, Great Britain, Germany, Italy and the Nordic Countries; Report prepared for DATAR, Ministère de l’Aménagement du Territoire et de l’Environnement, France; Département d’Economie et Sociologie Rurale Institut National de Recherche Agronomique (INRA): Dijon, France, 2001. Available online:https://orbilu.uni.lu/bitstream/10993/10153/1/
Caruso_PeriUrbanEuropeDATAR.pdf(accessed on 14 September 2019).
38. Hatna, E.; Bakker, M.M. Abandonment and Expansion of Arable Land in Europe. Ecosystems2011, 14, 720–731. [CrossRef]
39. Piorr, A.; Ravetz, J.; Tosics, I.Peri-Urbanisation in Europe: Towards European Policies to Sustain Urban Rural Futures;
A Synthesis Report; Academic Books: Frederiksberg, Denmark, 2011. Available online:http://www.openspace.
eca.ed.ac.uk/wp-content/uploads/2015/12/Peri_Urbanisation_in_Europe_printversion.pdf (accessed on 24 September 2019).

![adistincttypeofenergyproductionsystem,nowadaysmainlyrenewableenergy.Similartoother energysourcescanbefoundinmanycountries,fromtheUSAtoChinaandacrossEurope[ – ]. energylandscape;Eurasianskylark;landcover;landuse;land-coverheterogeneity; withtheareaoftheinl](data:image/gif;base64,R0lGODlhAQABAIAAAP///wAAACH5BAEAAAAALAAAAAABAAEAAAICRAEAOw==)