INTEREST RATE SENSITIVITY OF SPANISH COMPANIES.
AN EXTENSION OF THE FAMA-FRENCH FIVE-FACTOR MODEL
Francisco JAREÑO – María de la O GONZÁLEZ – Marta TOLENTINO – Sara RODRÍGUEZ
(Received: 9 November 2017; revision received: 18 February;
accepted: 26 May 2018)
This paper studies the sensitivity of share prices of Spanish companies included in the IBEX-35 to changes in different explanatory variables, such as market returns, interest rates and factors proposed by Fama and French (1993, 2015) between 2000 and 2016. In addition, for robustness, this paper analyses whether the sensitivity of stock returns is different between two periods: pre- crisis and recent fi nancial crisis. The results confi rm that, in general, all the considered factors are relevant. Furthermore, “market return” and “size” factors show greater explanatory power, together with the “value” factor in the crisis period. Regarding the analysis at sector level, “Oil and Energy”,
“Basic Materials, Industry and Construction” and “Financial and Real Estate Services” sectors ap- pear to be highly sensitive to changes in the risk factors included in the asset pricing factor model.
Keywords: stock market, stock returns, Fama and French factors JEL classifi cation indices: G11, G15, O51
Francisco Jareño, (corresponding author). Professor at the Department of Economics and Finance, University of Castilla-La Mancha, Faculty of Economic and Business Sciences, Albacete, Spain.
E-mail: Francisco.Jareno@uclm.es
María de la O González, Professor at the Department of Economics and Finance, University of Castilla-La Mancha, Faculty of Economic and Business Sciences, Albacete, Spain
E-mail: Mariao.Gonzalez@uclm.es
Marta Tolentino, Professor at the Department of Economics and Finance, University of Castilla-La Mancha, School of Law and Social Sciences, Ciudad Real, Spain.
E-mail: Marta.Tolentino@uclm.es
Sara Rodríguez, Master in Actuarial and Financial Sciences, University of Alcalá, Faculty of Eco- nomic and Business Sciences and Tourism, Madrid, Spain. E-mail: saris_mad@hotmail.com
1. INTRODUCTION AND LITERATURE REVIEW
The aim of this paper is to analyse the sensitivity of Spanish stock business re- turns listed in the Spanish index IBEX-35 to changes in some explanatory factors, such as Spanish stock market returns, short and long term interest rates, the “size”
factor (Small Minus Big, SMB), the “value” factor (High Minus Low, HML), the
“profitability” factor (Robust Minus Weak, RMW), and the “investment” factor (Conservative Minus Aggressive, CMA), the latter proposed by Fama and French (1993, 2015).
Furthermore, to check the consistency of the results properly, we propose two robustness tests. The first test estimates the extended Fama-French five-factor model (2015, FF5 for short) by splitting the general sample period (January 2000 – April 2016) into sub-periods: pre-crisis (2000–2008) and the financial crisis (2008–2016) periods. The second robustness test estimates this model by using the short-term (instead of long-term) interest rate as nominal interest rate.
A large number of studies have analysed the sensitivity of stock returns to changes in interest rates. Although the bulk of the researches focused on the fi- nancial sector, there are also authors who studied the impact on non-financial institutions (Bartram 2002). In addition, it is important to note that fluctuations in interest rates have a relevant power in explaining the variability of financial stock returns (Jianzhou 2007). Regarding the Spanish stock market, some examples are Jareño (2008); Ferrer et al. (2005) and Ferrando et al. (2017), among others.
With respect to non-financial sectors, Bartram (2002) and Jareño (2008) showed a negative and statistically significant relationship between nominal in- terest rates and stock returns. This is related to the flow-through capability of companies, because according to Jareño – Navarro (2010), the sensitivity of stock returns to changes in interest rates may be lower in the case of companies that have a greater ability to transfer inflationary changes to prices.
Changes in interest rates do not affect all sectors in a homogeneous way. The divergence may be due to different factors, such as the level of liquidity, the com- position of the asset, the level of leverage, the business structure and the flow- through capability (Jareño 2008; Jareño – Navarro 2010).
The factor asset pricing models can be classified into two branches: firstly, the Stone (1974) two-factor model, in which market return and interest rate are the main explanatory variables of changes in stock returns (Jareño et al. 2016), and secondly, the Fama–French model (1993, 2015), which proposes the three- and five-factor models, where the expected returns are related to risk factors, such as the stock market return minus the risk-free interest rate, and additional factors related to the “size”, “value”, “profitability” and “investment”. In concrete, FF5
expanded the three-factor model by incorporating two additional factors: “profit- ability” (RMW) and “investment” (CMA).
This innovative asset pricing factor model is applied in recent researches about investment allocation strategies (Angelidis – Tessaromatis 2017), the analysis of US service sector (Yang et al. 2017), and testing the five-factor model for differ- ent stock markets (Harshita et al. 2015; Chia et al. 2016; Guo et al. 2017; Fama – French 2017, among others). It should be noted that there is a shortage of papers analysing the impact of the factors proposed by FF5 on the Spanish stock market, especially at company level. Specifically, the analysis of the Spanish market is only residually collected in an original work by Fama – French (2017), as well as in He et al. (2015) and Huynh (2017), as the Spanish stock market is integrated into a European portfolio. Nevertheless, there would not be any particular study only focused on the Spanish stock market.
The most relevant contributions of this research are the following ones: First, to the best of our knowledge, it is the first study that analyses the sensitivity of the Spanish stock market at company level in the framework of FF5 during the period of 2000 –2016. Second, to check the robustness of the results, the full sam- ple period has been divided into two sub-periods: pre-crisis and global financial crisis periods. In this way, depending on the economic cycle, the sensitivity of certain Spanish stock returns to changes in risk factors may vary. Moreover, to do a second robustness test of our results, this paper proposes two variations of the augmented FF5, using alternatively short- and long-term interest rates.
The rest of the paper is presented in the following way: Section 2 includes discussions on data and methodology. Section 3 shows the empirical results of the augmented Fama–French five-factor asset pricing model. Section 4 includes some robustness checks to confirm the reliability of the results. Finally, Section 5 comprises the main conclusions.
2. DATA AND METHODOLOGY
2.1. Data and sample period
The sample period chosen for the analysis is between January 2000 and April 2016, which consists of a pre-crisis sub-sample (from January 2000 to August 2008) and the financial crisis sub-sample (from September 2008 to April 2016)1 periods. The reason for this separation is that we can assume that the effect of
1 Although the sample period spans from January 2000 to April 2016, some companies were not on the stock exchange for the whole period.
different factors may depend on the economic cycle (Jareño et al. 2016; Ferrando et al. 2017, among others).
Regarding the data frequency, it considers a monthly average of each busi- ness return (196 observations total). This study includes the returns of IBEX-35 companies as a dependent variable and the stock market return, long term inter- est rates,2 and the factors proposed by Fama and French, such as “size” factor (SMB), “value” factor (HML), “profitability” factor (RMW), and “investment”
factor (CMA), as independent or explanatory variables. In actual, this paper uses the original FF5. According to Angelidis – Tessaromatis (2017), among others, FF5 have broad support and acceptance in the academic community and are the basis for country and global smart beta portfolio strategies used by both insti- tutional and retail investors. Furthermore, while the previous literature usually studies the effect of national variables on the national stock market, Sevillano – Jareño (2018) study to what extent the genuine European Fama–French factors impact the Spanish stock market at company level. Therefore, to some extent, this paper finally studies whether there is an interconnection between international stock markets.
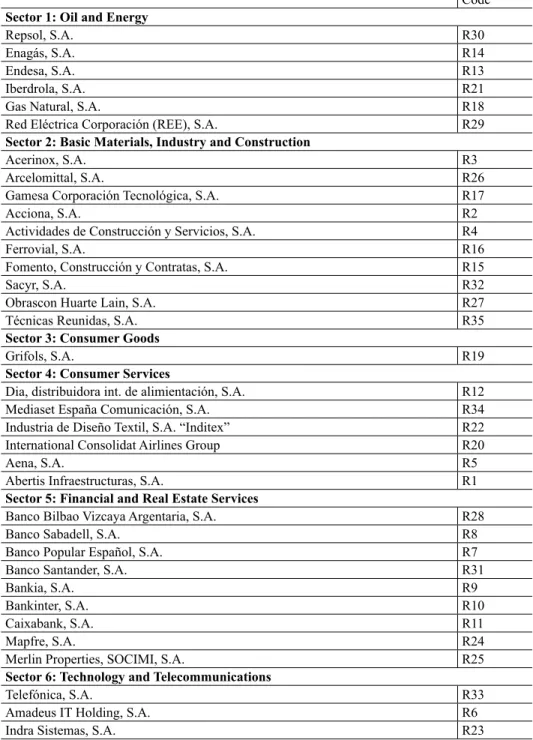
Table 1 shows the companies analysed according to the sectors. We used the composition of the IBEX-35 on April 3, 2016, to study the temporal evolution of these companies based on different factors. Thus, the static analysis of the com- panies included in the Spanish IBEX-35 index (at that particular point in time) may imply lack of data for certain companies in specific sub-periods, due to the possible entry and exit of some selected companies during the sample period.3
The Spanish stock business and stock market returns (the Spanish IBEX-35 index) are extracted from the website of Invertia. Then the logarithmic returns are obtained.4 Regarding the main descriptive statistics of companies’ returns listed in the IBEX-35, there are relevant differences between the companies.5 AENA is the company with the highest mean return followed by other companies, such as Amadeus, Grifols, IAG, Inditex and Red Eléctrica Corporación. On the other hand, Bankia is the company with a lower mean return along the sample, ac- compained with Arcelomittal, CaixaBank and Sacyr. With regard to the median, AENA, International Consolidat Airlines Group, Grifols, Enagas and Inditex are the companies with the highest median return, whereas CaixaBank and Bankia have a much lower median than the rest. Bankia has the highest risk, jointly with
2 Short-term interest rates are used for robustness.
3 Some previous studies, such as Sevillano – Jareño (2018), take similar decisions.
4 Closing prices are adjusted by dividends and splits.
5 The descriptive statistics and unit root tests are available upon request.
Table 1. Companies and sectors analysed
Code Sector 1: Oil and Energy
Repsol, S.A. R30
Enagás, S.A. R14
Endesa, S.A. R13
Iberdrola, S.A. R21
Gas Natural, S.A. R18
Red Eléctrica Corporación (REE), S.A. R29
Sector 2: Basic Materials, Industry and Construction
Acerinox, S.A. R3
Arcelomittal, S.A. R26
Gamesa Corporación Tecnológica, S.A. R17
Acciona, S.A. R2
Actividades de Construcción y Servicios, S.A. R4
Ferrovial, S.A. R16
Fomento, Construcción y Contratas, S.A. R15
Sacyr, S.A. R32
Obrascon Huarte Lain, S.A. R27
Técnicas Reunidas, S.A. R35
Sector 3: Consumer Goods
Grifols, S.A. R19
Sector 4: Consumer Services
Dia, distribuidora int. de alimientación, S.A. R12
Mediaset España Comunicación, S.A. R34
Industria de Diseño Textil, S.A. “Inditex” R22
International Consolidat Airlines Group R20
Aena, S.A. R5
Abertis Infraestructuras, S.A. R1
Sector 5: Financial and Real Estate Services
Banco Bilbao Vizcaya Argentaria, S.A. R28
Banco Sabadell, S.A. R8
Banco Popular Español, S.A. R7
Banco Santander, S.A. R31
Bankia, S.A. R9
Bankinter, S.A. R10
Caixabank, S.A. R11
Mapfre, S.A. R24
Merlin Properties, SOCIMI, S.A. R25
Sector 6: Technology and Telecommunications
Telefónica, S.A. R33
Amadeus IT Holding, S.A. R6
Indra Sistemas, S.A. R23
Source: Own preparation based on the Bolsas y Mercados Españoles (BME) website.
Arcelomittal and Sacyr. Furthermore, nearly all the companies present negative asymmetry and there is not a considerable excess of kurtosis.
As regards the explanatory variables, data concerning market returns have been extracted from the Bolsa de Madrid website, through the returns of the IBEX-35 Spanish market index. In the case of stock business returns, the logarithmic re- turns were calculated. Continuing with the bulk of the previous literature, the impact of the interest rate has been analysed.6 More specifically, 10-year (long- term, IR) and 3-month (short-term, RF) nominal interest rates corresponding to the public debt provided by the official Banco de España website are used in the paper.7
According to Ferrer et al. (2010) and Akhtaruzzaman et al. (2014), stock busi- ness returns may be more sensitive to changes in long-term interest rates than short-term rates. Long-term interest rates incorporate market expectations about the economic cycle, long-term government bonds can be considered as closer maturity substitutes to stocks, and long term rates are more stable. Therefore, the extended FF5 model is estimated by using long-term interest rates, in particular, 10-year nominal interest rates. Besides, for robustness, the model is also esti- mated including 3-month interest rates.
The rest of the explanatory variables are extracted from the Kenneth R. French website,8 such as SMB, HML, RMW, and CMA.
The main descriptive statistics of the explanatory variables show a positive mean for all variables, except the stock market return. The HML is the most im- portant factor, whereas the market return shows a much lower value than the rest.
In addition, most variables have a median very close to their mean value. With regard to the standard deviation, the Fama and French explanatory factors show more dispersion than the rest of the variables included in the analysis. Finally, half of the values are scattered to the right of the distribution and half of the val- ues are distributed to the left.
Three tests are implemented to study the stationarity of the time series: two unit root tests, such as Augmented Dickey-Fuller (ADF) and Phillips-Perron (P-P) and one stationarity test that is Kwiatkowski-Phillips-Schmidt-Shin (KPSS).9 Almost all the variables included in the analysis are stationary that is the mean and the median remain constant during the sample period. Only the explanatory
6 After studying the effect of 1-year and 10-year nominal interest rates, the results showed greater effect of the second, which is supported by the inclusion of this variable in most of the works analysed in the literature review (Ferrando et al. 2015).
7 https://www.bde.es/bde/es/areas/mercadeuda/
8 http://mba.tuck.dartmouth.edu/pages/faculty/ken.french/data_library.html
9 These results are available upon request.
variables, such as short and long-term interest rates, CMA and HML, which had a unit root, have to be transformed into first differences.
Finally, to avoid collinearity between explanatory factors, the correlation ma- trix was studied.10 There is a statistically significant correlation between stock market returns and SMB. The rest of the correlations are not statistically sig- nificant. So it is not necessary to orthogonalize risk factors included in the aug- mented FF5 model. Moreover, it is usually advised to avoid the orthogonalization process to keep the genuine risk factors.
2.2. Methodology
We propose an extension of FF5 that explains the companies’ returns according to the following explanatory variables: market returns, nominal interest rates,
“size” factor – SMB, “value” factor – HML, “profitability” factor – RMW, and
“investment” factor – CMA. Thus, the extended FF5 model that includes long- term interest rates is represented as follows:
· · · ·
jt j j t j t f t f t f t f t jt
R α β MR μ ΔIR γ SMB τ ΔHML φ RMV δ ΔCMA ε (1) where Rjt is the monthly return of company j, αj is the independent term, βj shows the market sensitivity of company j listed in the Spanish index IBEX-35, MRt is the monthly market return, μj shows the sensitivity of company j to un- expected changes in long-term nominal interest rates, ΔΙRt is the non-expected change in the long-term nominal interest rate, γf shows the sensitivity of company j to changes in the “size” factor, SΜΒt shows the monthly “size” factor return, τf shows the sensitivity of company j to changes in the “value” factor, HMLt is the monthly “value” factor return, φf shows the sensitivity of company j to changes in the “profitability” factor, RMVt shows the monthly “profitability” factor re- turn, δf shows the sensitivity of company j to changes in the “investment” factor, CMAt shows the monthly “investment” factor return and, finally, ɛjt is a random disturbance .
The estimation of the extended FF5 has been done through a system of thirty- five equations (as many as dependent variables are included in the analysis) fol- lowing the methodology of the Seemingly Unrelated Regression (SUR) models.
Several authors used this methodology because it allows to avoid the distortions in the estimates due to the presence of heteroscedasticity and simultaneous cor- relation between the error terms (e.g. Jareño 2008).
10 This matrix is also available upon request.
3. MAIN RESULTS
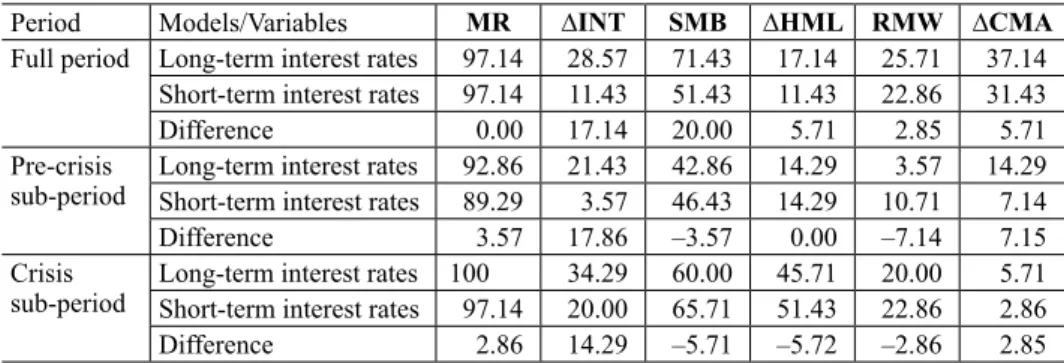
The empirical analysis (Sections 3 and 4) is multipurpose. First, it carries out a study considering the whole sample period (Jan 2000 – Apr 2016) and the long- term interest rates as additional explanatory factor. Then, for robustness, estima- tions are also carried out for two sub-periods: pre-crisis (Jan 2000 – Aug 2008) and recent financial crisis (Sept 2008 – Apr 2016) sub-periods.11 Moreover, this paper also estimates the proposed model with the short-term interest rates instead of the long-term ones. This allows us to corroborate the consistency of the results obtained.
3.1. Estimates of the extended Fama and French fi ve-factor model (2015)
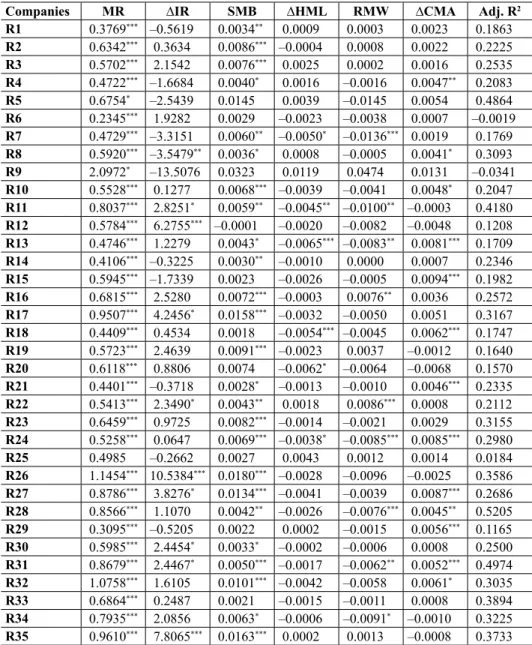
The results of the extended FF5 model for the full period and using long-term interest rates are shown in Table 2. It allows to study the relationships between the IBEX-35 companies’ returns and the explanatory risk factors.
All the companies, except for R25 (Merlin Properties), have a positive and statistically significant sensitivity to changes in the stock market returns, so a change in this risk factor would imply a change in the same direction in these companies’ returns. The value of the coefficients is less than one in all cases, except for R9 (Bankia), R26 (Mittal Steel Company) and R32 (Sacyr), so if the stock market return is positive, these companies would outperform the market, and vice versa. Furthermore, the companies, R11 (Caixabank), R17 (Gamesa), R27 (OHL), R28 (BBVA), R31 (Banco Santander), R34 (Mediaset España) and R35 (Técnicas Reunidas) present coefficients close to one, so their behaviour is close to the Spanish stock market.
The sensitivity of the returns to changes in the long-term interest rate is statisti- cally significant for about 29% of the companies: R8 (Banco Sabadell), R11 (Caixa Bank), R12 (Día), R17 (Gamesa Corporación Tecnológica), R22 (Inditex ), R26 (Mittal Steel Company), R27 (OHL), R30 (Repsol), R31 (Banco Santander) and R35 (Técnicas Reunidas). All companies have positive sign (future expec- tations) except for Banco Sabadell. Moreover, Día, Mittal Steel Company and Técnicas Reunidas are most sensitive to the changes in long-term interest rates.
The “size” (SMB) factor is statistically significant for almost 72% of the companies analysed. In addition, it is positive in all cases, that is, the larger the company size, the greater its returns. For the companies, such as Gamesa, Arce-
11 We have split the whole sample into two sub-samples considering the fall of Lehman Brothers Holdings.
Table 2. Estimates for the whole sample and long-term interest rates
Companies MR ∆IR SMB ∆HML RMW ∆CMA Adj. R2
R1 0.3769*** –0.5619 0.0034** 0.0009 0.0003 0.0023 0.1863 R2 0.6342*** 0.3634 0.0086*** –0.0004 0.0008 0.0022 0.2225 R3 0.5702*** 2.1542 0.0076*** 0.0025 0.0002 0.0016 0.2535 R4 0.4722*** –1.6684 0.0040* 0.0016 –0.0016 0.0047** 0.2083
R5 0.6754* –2.5439 0.0145 0.0039 –0.0145 0.0054 0.4864
R6 0.2345*** 1.9282 0.0029 –0.0023 –0.0038 0.0007 –0.0019 R7 0.4729*** –3.3151 0.0060** –0.0050* –0.0136*** 0.0019 0.1769 R8 0.5920*** –3.5479** 0.0036* 0.0008 –0.0005 0.0041* 0.3093
R9 2.0972* –13.5076 0.0323 0.0119 0.0474 0.0131 –0.0341
R10 0.5528*** 0.1277 0.0068*** –0.0039 –0.0041 0.0048* 0.2047 R11 0.8037*** 2.8251* 0.0059** –0.0045** –0.0100** –0.0003 0.4180 R12 0.5784*** 6.2755*** –0.0001 –0.0020 –0.0082 –0.0048 0.1208 R13 0.4746*** 1.2279 0.0043* –0.0065*** –0.0083** 0.0081*** 0.1709 R14 0.4106*** –0.3225 0.0030** –0.0010 0.0000 0.0007 0.2346 R15 0.5945*** –1.7339 0.0023 –0.0026 –0.0005 0.0094*** 0.1982 R16 0.6815*** 2.5280 0.0072*** –0.0003 0.0076** 0.0036 0.2572 R17 0.9507*** 4.2456* 0.0158*** –0.0032 –0.0050 0.0051 0.3167 R18 0.4409*** 0.4534 0.0018 –0.0054*** –0.0045 0.0062*** 0.1747 R19 0.5723*** 2.4639 0.0091*** –0.0023 0.0037 –0.0012 0.1640 R20 0.6118*** 0.8806 0.0074 –0.0062* –0.0064 –0.0068 0.1570 R21 0.4401*** –0.3718 0.0028* –0.0013 –0.0010 0.0046*** 0.2335 R22 0.5413*** 2.3490* 0.0043** 0.0018 0.0086*** 0.0008 0.2112 R23 0.6459*** 0.9725 0.0082*** –0.0014 –0.0021 0.0029 0.3155 R24 0.5258*** 0.0647 0.0069*** –0.0038* –0.0085*** 0.0085*** 0.2980
R25 0.4985 –0.2662 0.0027 0.0043 0.0012 0.0014 0.0184
R26 1.1454*** 10.5384*** 0.0180*** –0.0028 –0.0096 –0.0025 0.3586 R27 0.8786*** 3.8276* 0.0134*** –0.0041 –0.0039 0.0087*** 0.2686 R28 0.8566*** 1.1070 0.0042** –0.0026 –0.0076*** 0.0045** 0.5205 R29 0.3095*** –0.5205 0.0022 0.0002 –0.0015 0.0056*** 0.1165 R30 0.5985*** 2.4454* 0.0033* –0.0002 –0.0006 0.0008 0.2500 R31 0.8679*** 2.4467* 0.0050*** –0.0017 –0.0062** 0.0052*** 0.4974 R32 1.0758*** 1.6105 0.0101*** –0.0042 –0.0058 0.0061* 0.3035 R33 0.6864*** 0.2487 0.0021 –0.0015 –0.0011 0.0008 0.3894 R34 0.7935*** 2.0856 0.0063* –0.0006 –0.0091* –0.0010 0.3225 R35 0.9610*** 7.8065*** 0.0163*** 0.0002 0.0013 –0.0008 0.3733 Notes: MR: Spanish stock market return, IR: (long-term) interest rate, SMB: size factor, HML: value factor, RMW: profitability factor, CMA: investment factor.
* p < 0.10, ** p < 0.05, *** p < 0.01
Source: Own preparation from Eviews results.
lomittal, OHL, Sacyr and Técnicas Reunidas, the coefficients are higher and, therefore, these companies are more sensitive to changes in the SMB variable. In contrast, the less sensitive companies are Abertis, Banco Sabadell and Iberdrola.
This variable is not statistically significant for R5 (Aena), R6 (Amadeus), R9 (Bankia), R12 (Dia), R18 (Gas Natural Fenosa), R20 (International Consolidat Airlines Group), R25 (Merlin Properties), R29 (Red Eléctrica Corporación) and R33 (Telefónica).
The “value” (HML) factor has a statistically significant effect on R7 (Ban- co Popular), R11 (Caixa Bank), R13 (Endesa), R18 (Gas Natural Fenosa), R20 (International Consolidat Airlines Group) and R24 (Mapfre). In addition, it has negative sign, which means that the companies may obtain lower returns when their growth opportunities are greater.
The “profitability” (RMW) factor is statistically significant for about 26% of the companies, such as R7 (Banco Popular), R11 (Caixabank), R13 (Endesa), R16 (Ferrovial), R22 (Inditex), R24 (Mapfre), R28 (BBVA), R31 (Banco Santander) and R34 (Mediaset España). In addition, this sensitivity is negative for all of them, except for Ferrovial and Inditex, which is positive, although with a very small associated coefficient.
The “investment” (CMA) explanatory factor is statistically significant and shows a positive sign for about 37% of the companies: R4 (Actividades de Con- strucción y Servicios), R8 (Banco Sabadell), R10 (Bankinter), R13 (Endesa), R15 (Fomento, Construcción y Contratas), R18 (Gas Natural Fenosa), R21 (Iberdrola), R24 (Mapfre), R27 (Obrascon Huarte Lain), R28 (BBVA), R29 (Red Eléctrica Corporación), R31 (Banco Santander) and R32 (Sacyr). Therefore, the return of these companies would be greater when having the greater CMA factor. The most sensitive companies are Endesa, Fomento, Construcción y Contratas, Mapfre and OHL. On the contrary, those that are less sensitive are Actividades de Construc- ción y Servicios, Banco Sabadell, Bankinter, Iberdrola and BBVA. In this proof, the explanatory power is quite different between companies. The adjusted R2 is about 25% on average and almost 50% for R5 (Aena).
3.2. Analysis at sector level
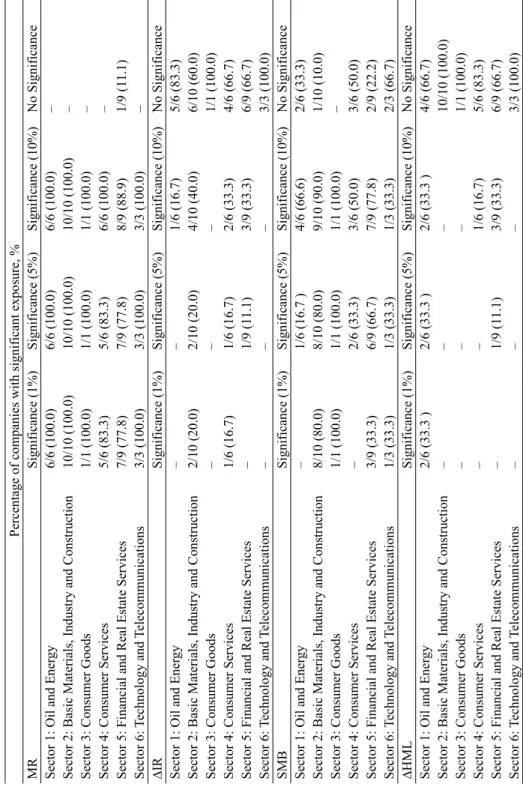
Table 3 shows the results at sector level to remark possible and relevant differ- ences among them.
First, the weight of each sector in proportion to the number of companies is the following: more than 28% (10/35) for sector 2, about 26% (9/35) for sector 5, slightly more than 17% (5/35) for sectors 1 and 4 , about 9% (3/35) for sector 6, and finally, about 3% (1/35) for sector 3.
Table 3.Sensitivity of the companies listed in the Spanish IBEX-35 index Percentage of companies with significant exposure, % MRSignificance (1%)Significance (5%)Significance (10%)No Significance Sector 1: Oil and Energy6/6 (100.0)6/6 (100.0)6/6 (100.0)– Sector 2: Basic Materials, Industry and Construction10/10 (100.0)10/10 (100.0)10/10 (100.0)– Sector 3: Consumer Goods1/1 (100.0)1/1 (100.0)1/1 (100.0)– Sector 4: Consumer Services5/6 (83.3)5/6 (83.3)6/6 (100.0)– Sector 5: Financial and Real Estate Services7/9 (77.8)7/9 (77.8)8/9 (88.9)1/9 (11.1) Sector 6: Technology and Telecommunications3/3 (100.0)3/3 (100.0)3/3 (100.0)– ∆IRSignificance (1%)Significance (5%)Significance (10%)No Significance Sector 1: Oil and Energy––1/6 (16.7)5/6 (83.3) Sector 2: Basic Materials, Industry and Construction2/10 (20.0)2/10 (20.0)4/10 (40.0)6/10 (60.0) Sector 3: Consumer Goods–––1/1 (100.0) Sector 4: Consumer Services1/6 (16.7)1/6 (16.7)2/6 (33.3)4/6 (66.7) Sector 5: Financial and Real Estate Services–1/9 (11.1)3/9 (33.3)6/9 (66.7) Sector 6: Technology and Telecommunications–––3/3 (100.0) SMBSignificance (1%)Significance (5%)Significance (10%)No Significance Sector 1: Oil and Energy–1/6 (16.7 )4/6 (66.6)2/6 (33.3) Sector 2: Basic Materials, Industry and Construction8/10 (80.0)8/10 (80.0)9/10 (90.0)1/10 (10.0) Sector 3: Consumer Goods1/1 (100.0)1/1 (100.0)1/1 (100.0)– Sector 4: Consumer Services–2/6 (33.3)3/6 (50.0)3/6 (50.0) Sector 5: Financial and Real Estate Services3/9 (33.3)6/9 (66.7)7/9 (77.8)2/9 (22.2) Sector 6: Technology and Telecommunications1/3 (33.3)1/3 (33.3)1/3 (33.3)2/3 (66.7) ∆HMLSignificance (1%)Significance (5%)Significance (10%)No Significance Sector 1: Oil and Energy2/6 (33.3 )2/6 (33.3 )2/6 (33.3 )4/6 (66.7) Sector 2: Basic Materials, Industry and Construction–––10/10 (100.0) Sector 3: Consumer Goods–––1/1 (100.0) Sector 4: Consumer Services––1/6 (16.7)5/6 (83.3) Sector 5: Financial and Real Estate Services–1/9 (11.1)3/9 (33.3)6/9 (66.7) Sector 6: Technology and Telecommunications–––3/3 (100.0)
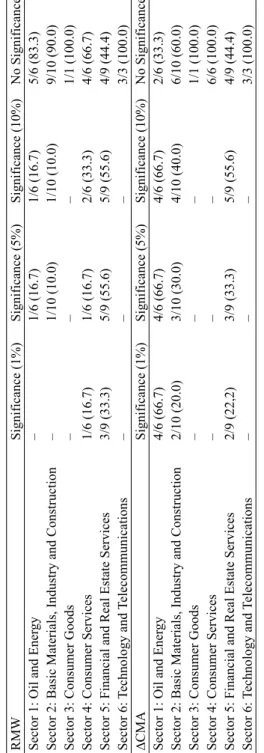
Table 3 continued RMWSignificance (1%)Significance (5%)Significance (10%)No Significance Sector 1: Oil and Energy–1/6 (16.7)1/6 (16.7)5/6 (83.3) Sector 2: Basic Materials, Industry and Construction–1/10 (10.0)1/10 (10.0)9/10 (90.0) Sector 3: Consumer Goods–––1/1 (100.0) Sector 4: Consumer Services1/6 (16.7)1/6 (16.7)2/6 (33.3)4/6 (66.7) Sector 5: Financial and Real Estate Services3/9 (33.3)5/9 (55.6)5/9 (55.6)4/9 (44.4) Sector 6: Technology and Telecommunications–––3/3 (100.0) ∆CMASignificance (1%)Significance (5%)Significance (10%)No Significance Sector 1: Oil and Energy4/6 (66.7)4/6 (66.7)4/6 (66.7)2/6 (33.3) Sector 2: Basic Materials, Industry and Construction2/10 (20.0)3/10 (30.0)4/10 (40.0)6/10 (60.0) Sector 3: Consumer Goods–––1/1 (100.0) Sector 4: Consumer Services–––6/6 (100.0) Sector 5: Financial and Real Estate Services2/9 (22,2)3/9 (33.3)5/9 (55.6)4/9 (44.4) Sector 6: Technology and Telecommunications–––3/3 (100.0) Notes:MR: Spanish stock market return, IR: (long-term) interest rate, SMB: size factor, HML: value factor, RMW: profitability factor, CMA: investment factor. Source: Own preparation from Eviews results.
With regard to market returns, all except one of the sectors show a hundred per cent of companies with statistically significant sensitivity, so, stock business returns are mainly affected by the variations in market returns. The exception is sector 5 that exhibits 89% of companies with statistically significant sensitivity at 10% level.
As far as changes in interest rates are concerned, sector 2 shows the greatest sensitivity to changes in this risk factor proposed in this research (40% of com- panies). Furthermore, sectors 4 and 5 reach 33.3% of companies with statistically significant sensitivity to changes in long-term interest rates.
Most companies of all sectors present statistically significant sensitivity to variations in the “size” factor (SMB). Specifically, 100%, 90% and 78% of com- panies of the sectors 3, 2 and 5, respectively, are highly sensitive to changes in SMB. As regards the “value” factor (HML), it primarily shows statistically sig- nificant impact on sectors 1 and 5 (33.3% of companies).
The “profitability” factor (RMW) exhibits a greater impact than the “value”
factor. Sector 5 shows that about 56% of companies are with statistically signifi- cant sensitivity to changes in this risk factor. Besides, sector 4 contains 33% of companies sensitive to RMW.
The most sensitive sector to changes in the “investment” factor (CMA) is sector 1 with 66.7% of companies showing statistically significant sensitivity to changes in this risk factor, followed by sector 5 with a 55.6% of companies and, in third position, sector 2 with 40% of companies sensitive to the investment factor.
Finally, the mean explanatory power at sector level is between 17% and 28%.
Moreover, sectors 2 and 5 exhibit the highest adjusted R2 values.
4. ROBUSTNESS CHECKS
This section includes two tests to check the robustness of the findings of the previously estimated augmented FF5 (Equation 1). First, the FF5 model has been estimated splitting the whole sample into two different sub-periods: pre crisis sub-period and crisis sub-period. Second, the sensitivity of stock business returns to changes in short-term interest rates (proxied by 3-month treasury bill rates) has been estimated. The inclusion of this variable instead of long-term interest rates (10-year government bond yields) in the extended Fama–French specification al- lows for contrasting the reliability of the results.
4.1. Sub-sample analysis
For robustness, this section studies the effect that the economic crisis may have on the relationship between the individual stock returns of the companies listed in the IBEX-35 index and the explanatory variables included in the extension of FF5 model proposed in this research. For that end, this study breaks the whole sam- ple into two different sub-periods: pre crisis sub-period (January 2000 – August 2008) and recent financial crisis sub-period (September 2008 – April 2016). The division into these two consecutive sub-periods is determined by the beginning of the crisis with the fall of Lehman Brothers in September 2008 (Ferrando et al.
2017). So, recent economic events have been taken into account in this analysis 4.1.1. Pre-crisis sub-period: Janurary 2000 – August 2008
This sub-section performs an analysis of the IBEX-35 companies’ returns for the first sub-sample, the pre-crisis sub-period. It should be noted that for some companies the analysis could not be carried out since there were no quotations data for these dates or they were not enough to obtain reliable estimates. These companies are Aena, Amadeus, IT Holding, Caixabank, Día, IAG and Merlin.12
Table 4 shows the estimates of the factor model proposed in this research in- cluding long-term interest rates for this sub-period.
All companies present a statistically significant and positive sensitivity to changes in the stock market return, except for R1 (Abertis) and R7 (Banco Popu- lar). Thus, these results practically coincide with the ones of the full period since the companies that do not offer statistical significance are the same. In this case there is no coefficient greater than one, but five companies with the coefficient value closest to one, such as R17 (Gamesa), R19 (Grifols), R23 (Indra), R33 (Tel- efónica) and R35 (Técnicas Reunidas), present a behaviour quite similar to the market. In contrast, the companies with a lowest sensitivity are R2 (Acciona), R3 (Acerinox), R4 (Actividades de Construcción y Servicios, ACS), R21 (Iberdrola) and R29 (REE).
With regard to the long-term interest rate, 21.4% of the companies show sta- tistically significant sensitivity. Specifically, the companies that present a statisti- cally significant and positive sensitivity are R2 (Acciona), R8 (Banco Sabadell),
12 As previously explained, Table 4 does not show results for some specific companies, such as RS5, RS6, RS9, RS11, RS12, RS20 and RS25. The static analysis of the companies included in the Spanish IBEX-35 index (April 3, 2016) indeed implies lack of data for these companies during the pre-crisis sub-period, due to their later entry in the composition of the Spanish stock market index.
R10 (Bankinter), R17 (Gamesa) and R31 (Banco Santander). In addition, this sensitivity is very high, since in all the cases the coefficients are much larger than the unit is. The only company that presents negative sensitivity is R18 (Gas Natural Fenosa), so that increases in the long-term interest rate mean decreases in its returns.
For the “size” (SMB) explanatory variable, it is statistically significant for twelve companies (almost 43% of the analysed companies). Specifically, compa- nies that show a positive and statistically significant sensitivity to changes in the
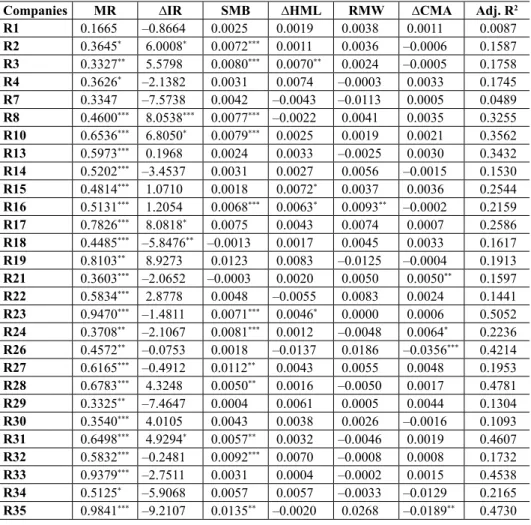
Table 4. Estimates for the pre-crisis sub-sample and long-term interest rates
Companies MR ∆IR SMB ∆HML RMW ∆CMA Adj. R2
R1 0.1665 –0.8664 0.0025 0.0019 0.0038 0.0011 0.0087
R2 0.3645* 6.0008* 0.0072*** 0.0011 0.0036 –0.0006 0.1587 R3 0.3327** 5.5798 0.0080*** 0.0070** 0.0024 –0.0005 0.1758
R4 0.3626* –2.1382 0.0031 0.0074 –0.0003 0.0033 0.1745
R7 0.3347 –7.5738 0.0042 –0.0043 –0.0113 0.0005 0.0489
R8 0.4600*** 8.0538*** 0.0077*** –0.0022 0.0041 0.0035 0.3255 R10 0.6536*** 6.8050* 0.0079*** 0.0025 0.0019 0.0021 0.3562
R13 0.5973*** 0.1968 0.0024 0.0033 –0.0025 0.0030 0.3432
R14 0.5202*** –3.4537 0.0031 0.0027 0.0056 –0.0015 0.1530 R15 0.4814*** 1.0710 0.0018 0.0072* 0.0037 0.0036 0.2544 R16 0.5131*** 1.2054 0.0068*** 0.0063* 0.0093** –0.0002 0.2159 R17 0.7826*** 8.0818* 0.0075 0.0043 0.0074 0.0007 0.2586 R18 0.4485*** –5.8476** –0.0013 0.0017 0.0045 0.0033 0.1617
R19 0.8103** 8.9273 0.0123 0.0083 –0.0125 –0.0004 0.1913
R21 0.3603*** –2.0652 –0.0003 0.0020 0.0050 0.0050** 0.1597
R22 0.5834*** 2.8778 0.0048 –0.0055 0.0083 0.0024 0.1441
R23 0.9470*** –1.4811 0.0071*** 0.0046* 0.0000 0.0006 0.5052 R24 0.3708** –2.1067 0.0081*** 0.0012 –0.0048 0.0064* 0.2236 R26 0.4572** –0.0753 0.0018 –0.0137 0.0186 –0.0356*** 0.4214 R27 0.6165*** –0.4912 0.0112** 0.0043 0.0055 0.0048 0.1953 R28 0.6783*** 4.3248 0.0050** 0.0016 –0.0050 0.0017 0.4781
R29 0.3325** –7.4647 0.0004 0.0061 0.0005 0.0044 0.1304
R30 0.3540*** 4.0105 0.0043 0.0038 0.0026 –0.0016 0.1093
R31 0.6498*** 4.9294* 0.0057** 0.0032 –0.0046 0.0019 0.4607 R32 0.5832*** –0.2481 0.0092*** 0.0070 –0.0008 0.0008 0.1732 R33 0.9379*** –2.7511 0.0031 0.0004 –0.0002 0.0015 0.4538
R34 0.5125* –5.9068 0.0057 0.0057 –0.0033 –0.0129 0.2165
R35 0.9841*** –9.2107 0.0135** –0.0020 0.0268 –0.0189** 0.4730 Notes: MR: Spanish stock market return, IR: (long-term) interest rate, SMB: size factor, HML: value factor, RMW: profitability factor, CMA: investment factor.
* p < 0.10, ** p < 0.05, *** p < 0.01.
Source: Own preparation from Eviews results.
“size” factor are R2 (Acciona), R3 (Acerinox), R8 (Banco Sabadell), R10 (Bank- inter), R16 (Ferrovial), R23 (Indra), R24 (Mapfre), R27 (OHL), R28 (BBVA), R31 (Banco Santander), R32 (Sacyr) and R35 (Técnicas Reunidas). Thus, the larger (smaller) the business size, the higher (lower) is the expected return. In addition, the highest sensitivity is found in OHL and Técnicas Reunidas, and the least sensitivity in BBVA and Banco Santander.
The “value” (HML) explanatory variable is statistically significant and posi- tive for R3 (Acerinox), R15 (FCC), R16 (Ferrovial) and R23 (Indra), and the highest sensitivity corresponds to FCC. So, the higher the business growth, the higher would be the expected return for the companies mentioned.
Regarding the “profitability” (RMV) factor, it is not statistically significant for most companies, and is statistically significant and positive only for R16 (Fer- rovial).
And finally, as regards the “investment” (CMA) explanatory variable, about 14% of the companies show statistically significant sensitivity, such as R21 (Iber- drola), R24 (Mapfre), R26 (Arcelomittal) and R35 (Técnicas Reunidas). This sensitivity is positive for Iberdrola and Mapfre, and negative for Arcelomittal and Técnicas Reunidas.
In this study, the explanatory power of the proposed factor model is quite dif- ferent between companies. The adjusted coefficient R2 shows mean values around 25%, and it is almost 50% for R28 (BBVA), R31 (Banco Santander), R33 (Tele- fónica) and R35 (Técnicas Reunidas) and somewhat higher than 50% for R23 (Indra).
4.1.2. Recent financial crisis sub-period: September 2008 – April 2016
This sub-section includes the analysis for the second sub-sample, the recent fi- nancial crisis sub-period. During this crisis sub-period, the results of our pro- posed model using long-term interest rates are shown in Table 5.
First, all companies present a positive and statistically significant sensitivity to changes in the stock market return. In addition, the companies whose coef- ficients (and sensitivity) are greater than one, which means that they overreact to changes in the market, are R9 (Bankia), R17 (Gamesa), R26 (Arcelomittal), R27 (OHL), R28 (BBVA), R31 (Banco Santander), R32 (Sacyr) and R35 (Téc- nicas Reunidas). The least sensitive company to changes in the market return is R6 (Amadeus), followed by R10 (Bankinter), R14 (Enagas), R20 (International Consolidated Airlines Group) and R33 (Telefónica).
About 34% of the companies present statistically significant sensitivity to changes in long-term interest rates. R11 (Caixabank), R12 (Día), R16 (Ferro- vial), R22 (Inditex), R26 (Mittal steel company), R27 (OHL), R30 (Repsol),
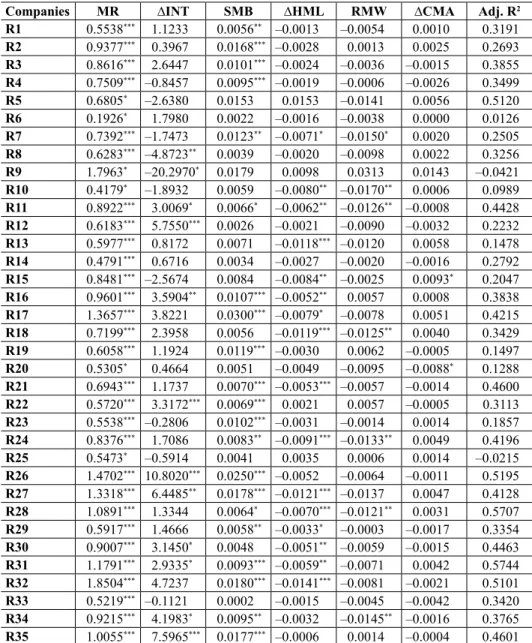
Table 5. Estimates for the crisis sub-sample and long-term interest rates
Companies MR ∆INT SMB ∆HML RMW ∆CMA Adj. R2
R1 0.5538*** 1.1233 0.0056** –0.0013 –0.0054 0.0010 0.3191 R2 0.9377*** 0.3967 0.0168*** –0.0028 0.0013 0.0025 0.2693 R3 0.8616*** 2.6447 0.0101*** –0.0024 –0.0036 –0.0015 0.3855 R4 0.7509*** –0.8457 0.0095*** –0.0019 –0.0006 –0.0026 0.3499
R5 0.6805* –2.6380 0.0153 0.0153 –0.0141 0.0056 0.5120
R6 0.1926* 1.7980 0.0022 –0.0016 –0.0038 0.0000 0.0126
R7 0.7392*** –1.7473 0.0123** –0.0071* –0.0150* 0.0020 0.2505 R8 0.6283*** –4.8723** 0.0039 –0.0020 –0.0098 0.0022 0.3256 R9 1.7963* –20.2970* 0.0179 0.0098 0.0313 0.0143 –0.0421 R10 0.4179* –1.8932 0.0059 –0.0080** –0.0170** 0.0006 0.0989 R11 0.8922*** 3.0069* 0.0066* –0.0062** –0.0126** –0.0008 0.4428 R12 0.6183*** 5.7550*** 0.0026 –0.0021 –0.0090 –0.0032 0.2232 R13 0.5977*** 0.8172 0.0071 –0.0118*** –0.0120 0.0058 0.1478 R14 0.4791*** 0.6716 0.0034 –0.0027 –0.0020 –0.0016 0.2792 R15 0.8481*** –2.5674 0.0084 –0.0084** –0.0025 0.0093* 0.2047 R16 0.9601*** 3.5904** 0.0107*** –0.0052** 0.0057 0.0008 0.3838 R17 1.3657*** 3.8221 0.0300*** –0.0079* –0.0078 0.0051 0.4215 R18 0.7199*** 2.3958 0.0056 –0.0119*** –0.0125** 0.0040 0.3429 R19 0.6058*** 1.1924 0.0119*** –0.0030 0.0062 –0.0005 0.1497 R20 0.5305* 0.4664 0.0051 –0.0049 –0.0095 –0.0088* 0.1288 R21 0.6943*** 1.1737 0.0070*** –0.0053*** –0.0057 –0.0014 0.4600 R22 0.5720*** 3.3172*** 0.0069*** 0.0021 0.0057 –0.0005 0.3113 R23 0.5538*** –0.2806 0.0102*** –0.0031 –0.0014 0.0014 0.1857 R24 0.8376*** 1.7086 0.0083** –0.0091*** –0.0133** 0.0049 0.4196
R25 0.5473* –0.5914 0.0041 0.0035 0.0006 0.0014 –0.0215
R26 1.4702*** 10.8020*** 0.0250*** –0.0052 –0.0064 –0.0011 0.5195 R27 1.3318*** 6.4485** 0.0178*** –0.0121*** –0.0137 0.0047 0.4128 R28 1.0891*** 1.3344 0.0064* –0.0070*** –0.0121** 0.0031 0.5707 R29 0.5917*** 1.4666 0.0058** –0.0033* –0.0003 –0.0017 0.3354 R30 0.9007*** 3.1450* 0.0048 –0.0051** –0.0059 –0.0015 0.4463 R31 1.1791*** 2.9335* 0.0093*** –0.0059** –0.0071 0.0042 0.5744 R32 1.8504*** 4.7237 0.0180*** –0.0141*** –0.0081 –0.0021 0.5101 R33 0.5219*** –0.1121 0.0002 –0.0015 –0.0045 –0.0042 0.3420 R34 0.9215*** 4.1983* 0.0095** –0.0032 –0.0145** –0.0016 0.3765 R35 1.0055*** 7.5965*** 0.0177*** –0.0006 0.0014 –0.0004 0.4601 Notes: MR: Spanish stock market return, IR: (long-term) interest rate, SMB: size factor, HML: value factor, RMW: profitability factor, CMA: investment factor.
* p < 0.10, ** p < 0.05, *** p < 0.01.
Source: Own preparation from Eviews results.
R31 (Banco Santander), R34 (Mediaset) and R35 (Técnicas Reunidas) show a positive sensitivity, and in addition, Mittal steel company and Técnicas Reunidas overreact to changes in interest rates. According to Díaz and Jareño (2013), this positive effect could be explained because an increase in interest rates is consid- ered as “good news” for investors in the context of crisis. In contrary, R8 (Banco Sabadell) and R9 (Bankia) have statistically significant and negative sensitivity to changes in this explanatory factor. So, long-term interest rates exhibit high explanatory power.
The “size” factor (SMB) is statistically significant for all companies, except for R5 (Aena), R6 (Amadeus), R8 (Banco Sabadell), R9 (Bankia), R10 (Bankinter), R12 (Día), R13 (Endesa), R14 (Enagas), R15 (FCC), R18 (Gas Natural Fenosa), R20 (IAG), R25 (Merlin Properties), R30 (Repsol) and R33 (Telefónica). The rest of the companies (about 60% of them) show positive sensitivity to changes in SMB. In addition, this sensitivity is higher for R17 (Gamesa), R26 (Arcelomit- tal), R27 (OHL), R32 (Sacyr) and R35 (Técnicas Reunidas), and lower for R1 (Abertis) and R29 (REE). Therefore, the SMB factor also shows high explanatory power.
The “value” factor (HML) influences significantly and negatively on 46% of the companies, specifically, R7 (Banco Popular), R10 (Bankinter), R11 (Caixa- bank), R13 (Endesa), R15 (FCC), R16 (Ferrovial), R17 (Gamesa), R18 (Gas Natural Fenosa), R21 (Iberdrola), R24 (Mapfre), R27 (OHL), R28 (BBVA), R29 (Red Eléctrica), R30 (Repsol), R31 (Banco Santander) and R32 (Sacyr). Among them, the highest sensitivity to changes in this factor corresponds to Red Eléctrica and the lowest to Sacyr.
For the “profitability” factor (RMW), the sensitivity is statistically significant and negative in about 20% of the companies, such as R7 (Banco Popular), R10 (Bankinter), R11 (Caixabank), R18 (Gas Natural Fenosa), R24 (Mapfre), R28 (BBVA) and R34 (Mediaset).
Finally, regarding the “investment” variable (CMA), it is only statistically sig- nificant and positive for R15 (FCC) and negative for R20 (IAG). Thus, the ex- planatory power of CMA is quite low.
As previously said, the explanatory power is quite different between compa- nies. The mean adjusted R2 is about 32%. Besides, the explanatory power exceeds 50% for R5 (Aena), R26 (Arcelomittal) and R32 (Sacyr) and almost reaches 60%
for R28 (BBVA) and R31 (Banco Santander). Therefore, the explanatory power of the augmented Fama and French (2015) five-factor model increases in this recent financial crisis sub-period in comparison with the pre-crisis sub-period.