T
Borbála Szüle
Systemic Risk Dimensions in the Hungarian Banking and Insurance Sector
Summary: The consecutive financial crises have made the analysis of the systemic risks of financial institutions increasingly important worldwide. The researches so far have been primarily focusing on the banking sector, but insurance companies have also been given an increasing attention. Based on past literature, systematic risk can be measured in a variety of ways, and one of the options is the calculation of the indicators typical of return comovement. This study compares the dimensions calculated by the multidimensional scaling of returns in the banking and insurance sector. The results suggest that return dimensions in the Hungarian banking and insurance sector (related to systemic risk) are not completely independent, and, compared to the banking sector, the return comovement related systemic risk is lower in the insurance sector.1
KeywordS: bank, insurance, systemic risk JeL codeS: G21, G22
The objective of this study is to contribute to the extensive literature on systemic risk by an- alysing the Hungarian banking and insurance data. systemic risk has a variety of definitions (eling-Pankoke, 2014), the scope of the in- dicators is, therefore, very wide (Giglio et al., 2016; ellis et al., 2014; eling-Pankoke, 2014;
Kleinow et al., 2017; sedunov, 2016). Accord- ing to the definition used in the study (simi- larly to the approach described by Billio et al., 2010), the point of systemic risk is the sim- ilarity of different institutions, which can be measured by a principal component analysis.
Kritzman et al. (2011) call the systemic risk in- dicator calculated based on the result of the principal component analysis absorption ratio.
The absorption ratio is defined by Kritzman et al. (2011) as the indicator of what part of the total variance of a given set of assets is account- ed for (‘absorbed’) by some eigenvectors. Kritz- man et al. (2011) determine that the greater value of the absorption ratio corresponds to a higher level of systemic risk, because in this case the sources of the risk are more uniform.
in this study we compare the banking and in- surance systemic risks based on indicators sim- ilar to this absorption ratio. This indicator measures the effect of structural and cyclical systemic risks, also distinguished by the MNB (2018a), together, but based on the related cal- culations, it might theoretically be possible to separate the two types of systemic risk.
in this study, we use the method of mul- tidimensional scaling instead of the principal component analysis belonging to the absorp- E-mail address: borbala.szule@uni-corvinus.hu
tion ratio. The reason for this is that from a methodological aspect multidimensional scal- ing is more adequate in the case of the availa- ble data. in the case of the Hungarian banking and insurance sector, no stock-market data are available on daily returns covering most of the sectors; return data concerning the sectors as a whole can only be calculated from account- ing balance sheet and profit and loss statement data, the number thereof is, however, not suf- ficient to appropriately carry out the principal component analysis. However, the results of multidimensional scaling and principal com- ponent analysis are sometimes, theoretical- ly, the same (Bécavin et al., 2011); the results of the two methods can be directly produced from each other if certain conditions are met (Kovács, 2014; 226.). On this basis, we use the interval measurement model of multidimen- sional scaling in this study, where, similarly to the principal component analysis, eigenvec- tors can also be calculated, which can be in- terpreted as return dimensions in this analysis.
The analysis strives to take into account the data of the banking and insurance sector as fully as possible, so the analysis is founded on the available data of the banking and insur- ance balance sheets and profit and loss state- ments between 2003 and 2015 (downloada- ble from the website of the Magyar Nemzeti Bank). The analysis includes the data of 16 banks and 17 insurance corporations (insti- tutions in the case of which there were data available for the entire period covered by the analysis, and the average return on equity was not a negative value). in 2015, within the con- solidated balance sheet total the total amount of the balance sheet totals of the institutions included in the analysis amounted to 63.22 percent in the banking sector and 79.44 per- cent in the insurance sector.
The study primarily would like to contrib- ute to the literature by comparing the Hun- garian banking and insurance systemic risk
(measured based on the similarity of the re- turn dimensions), in which literature it is still relatively rare to compare the two sectors from a systemic risk aspect. The analysis of insur- ance activity separately from the banks is be- coming more and more important nowadays, as the activity of the non-bank financial inter- mediaries can lead to the growth of systemic risks as a result of a variety of impacts (MNB, 2018b), partly because (based on empirical re- sults) a causal relationship can be assumed be- tween insurance activity and economic growth (Arena, 2008). The comparison of the insur- ance and banking sector may mean interesting results for the macroprudential supervision as well, since, theoretically, the macroprudential policy tools affecting the whole financial in- termediary system primarily affect the banking sector in practice (Kálmán, 2016), and they deal with the expansion possibilities of the macroprudential regulatory framework system of insurance corporations at both global and european level (MNB, 2018b).
When comparing the two sectors, in addition to using the Hungarian data, the study also anal- yses the value of correlations between the return dimensions, which is also still not frequent; the results calculated with Hungarian data can be considered as a novelty in the literature.
The next, 2nd part of the study provides an overview of the systemic risk indicators com- monly mentioned in the literature. The 3rd part is about the comparison of the banking and insurance systemic risk, and the 4th part contains the new empirical results of the study.
The conclusions of the study are summarised in the 5th part.
THe measuremenT of sysTemic risk
Financial stability is important for the en- tire economy, but it does not have a uniform- ly used definition in the literature, it is more
common to define financial instability (Baur, schulze, 2009). systemic risk is an associat- ed concept, but it does not have a uniformly used definition in the literature either (eling, Pankoke, 2014). in the case of definitions, it is theoretically easy to distinguish, for exam- ple, the term of risk (which can be analysed by statistical methods) and uncertainty (which cannot be identified by statistical methods) (Medvegyev, 2011), but risk is a term which cannot be directly measured (latent) in a sta- tistical sense (Kovács, 2011), so practically, we can strive to measure the different aspects of risk at best. it is also typical in the case of sys- temic risk, the complexity of which is shown by the fact that in europe, based on certain data, even its connection with the return on sovereign debt can be demonstrated (Pagano, sedunov, 2016).
in the measurement of systemic risk a mac- ro and a micro approach can be distinguished:
the macroprudential indicators assess system- ic risk at the level of the entire economy, while the microprudential indicators can be quan- tified in relation to each institution (eling, Pankoke, 2014). in the european union it is the european systemic Risk Board that ful- fils the macroprudential financial supervision, and the european supervisory authorities are responsible for the microprudential supervi- sion (szegedi, 2012). in their study de Bandt and Hartmann (2000) distinguish the hor- izontal aspect of systemic risk, within which the analysis only focuses on the financial sec- tor, and the vertical aspect, which takes into consideration the impact on the economic output as well in the analysis of systemic risk.
in the case of systemic risk, furthermore, we can distinguish cyclical and structural system- ic risks: the source of cyclical systemic risk is the willingness to take risks, which is comov- ing but also differing from the optimum lev- el in a certain direction, while structural sys- temic risk corresponds to the structure of the
network between the different financial play- ers (MNB, 2018a). Theoretically, financial sta- bility risks can also be reduced with monetary policy and macroprudential policy tools, the prevention of the emergence of a system-lev- el crisis can be considered as the primary task of macroprudential policy (Fáykiss, szombati, 2013). Prior to the financial crises, the cyclical changes of systemic risk is shown, for exam- ple, by the rate of total debts compared to the GdP („Basel gap”) (Lang et al., 2019), and the risks arising from the features of the banking networks can be calculated in different ways (for example Lublóy, 2005). in alignment with the different types of systemic risk the macro- prudential tools include the countercyclical capital buffer as well as the structural systemic risk buffer (Kálmán, 2016).
According to the empirical results of Weiß et al. (2014) the global systemic risk is primar- ily influenced by the characteristics of the su- pervisory system, and the permanent impact of certain characteristics of the banks (for ex- ample, their credit portfolio quality) is not jus- tified by the empirical results. in the europe- an union the european systemic Risk Board (esRB) was established in 2010, and its ob- jectives include the prevention and mitigation of systemic risk. The banking sector of sever- al european countries has systemic risk capital buffer (systemic risk buffer) in order to mitigate systemic risks. The international Association of insurance supervisors (iAis) also deals with the development of the activity-based evalu- ation methods of systemic risks in the insur- ance sector (eCB, 2017;133.). Gauthier et al.
(2012) carried out calculations based on the data of Canadian banks in order to find out what impacts the application of systemic risk based macroprudential capital requirement might have on the banking sector. They de- fined macroprudential capital requirement as a fix point, in the case of which the capital re- quirement of each bank conforms to their con-
tribution of the risk of the entire system (in the case of the recommended capital require- ment). On the basis of their empirical results, the application of this systemic risk-based capi- tal requirement reduced the likelihood of indi- vidual bank failure as well as the likelihood of a system-level crisis by approximately 25 per- cent. This result was calculated by Gauthier et al. (2012) by a network-based structural mod- el. The network-based modelling approach has spread in the systemic risk literature over the last years (for example de souza et al., 2016;
Huang et al., 2016; Hu et al., 2015; Balog et al., 2012; Csóka and Kiss, 2015). such ex- pansion of the literature allows a more precise modelling of systemic risk, since the represent- ative banking hypothesis used in the tradition- al theoretical approach about bank regulation does not take into consideration, among oth- er things, that in the general equilibrium the investment decision of each bank can theoret- ically have an external impact on the results of the other banks, thus, also on their investment decisions (Acharya, 2009).
The variety of the impacts of financial in- stitutions exercised on each other also con- tributes to the fact that the range of system- ic risk indicators is extremely wide. Eling and Pankoke (2014) identified three important def- inition elements following the review of the 26 definitions of systemic risk:
• the occurrence of some event (for exam- ple, the bankruptcy of the financial insti- tution, the development of a shock affect- ing the economy as a whole, etc.);
• the impact of the event (most of the def- initions determine the consequences of the occurrence of the event, for example, that the event adversely influences the real economy);
• causal connection (some definitions high- light the causal connection, when it con- siders a given risk as systemic risk).
in connection with the banking system-
ic risk de Souza et al. (2016) identified some channels through which the risks may spread between the institutions:
• risk concentration channel, when a large part of the banks are exposed to a com- mon risk factor,
• contagion channel through balance sheet,
• contagion transmitted by the prices, for example, when an asset needs to be sold quickly („asset fire sales”),
• the development of illiquidity spirals.
The range of systemic risk indicators is very wide: indicators which can be defined in many different ways have spread in the theoretical model construction, and several different in- dicators have spread in the practical calcula- tions, too. Giglio et al. (2016) classifies a cou- ple of systemic risk indicators applied more commonly in the following groups:
• indicators measuring institution specif- ic risk, which measure the contribution or sensitivity of an institution towards the systemic risk measured at the level of the overall economy; they include, for exam- ple, the ΔCoVaR defined by Adrian and Brunnermeier (2008), which is the differ- ence of the conditional (financial) system- level VaRs measured by assuming the fi- nancial institution to be in a distressed state and to be in a median state;
• indicators with comovement and conta- gion focus, which measure the connection between the share returns of financial in- stitutions, including, for example, the ab- sorption ratio also mentioned by Kritz- man et al. (2011), which measures what proportion from the variance of the finan- cial system is accounted for by the first few principal components;
• volatility and instability indicators (which can, for example, be calculated from the average of the share volatility of the finan- cial institution);
• liquidity and credit indicators;
• other indicators (for example, the indica- tors associated with the relationships be- tween financial institutions, the values re- lating to the inter-bank credits, etc.).
The cumbersomeness of the grouping of systemic risk indicators is shown by the fact that numerous indicators do not fit well the four categories (apart from the ‘miscellaneous’
category) presented by Giglio et al. (2016); the indicator applied by Huang et al. (2009) can be considered as such a category, which meas- ures systemic risk by the theoretical price of the insurance against financial difficulties (a kind of risk-based deposit insurance). Over- all, it can be stated that the different aspects of systemic risk are not easy to separate even theoretically. Raffestin (2014) stated, for exam- ple, that portfolio diversification (for example in the assets of a bank) may, on the one hand, mean greater individual security, on the oth- er hand, relationships are established between the investors by holding identical assets, which results in the formation of a kind of ‘endog- enous covariance’ and also contributes to the systemic risk.
The covariance and correlation between re- turns is given an important role in the litera- ture about systemic risk measurement. in his theoretical model Acharya (2009) measures systemic risk by the value of the correlation re- lating to the returns of the assets held by the banks, selected in an endogenous manner. in his theoretical model, by analysing the choice of portfolio by the banks, Wagner (2009) pre- sents that when the external impacts of bank failure depend on the overall condition of the banking sector, a lower correlation at the banks is not necessarily more advantageous from the aspect of the financial system as a whole.
The systemic risk indicators measuring the comovement of returns have also spread in practical calculations. Civitarese (2016) pri- marily deals with characteristics of the ab- sorption ratio, eigenvalue entropy and index
Cohesion Force from the few systemic risk in- dicators based on return correlations:
• index Cohesion Force is the ratio of the average correlation calculated based on daily returns and the average partial corre- lation (the index calculates by filtering the impact of returns);
• the absorption ratio also described by Kritzman et al. (2011) can be calculat- ed by the eigenvalue-eigenvector decom- position of the covariance matrix of the returns, and can be interpreted as total variance proportion explained by high ei- genvalues;
• eigenvalue entropy can be calculated on the basis of the eigenvalue-eigenvector (or singular value) decomposition of the cor- relation matrix.
THe sysTemic risk Differences of financial secTors
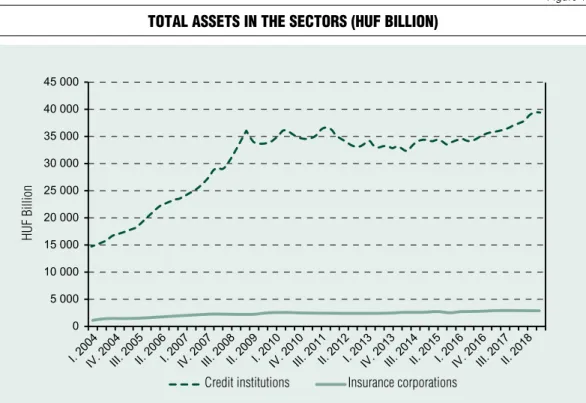
The traditional players of the financial inter- mediary system are the (commercial) banks, one of the principal activities of which is the acceptance of deposits and lending. An impor- tant source of the risks typical of the function- ing is that the maturity of the deposits is usual- ly shorter than that of the loans. The problems of each bank may constitute a system-level risk, as the financial problems of the banks in- terlinked through the network of mutual pay- ments, among other things, may spread to other banks, too. New sources of systemic risk developed by the spreading of modern finan- cial services; for example, by the development of financial groups, theoretically, even the fi- nancial problems of insurance companies may spread to the banking sector. The rate of sys- temic risk is, however, not necessarily identi- cal in the different sectors; the rate of systemic risk may be influenced by the size of the given sectors. in Hungary, the assets calculated from
the consolidated balance sheet of credit insti- tutions at the end of the third quarter of 2018 was approximately 13.8 times the total assets included in the statistical balance sheet of the insurance companies. Figure 1 shows the tem- poral evolution of these two values
it is clear from Figure 1 that the systemic risk effect of the insurance companies in the Hungarian financial sector may currently be lower, partly as a result of the size of the sec- tor, compared to the banking sector; howev- er, this statement can be phrased more precise- ly based on each institutional data. in the case of the differences in the sizes of each sector, it must also be considered that the size pro- portions may change in the longer term: at the same time (at the end of the third quarter of 2018) in some countries of the european union the ratio of the assets of credit institu-
tions and insurance corporations had variable values, as shown by Figure 2. The indicators which can be interpreted similarly to the Hun- garian data (which is approximately 13.8) in- clude values over 20 as well as values below 3. The lowest value was 1.76 in ireland, and the French (2.95), Belgian (3.15) and German (3.5) values are also relatively low. The rela- tive size of the insurance and banking sector may be influenced by many factors, for exam- ple, the consumption of life insurance prod- ucts may correspond to cultural factors (Chui, Kwok, 2008), and according to an empirical analysis the most robust explanatory factors of the use of life insurances include, for ex- ample, the development level of the banking sector, inflation and income per capita (Beck, Webb, 2003). As the economy develops and insurance products spread, the ratio of the in-
Figure 1 ToTal asseTs in The secTors (hUF billion)
Source: www.mnb.hu/statisztika/statisztikai-adatok-informaciok/adatok-idosorok/x-monetaris-es-egyeb-merlegstatisztikak) credit institutions
Huf Billion
insurance corporations
surance sector measured in comparison with the banking sector may increase in Hungary, which also supports the importance of system- ic risk researches conducted in the insurance sector.
When comparing the financial sectors, it is important to precisely define the systemic risk indicator. in the comparison of the sys- temic risks of the banking and insurance sec- tor the past literature often focused on the po- tential impacts of the ‘infections’. This is an important direction for the researches, and in this respect the literature often includes the statement that the systemic risk of the tradi- tional insurance activity is lower compared to the activity of the banks (Kessler, 2013; tri- chet, 2005; eling-Pankoke, 2014). One of the main related theoretical arguments is that in the case of insurance corporations, there is not
as high a level of institutional interconnection as the one observed in the inter-bank market and in the operation of the payment system (Thimann, 2014). The systemic risk of banks can be largely influenced by the inter-bank network of relationships, the maturity trans- formation combined with leverage, the pres- ence of liquidity risk and the operation of the payment system (Thimann, 2014). These fac- tors are not typical in the traditional insurance market, so it can be assumed that the system- ic risk of insurance corporations differs from that of the banks.
The spreading of the ‘infections’ corre- sponding to the institutional insolvency through the relationships between insurance corporations and reinsurance corporations could theoretically be possible by reinsurance (Morrison, 2003); however, the insolvency of Figure 2 raTio oF The asseTs oF crediT insTiTUTions and insUrance corporaTions
Source: european central Bank, http://sdw.ecb.europa.eu/ and own calculations
estonia latvia cyprus Greece lithuania slovakia spain Portugal austria finland The netherlands slovenia malta italy luxembourg Germany Belgium france ireland
%
a reinsurance corporation is not likely to have sector-level impacts in particular, but rath- er institutional impacts (esRB, 2015). Based on the esRB (2015, p. 14–17), the system- ic risk impact of insurance corporations (on the financial system or the real economy) may arise from the participation in non-traditional, non-insurance activities (for example, the un- dertaking of certain types of guarantee), from the procyclicality potentially appearing in as- set allocation, from the procyclicality observed in the rate setting of insurances and, for ex- ample, from the combined exposure to inter- est rate risk.
Compared to the banking sector, there is also a difference in terms of the emergence of institutional insolvency in the insurance sec- tor (and in any potential ‘infectious’ impacts thereof), since the clients of the banks can, in theory, immediately take out the fixed-term deposits from the bank, while in the case of insurances, the procedure of repurchases re- lating to contracts, with similar effect may be much slower, and the administrative costs as- sociated with the procedure might hold back the customers from repurchasing the contracts (Morrison, 2003). The practical experience re- lating to financial crises suggest that the meas- urement of systemic risk is important in the case of the insurance sector as well (Arnold et al., 2012); the iAis (international Association of insurance supervisors) also deals with the possibilities of the activity-based evaluation of systemic risk in the case of insurance corpora- tions (eCB, 2017, p. 133).
The empirical results relating to the topic do not clearly demonstrate the lower systemic risk of the insurance sector, the comparison of the (precisely defined) components of the in- surance and banking systemic risk can, there- fore, be seen as a current issue. When com- paring the ΔCoVaR (Adrian, Brunnermeier, 2008) type systemic risk indicators of the banking sector, the insurance sector and oth-
er financial services sector, Bernal et al. (2014) determined that all the three financial sectors significantly contributed to systemic risk in the case of both the euro zone and the usA.
By using data from between 2004 and 2012 for the analysis, Bernal et al. (2014) also found that in the euro zone the other financial servic- es sector and the banking sector made a larger systemic risk contribution than the insurance sector, while in the case of the usA, the insur- ance sector made the largest systemic risk con- tribution in the same period.
meTHoDoloGical overview anD emPirical resulTs
The literature of systemic risk mentions nu- merous different indicators, and from the dif- ferent approaches an outstanding number of indicators are linked to network theory and return comovement. These two measurement approaches can be considered to be the same from a certain point of view, as, theoretical- ly, network theory may contribute to the ex- planation of return comovements. in the next part, though, we will not discuss the theoreti- cal differences between the two types of meas- urement approaches, but we will only inter- pret the results of the calculations carried out similarly to one of the selected indicators.
This selected indicator is the absorption ratio, which, based on Kritzman et al. (2011), can be determined by taking into account the ei- genvalues calculated as the result of a principal component analysis. in mathematics, for ex- ample, eigenvalues can be interpreted in con- nection with the spectral decomposition the- orem of symmetrical matrix, if, for example, there is a symmetrical matrix M, then, based on the spectral decomposition theorem, there is an orthonormal base belonging to matrix M (which contains the eigenvectors of matrix M), in which matrix M is diagonal, and the ei-
genvalues will be found in the main diagonal of the diagonal matrix (Medvegyev, 2002, p.
454). in the principal component analysis, the coordinates of components can be calculated based on the eigenvectors of the correlation or covariance matrix, and the eigenvalues show the variances of the components. if relatively few components are needed for the eigenval- ues belonging to them to account for the ma- jority of the total variances, this suggests that the correlation values are relatively large in ab- solute value. if the correlation values refer to returns, the comovement of the returns can be measured with the eigenvalues which can be calculated in the principal component analy- sis, as, it was written by, for example, Kritz- man et al. (2011).
Kritzman et al. (2011) defined the absorp- tion ratio as the ratio of the sum of the first few eigenvalues and the sum of the total ei- genvalues in an analysis which includes the covariance matrix of the asset returns. Kritz- man et al. (2011) states that a larger value of the absorption ratio corresponds to a higher- level systemic risk, because the situation sug- gests that the sources of the risk are more uni- form.
The fact that stock-market data, which would provide basis for the calculation of daily returns, are only available in the case of a few institutions would cause a problem in the cal- culation of the absorption ratio for the Hun- garian banking and insurance data. Although daily data are not available, return values, for example the return on equity, can be calculat- ed from accounting reports. The quantity of the return value calculated this way is, how- ever, not sufficient to carry out the principal component analysis (the number of dates is lower than the number of variables in the da- tabase). The application of multidimensional scaling may mean a solution from a method- ological point of view, in which, with certain adjustments, it is possible to carry out calcula-
tions based on eigenvalue-eigenvector decom- position.
Multidimensional scaling is the compre- hensive name of a variety of methods; one of them is metric scaling. There is a direct link between the results of principal component analysis, used in the calculation of the absorp- tion ratio, and those of metric scaling in the case of the decomposition of the correlation matrix and the scaling of standardised euclid- ean distances (Kovács, 2014, p. 226). Bécav- in et al. (2011) also mentions that in certain cases the results of principal component anal- ysis and multidimensional scaling may be the same. Based on this, in the following calcu- lations we apply interval level measurement model for multidimensional scaling. similar- ly to the analysis of Kritzman et al. (2011), the analysis is made on the basis of return data, and as Kritzman et al. (2011) considers the co- variance matrix of returns as the starting point of the analysis, in the course of the multidi- mensional scaling we do not standardise the return variables. Although this was not given an important role in the analysis of Kritzman et al. (2011), in this analysis we also examined the autocorrelation of returns, and the p-value corresponding to the Box-Ljung test was gen- erally a relatively high value in the case of first- order autocorrelations; it happened only in a few cases that the null hypothesis of the test was only acceptable at a significance level of 0.1 percent. On this basis no return data were skipped in the analysis in order to avoid any potential autocorrelation problems.
The values of the returns are calculated in the analysis as return on equity based on ac- counting data (the return can be calculated by dividing the value of the earnings before taxes by the value of equity). The returns were calcu- lated in the case of institutions that published balance sheet and profit and loss statement data in each year between 2003 and 2015, and where the average return calculated on the
basis of this period was not a negative value.
The data included in the analysis represent a large part of the two sectors: within the con- solidated balance sheet total in 2015 the total amount of the balance sheet totals of the in- stitutions included in the analysis represented 63.22 percent in the banking sector and 79.44 percent in the insurance sector.
The point of multidimensional scaling in this analysis situation can be summarised by saying that based on the coordinates calcula- ble in the space with the original number of dimensions, spatial coordinates with fewer di- mensions can be calculated so that the origi- nal and the ‘artificial’ spatial distance matrix be as similar as possible. The similarity can be measured by stRess indicator and the R- squared indicator specific to the relation of the two types of distance values. if fitting is excel- lent in the space with the given number of di- mensions, it is worth interpreting the multidi- mensional scaling spatial dimensions. in this analysis the multidimensional scaling dimen- sions constitute the return dimensions, and it is a really interesting research question as to what extent the banking and insurance return dimensions are similar in an excellently fitting model. The number of dimensions in the ex- cellently fitting model is also an interesting piece of data, which can be compared to what
the number of the components (and the eigen- values belonging to them) kept in the analysis would be in the principal component analysis.
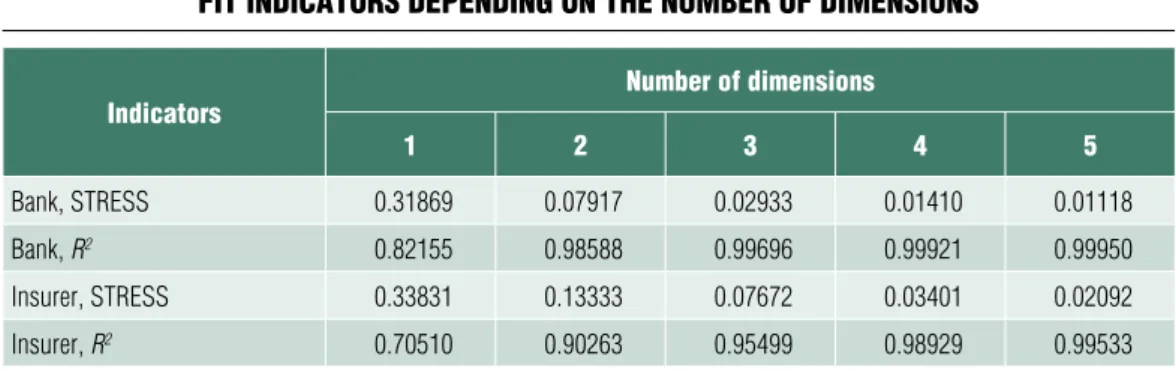
in multidimensional scaling models one of the indicators of fitting is the stRess (stand- ardised Residual sum of squares) indicator whose value below 0.05 refers to good fitting (Kovács, 2014, p. 228). The adequacy of fit- ting is also indicated by the R-squared indi- cator calculable concerning the relation of the two types of distance value, in which case there is no specific value for the measurement of ex- cellent fitting; the higher the R-squared indi- cator, the better the alignment. The summary of the stRess and R-squared values meas- ured (in the case of the different numbers of dimensions) based on the data of the 16 banks and 17 insurance corporations included in the analysis is contained in Table 1.
From the stRess values included in ta- ble 1, it can be concluded that the 3-dimen- sion solution in the case of the banking sector can be considered as good, while in the case of the insurance sector, the good fitting of the model can be observed for the first time in the 4-dimension solution. These results are simi- lar to as if 3 or 4 components had been kept in a principal component analysis separately based on the 16 (banking) and 17 (insurance) variables. Of course, the number of the var-
Table 1 FiT indicaTors depending on The nUmber oF dimensions
indicators number of dimensions
1 2 3 4 5
Bank, sTress 0.31869 0.07917 0.02933 0.01410 0.01118
Bank, R2 0.82155 0.98588 0.99696 0.99921 0.99950
insurer, sTress 0.33831 0.13333 0.07672 0.03401 0.02092
insurer, R2 0.70510 0.90263 0.95499 0.98929 0.99533
Source: own calculation based on www.mnb.hu
iables included in the analysis may influence the result, but the difference is relatively mi- nor between the 16 and 17 variables, and in the insurance sector, both indicators are slight- ly more disadvantageous in the 4-dimension solution than in the 3-dimension solution in the banking sector (the R-squared value is low- er and the stRess value is higher). Overall, based on the results of table 1, it can be con- cluded that the returns move together to a less- er extent in the insurance sector than in the banking sector, which means that the systemic risk of the insurance sector can be considered as slightly lower than that of the banking sec- tor. The fitting indicators calculated in the two sectors can be compared in Figures 3/a and 3/b;
these two figures also suggest the slightly lower systemic risk of the insurance sector.
Based on the results, in the case of the 16 banking return variables, the 3-dimension scaling model is well-fitting, which suggests the relatively great comovement of returns, similarly to the 4-dimension model of the in- surance sector. The different types of system- ic risk (cyclical and structural) may, theoreti- cally, result in the comovement of returns; due to, for example, the asset price bubbles cate- gorised by the MNB (2018a) into the catego- ry of cyclical systemic risk types, the returns of banks providing lending relating to real estates of similar type may change similarly to each other. exposure concentration can be clas- sified into the category of structural system- ic risks, for example, if the lending activity of certain banks does not differ greatly in terms of customer type (MNB, 2018a), it may also result in a similar trend in the institution-level return indicators.
Coordinate data belonging to return dimen- sions are available in the well-fitting banking and insurance models, in the case of which the value of the correlation coefficient is theoreti- cally zero, because they can correspond to the eigenvectors (similarly to the ‘artificial’ vari-
ables calculable in the principal component analysis). The (Pearson type) correlation co- efficients calculable among the return dimen- sions of the banking and insurance sector are not necessarily zero, and their values may show the similarity of the ‘factors’ influencing the re- turns of the two sectors; these values of correla- tion coefficients are contained in Table 2.
in multidimensional scaling each dimen- sion follows each other in order of ‘impor- tance’, which means, for example, that along the first dimension, the difference of the max- imum and minimum value is greater than along the second dimension. taking this into consideration, we can state that the dimension which can be considered as the most impor- tant one in the banking sector slightly corre- lates with the fourth dimension in the insur- ance sector (and the value of the correlation cannot be considered as different from zero at a significance level of 5 percent). This result may indicate the differences of the banking and the insurance sector; based on table 2, the dimension ‘explaining’ the banking returns the most does not have a significant influence on the returns of the insurance sector. How- ever, the second most important dimension in the banking and the insurance sector corre- lates significantly. The name of this dimension (for example, based on which economic factor this dimension correlates with) could be the subject of a separate analysis, we do not discuss this issue in this analysis for reasons of space.
The third dimension in the banking sector sig- nificantly correlates with the first dimension of the insurance sector, too (the sign of the cor- relation coefficient does not need to be inter- preted in this case, because the sign of the ei- genvectors belonging to the dimensions is optional), which suggests that the two sectors are similar to a certain extent. On the whole, the results suggest that the returns of the bank- ing and the insurance sector evolve under the impact of partly different factors, and as a re-
Figure 3/a sTress indicaTors depending on The nUmber oF dimensions
Source: own calculations based on www.mnb.hu
Figure 3/b r2 indicaTors depending on The nUmber oF dimensions
Source: own calculations based on www.mnb.hu Bank
Bank
number of dimensions
number of dimensions
llimit value insurance
corporations
insurance corporations
sult, there is a minor difference between the systemic risk relating to return comovement posed by the two sectors.
summary
The systemic risk assessment relating to finan- cial institutions have been given greater and greater attention over the last years. in this process, the operation of insurance corpora- tions and other financial institutions in ad- dition to banks are also given increasing at- tention. This study primarily would like to contribute to the literature by comparing the systemic risk of the Hungarian banking and insurance sector.
systemic risk can be measured in a variety of ways, and in this study we discussed a meth- od that relates to the measurement of the co- movement of returns. The multidimensional scaling method used in the study is similar to the principal component analysis applied for the calculation of the indicator referred to as absorption ratio; however, it is more adequate for the analysis of the available data from a methodological point of view. No stock-mar- ket return data are available on a large part of the institutions of the Hungarian banking and
insurance sector, but returns can be calculated for each institution of the sectors from the bal- ance sheet and profit and loss statement pub- lished annually. With a few exceptions, the study includes the return on equity data of each bank and insurance corporation between 2003 and 2015, based on which the most im- portant return dimensions can be separated and compared across the sectors. The fit data of the solutions with different numbers of di- mensions can be interpreted in a manner sim- ilar to the absorption ratio spread in the liter- ature as a systemic risk indicator. Based on the results, it can be concluded that the system- ic risk of the insurance sector relating to re- turn comovement is slightly lower than that of the banking sector. The difference of the bank- ing and the insurance sector is also indicted by the fact that from the return dimensions the dimension with the greatest significance in the banking sector only correlates with the di- mension that is the fourth most important one for the insurance corporations. The certain de- gree of similarity between the two sectors is shown by the fact that the relation of the val- ues belonging to the second dimension (sec- ond banking and insurance dimension) can be considered as significant. Overall, the re- sults of the study are similar to the view stat- Table 2 correlaTion coeFFicienTs in The case oF dimensions
ins1 ins2 ins3 ins4
Bank1 0.155 –0.143 0.451 –0.537
(0.614) (0.642) (0.122) (0.059)
Bank2 –0.306 0.849 0.114 0.169
(0.310) (0.000) (0.710) (0.581)
Bank3 –0.763 –0.172 –0.096 –0.342
(0.002) (0.574) (0.754) (0.253)
Source: own calculation based on www.mnb.hu (p-values in brackets)
ed in the literature that suggests that the sourc- es of the banking and insurance systemic risk are partly different, and accordingly, the insur- ance systemic risk can be seen as lower than that of the banking sector.
With regard to the results, it is important to underline that the study includes a meth- odological approach that is similar to only one of the possible systemic risk indicators, so the conclusions might theoretically be different when the calculation of systemic risk is made by a different approach. Furthermore, it is im- portant to note that a wide range of data is only available from the data of accounting re- ports in the case of Hungarian banks and in-
surance corporations, so the results cannot be directly compared with other studies which made calculations with daily returns calculat- ed on the basis of stock exchange quotations.
Having said that, the results of the study strive to describe the whole banking and insurance sector as far as possible, and as a result of the uniform methodological approach, the com- parison of the two sectors is feasible. A fur- ther direction for the studies on this topic may be constituted by the definition of other re- turn indicators from the available data, and the comparison of the results calculated by the same methodology, on the basis of different re- turn indicators.
Note
References
1 The author expresses her gratitude to the reviewer for the invaluable recommendations concerning the adaption of the study.
Acharya, V. V. (2009). A Theory of system- ic Risk and design of Prudential Bank Regulation.
Journal of Financial Stability, 5. pp. 224–255 Adrian, t., Brunnermeier, M. K. (2008). Co- VaR. Federal Reserve Bank of New York staff Re- ports, no. 348
Online: https://www.newyorkfed.org/medialibrary/
media/research/staff_reports/sr348.pdf
Arena, M. (2008). does insurance Market Activity Promote economic Growth? A Cross-Country study for industrialized and developing Countries. The Jour- nal of Risk and Insurance, Vol. 75, No. 4., pp. 921–946 Arnold, B., Borio, C., ellis, L., Moshirian, F. (2012). systemic Risk, Macroprudential Policy
Frameworks, Monitoring Financial systems and the evolution of Capital Adequacy. Journal of Banking
& Finance, 36, pp. 3125–3132
Balog d., Bátyi t. L., Csóka P., Pintér M.
(2012). Pénzügyi hálózatok modellezése Jackson és Watts (2002) nyomán. (The Modelling of Finan- cial Networks Further to Jackson and Watt (2002).) in: egyensúly és optimum. (equilibrium and Op- timum). tanulmányok Forgó Ferenc 70. szüle- tésnapjára. (studies for the 70th Birthday of Fer- enc Forgó). Aula Publishing House, Budapest, pp.
151–168
de Bandt, O., Hartmann, P. (2000). systemic Risk: A survey. european Central Bank Working Pa- per, No. 35
Baur, d. G., schulze, N. (2009). Financial Mar- ket stability – A test. Journal of International Finan- cial Markets, Institutions & Money, 19, pp. 506–519
Beck, t., Webb, i. (2003). economic, demo- graphic, and institutional determinants of Life in- surance Consumption Across Countries. The World Bank Economic Review, Vol. 17, No. 1, pp. 51–88
Bernal, O., Gnabo, J., Guilmin, G. (2014). As- sessing the Contribution of Banks, insurance and Other Financial services to systemic Risk. Journal of Banking & Finance, 47, pp. 270–287
Bécavin, C., tchitchek, N., Mintsa-eya, C., Lesne, A., Benecke, A. (2011). improving the ef- ficiency of Multidimensional scaling in the Analy- sis of High-dimensional data using singular Val- ue decomposition. Bioinformatics, 27(10), pp.
1413–1421
Billio, M., Getmansky, M., Lo, A. W., Peliz- zon, L. (2010). Measuring systemic Risk in the Finance and insurance sectors. MIT Sloan School of Management, MIT Sloan School Working Paper 4774-10
Billio, M., Caporin, M., Panzica, R., Pelizzon, L. (2015). Network Connectivity and systematic Risk.
Online: https://www.wu.ac.at/fileadmin/wu/d/i/fi- nance/BBs-Papers/ss2015/20150303_Pelizzon_
etal.pdf
Civitarese, J. (2016). Volatility and Correlation- Based Systemic Risk Measures in the US Market. Phys- ica A 459, pp. 55–67
Chui, A. C. W., Kwok, C. C. Y. (2008). Nation- al Culture and Life insurance Consumption. Jour- nal of International Business Studies, Vol. 39, No. 1, pp. 88-101
Csóka P., Kiss t. (2015). Az összekapcsoltság ha- tása a rendszerkockázatra homogén bankrendszer-
ben. (The effect of interconnectedness in a Homo- geneous Banking system.) Szigma, 46 (1–2)
eling, M., Pankoke, d. (2014). systemic Risk in the insurance sector: Review and directions for Fu- ture Research. University of St.Gallen Working papers on finance No. 2014/21
Online: http://ux-tauri.unisg.ch/publications/per son/e/Martin_eling/238473
ellis, L., Haldane, A., Moshirian, F. (2014).
systemic Risk, Governance and Global Financial sta- bility. Journal of Banking & Finance, 45, pp. 175-181 Fáykiss P., szombati A. (2013). Makropru- denciális felügyelet az eurozónán kívüli európai országokban. (Macroprudential supervision in Non- euro Area european Countries.) MNB Szemle kü- lönszám (MNB Bulletin Special Issue), pp. 63–70
Gauthier, C., Lehar, A., souissi, M. (2012).
Macroprudential Capital Requirements and system- ic Risk. Journal of Financial Intermediation, 21, pp.
594–618
Giglio, s., Kelly, B., Pruitt, s. (2016). sys- temic Risk and the Macroeconomy: An empirical evaluation. Journal of Financial Economics, 119, pp.
457–471
Hu, d., schwabe, G., Li, X. (2015). systemic Risk Management and investment Analysis with Fi- nancial Network Analytics: Research Opportunities and Challenges. Financial Innovation, 1
Huang, W. Q., Zhuang, X. t., Yao, s., uryasev, s. (2016). A Financial Network Perspective of Finan- cial Institutions’ Systemic Risk Contributions. Physica A 456, pp. 183–196
Huang, X., Zhou, H., Zhu, H. (2009). A Framework for Assessing the systemic Risk of Major Financial institutions. Journal of Banking & Finance, 33, pp. 2036–2049
Kálmán, J. (2016). A pénzügyi közvetítőrendszer makroprudenciális szabályozásának és felügyeleté- nek közigazgatási jogi aspektusai – normativitás, sz- ervezet, eszközrendszer. (Administrative Law Aspects of the Macroprudential Regulation and supervision of the Financial intermediary system – Normativity, Organisation, toolkit.) Hitelintézeti Szemle (Finan- cial and Economic Review), Vol. 15 issue 3, pp. 27–50 Kessler, d. (2013). Why (Re)insurance is Not systemic. The Journal of Risk and Insurance, 81(3), pp. 477–487
Kleinow, J., Moreira, F., strobl, s., Vähämaa, s. (2017). Measuring systemic Risk: A Comparison of Alternative Market-based Approaches. Finance Research Letters, 21, pp. 40–46
Kovács e. (2011). A kockázat mint látens foga- lom. (Risk – A Latent Concept.) Hitelintézeti Sze- mle (Financial and Economic Review), 10(4), pp.
349–359
Kovács e. (2014). Többváltozós adatelemzés.
(Multivariable Data Analysis). typotex
Kritzman, M., Yuanzhen, L., Page, s., Rigo- bon, R. (2011). Principal Components as a Meas- ure of systemic Risk. The Journal of Portfolio Man- agement, 37(4)
Lang, J. H., izzo, C., Fahr, s., Ruzicka, J.
(2019). Anticipating the Bust: A New Cyclical sys- temic Risk indicator to Assess the Likelihood and severity of Financial Crises. European Central Bank Occasional Paper Series, No. 219
https://www.ecb.europa.eu/pub/pdf/scpops/ecb.
op219~7483083881.en.pdf?3f125128c57998e5b8 471c888c739de4
Lublóy Á. (2005). dominóhatás a magyar bank- közi piacon. (domino effect in the Hungarian in- terbank Market.) Közgazdasági Szemle (Economic Re- view), 59(11), pp. 377–401
Medvegyev P. (2002). Valószínűségszámítás.
(Probability Calculation.) Fejezetek a matematikai analízisből és a valószínűségszámításból. (Chapters from Mathematics Analysis and Probability Calcula- tion.) Aula
Medvegyev P. (2011). Néhány megjegyzés a kockázat, bizonytalanság, valószínűség kérdéséhez.
(Notes on Risk, uncertainty, Probability.) Hitelin- tézeti Szemle (Financial and Economic Review), 10(4), pp. 314–324
Morrison, A. d. (2003). The economics of Capi- tal Regulation in Financial Conglomerates. The Gene- va Papers on Risk and Insurance, 28(3), pp. 521–533
Pagano, M. s., sedunov, J. (2016). A Compre- hensive Approach to Measuring the Relation Be- tween systemic Risk exposure and sovereign debt.
Journal of Financial Stability, 23. pp. 62–78 Raffestin, L. (2014). diversification and sys- temic Risk. Journal of Banking & Finance, 46, pp.
85–106
sedunov, J. (2016). What is the systemic Risk exposure of Financial institutions? Journal of Finan- cial Stability, 24. pp. 71–87
de souza, s. R. s., silva, t. C., tabak, B. M., Guerra, s. M. (2016). evaluating systemic Risk using Bank default Probabilities in Financial Net- works. Journal of Economic Dynamics & Control, 66, pp. 54–75
szegedi L. (2012). A pénzügyi piacok közvetlen európai felügyeletének kihívásai. (Challenges of di- rect european supervision of Financial Markets.) Pé- nzügyi Szemle (Public Finance Quarterly). Vol. LVii issue 3, pp. 368–379
thimann, C. (2014). How insurers differ from Banks: A Primer on systemic Regulation; sRC spe- cial Paper No 3.
Online: http://www.systemicrisk.ac.uk/sites/default/
files/downloads/publications/sp-3_1.pdf
trichet, J. (2005). Financial stability and the insurance sector. The Geneva Papers on Risk and In- surance, 30, pp. 65–71
Wagner, W. (2009). efficient Asset Allocations in the Banking sector and Financial Regulation.
International Journal of Central Banking, 5(1), pp.
75–95
Weiß, G. N. F., Bostandzic, d., Neumann, s.
(2014). What Factors drive systemic Risk during international Financial Crises? Journal of Banking &
Finance, 41, pp. 78–96
eCB (2017). Financial stability Review. europe- an Central Bank, May 2017,
Online: https://www.ecb.europa.eu/pub/fsr/html/
index.en.html
esRB (2015). Report on systemic Risks in the eu insurance sector. european systemic Risk Board, december 2015
MNB (2018a). stabilitás ma – stabilitás holnap.
(stability today – stability tomorrow.) A Magyar Nemzeti Bank makroprudenciális stratégiája. (The Macroprudential strategy of the Magyar Nemzeti Bank.) Magyar Nemzeti Bank, https://www.mnb.
hu/penzugyi-stabilitas/makroprudencialis-politika/
az-mnb-makroprudencialis-strategiaja
MNB (2018b). Makroprudenciális jelentés.
(Macroprudential Report.) Magyar Nemzeti Bank, https://www.mnb.hu/kiadvanyok/jelentesek/makro- prudencialis-jelentes/makroprudencialis-jelentes-2018