ON THE INTERACTION BETWEEN INSURANCE RISK, MARKET RISK AND CAPITAL ALLOCATION IN THE
INSURANCE SECTOR
Borbála Szüle 1*
1 Insurance Education and Research Group, Corvinus University of Budapest, Hungary
Keywords:
Insurance Portfolio Risk
Article history:
Received 5 March 2019 Revised 15 March 2019 Accepted 26 March 2019
Abstract
This paper presents a model in which the effects of insurance risk on external (market) risk and internal (capital allocation related) risk can be compared. The model highlights that the composition of the insurance portfolio within an insurance group may not only affect internal capital allocation and performance measures, but also market risk and thus theoretical investment decisions. The main research question of the paper is whether external (market) and internal risk measures depend similarly on insurance risk. The paper aims at contributing to previous literature with theoretical results suggesting that, depending on the size of insurance risk, a change in insurance risk correlation may be accompanied by similar or opposite modifications in market risk and internal risk.
1 Introduction
Risk is a key concept in the insurance business, where both profitability and solvency depend on the performance of insurance risk portfolios. Since insurers play an important role in financial intermediation, it is a compelling research question, whether internal risk and external (market) risk are correlated, and how their relationship is influenced by the „classical” insurance risk. The paper aims at contributing to previous literature with a theoretical analysis of these questions.
The paper presents a model in which an insurance group consists of two separate companies that are components of the investment market. For the sake of simplicity, the investment market is assumed to be consisting of three companies, with the third company representing other investment alternatives. The external (market) risk of the separate insurance companies is measured by the market beta (as defined by the CAPM model), while the internal risk is measured by the internal beta in the CVaR based capital allocation. The paper aims to contribute to previous literature with theoretical results that indicate how external (market) risk and internal (capital allocation related) risk within an insurance group may be affected by changes in insurance risk.
Previous literature has not focused on modeling the relationship between external and internal risk measures, although both risks are of considerable practical importance. To measure internal risk, the paper applies CVaR (TailVaR) based capital allocation and internal beta values. The CVaR (TailVaR) based capital allocation models are frequently applied in the literature (e.g. Bargès et al.
(2009), Cossette et al. (2012)), and internal beta calculations are introduced for example by Panjer (2001). Although capital allocation does not necessarily involve an actual transfer of funds (it may be notional), it may be applied in several cases, for example in performance measurement or its purpose may be incentive compensation. (Zaks-Tsanakas (2014)) The capital that is allocated to a particular risk should reflect the contribution of that risk to the portfolio (Zaks-Tsanakas (2014)), thus capital allocation can be an important component of enterprise risk management (Dhaene et al.
(2012)). In the European insurance solvency regulation the ORSA (Own Risk and Solvency
Assessment) also highlights the importance of capital allocation, especially for insurance groups.
(Maume-Deschamps et al. (2016)) The choice of the most adequate capital allocation method is not always straightforward, Csóka-Pintér (2010) show that for a coherent risk measure it is theoretically impossible to allocate risk satisfying the requirements of core compatibility, equal treatment property and strong monotonicity. Although theoretical properties of capital allocation methods are important, Gründl-Schmeiser (2005) argue that capital allocation methods can be assessed only in the context of the economic goals of the company. With a comparison of selected methods, Homburg- Scherpereel (2008) conclude that the internal beta method for capital allocation is one of the best perfoming methods. In the paper, internal beta values are applied to quantify „internal” risk of an insurance company. As opposed to internal beta, the market beta belonging to an asset can be interpreted as measuring the sensitivity of the asset return to variations in the market return (Fama- French (2004)). The „external” risk is measured by the market beta in the model.
The paper is organized as follows. Section 2 describes the theoretical model for the insurance sector. Section 3 introduces the model for the investment market, while Section 4 compares external (market) and internal risk measures. Section 5 summarizes and describes directions for future research.
2 The model for the insurance sector
The insurance model incorporates some features of insurance companies that have a portfolio consisting of „traditional” (life or non-life) insurance products. As Insurance Europe (2014) (page 23) points out, the majority of assets on the asset side of balance sheets of insurance companies is related to bonds, and the largest component on the other side of the balance sheet is associated with insurance liabilities. The presented model reflects these empirical findings. The two separate insurance companies are assumed to have different (but within the insurance company homogeneous) insurance portfolios with an insurance event occurrence probability p1 and p2, respectively. The size of the insurance portfolios is measured by the number of insurance policies (indicated by n1 and n2).
For each individual insurance policy a random variable (ξj, j=1, …, n) can be defined, so that the value of this random variable is equal to 1 if the insurance event occurs in case of the j-th insurance policy and 0 otherwise. The sum of these random variables equals the total number of occurred insurance events in the two portolios (indicated by ξ1 and ξ2). The total number of occurred insurance events is binomially distributed, and its distribution function can be approximated with the normal distribution function for a sufficiently large insurance portfolio (in the model this approximation is applied in the calculations). The dependence structure of the two insurance portfolios is described by the correlation between ξ1 and ξ2 (indicated by ρ12).
The model assumes that policyholders pay single premium (net premium plus certain expenses) and policyholders are entitled to receive the sum insured (B) if the insurance event occurs during the term of the insurance. It is assumed that the term of insurance is one year. The technical rate of return belonging to the insurance contracts is indicated by i1 and i2 in the two insurance companies. Based on these assumptions, and by applying the equivalence principle (as described for example in Dickson et al (2011), page 146), the net premium payable by the policyholder at the beginning of the insurance term equals (Bpj)/(1+ij) (j=1, 2). At the beginning of the insurance term the sum of collected net premiums equals the value of insurance reserves (that correspond to insurance liabilities). The value of own funds (equity) are assumed to be related to the value of insurance liabilities: (Bpjnjs)/(1+ij) (for j=1, 2).
Investments are assumed to be corresponding to regulatory requirements in the model. It is assumed that at the beginning of the insurance term the collected net premiums are invested into financial assets, and the expected value of the return on these investments (that belongs to the insurance company, according to regulations) is equal to r. The rate that is applied for discounting is indicated by k. Based on these assumptions, the present value of loss in the j-th insurance company (j=1, 2) is described by Equation (1):
𝜂𝑗 = 𝐵𝜉𝑗
1+𝑘−𝐵𝑛𝑝𝑗
1+𝑘
(1+𝑠)(1+𝑟𝑗)
1+𝑖𝑗 (1)
The present value of loss of the insurance group (consisting of the two separate insurance companies) is η=η1+η2. Among other alternatives, the total capital requirement of the insurance company can theoretically be measured with CVaR (conditional Value-at-Risk), that quantifies losses that may be encountered in the tail of the loss distribution. The CVaR value at a given confidence level is the expected loss given that the loss is greater than the VaR (Value-at-Risk) at that level (Rockafellar-Uryasev (2002), McNeil et al. (2005), pages 44-45). The CVaR and TailVaR are similar terms (Rockafellar-Uryasev (2002)), and The Tail Value-at-Risk (TailVaR) is sometimes also referred to as expected shortfall (e.g. Cossette et al. (2012)), and can be considered as a coherent risk measure (Artzner et al. (1998)). By assuming that η1 and η2 follow multivariate normal distribution (similar to for example Ágoston (2012) where returns are assumed to have multivariate normal distribution) it is possible to allocate capital to the separate insurance companies. According to the results in Panjer (2001), the allocated capital in case of the j-th insurance company (j=1, 2) is described by Equation (2).
𝐶𝑗𝐴 = 𝐸(𝜂𝑗) +𝑐𝑜𝑣(𝜂𝑗,𝜂1+𝜂2)
𝜎2 (𝐶 − 𝐸(𝜂)) (2)
In Equation (2) E(η1) and E(η) indicate present value of loss, cov(η1,η) is the covariance between the two loss present values, and σ2 is the variance of the loss present value. As Panjer (2001) points out, Equation (2) is similar to the CAPM (Capital Asset Pricing Model) equation for expected asset return, and a beta (that is called „internal” beta in the model) can be defined as cov(ηj,η1+η2 )/σ2 (for j=1, 2). By applying the presented assumptions about the composition of insurance portfolios, the internal beta for one of the insurers (β1I) can be defined as described by Equation (3).
𝛽1𝐼 = 𝑛1𝑝1(1−𝑝1)+𝜌12√𝑛1𝑝1𝑛2𝑝2(1−𝑝1)(1−𝑝2)
𝑛1𝑝1(1−𝑝1)+𝑛2𝑝2(1−𝑝2)+2𝜌12√𝑛1𝑝1𝑛2𝑝2(1−𝑝1)(1−𝑝2) (3)
It is important to emphasize that the two insurance companies can be legally separate firms, the capital allocation calculations are not assumed to be related to the transfer of funds. Capital allocation can also be applied in performance measurement (Zaks-Tsanakas (2014), Maume- Deschamps et al. (2016), Froot-Stein (1998)), it often plays a role as a basis for determining the performance of business segments, for example the cost of the allocated capital can be compared with the earnings of a particular line of business (Gründl-Schmeiser (2005)). In the model, internal beta values indicate the extent of capital requirement, thus can be considered as indicators for
„internal risk”.
3 The model for the investment market
The market risk is often measured by the market beta in the literature, as suggested by the seminal papers about the theoretical foundations of the Capital Asset Pricing Model (e.g. Lintner (1965), Sharpe (1964)). According to the portfolio theory (introduced by Markowitz (1952)) portfolio diversification may result in reduced risk. Some portfolios can be considered as efficient (having the smallest risk at a given level of expected return, assuming that the risk is not below the minimum possible risk level). One of these efficient portfolios is the market portfolio, and the market beta in CAPM is defined as the ratio of the covariance between the return of a risky investment and the return of the market portfolio and the variance of the market portfolio return. According to Fama- French (2004) the market beta of an asset measures the sensitivity of the asset return to variations in the market return. Although the market beta is commonly applied in financial calculations, it represents only a certain aspect of risk, thus in the literature multi-factor models are also frequently analyzed (as described by for example Fama-French (2015)). In practice, the computation of market
beta may be influenced by various calculation details (as described by for example (Handa et al.
(1989)).
In this paper it is possible to identify the link between some of the insurance company attributes and the market beta of the insurance companies. For the sake of simplicity, it is assumed that the
„investment market” consists of three companies: the two insurance companies and an other company that belongs to an other business sector. It is assumed that the stocks of the two insurance companies are traded separately, and the third company represents other investment alternatives.
It belongs to the assumptions that the expected return of the insurance companies is the technical rate of return (applied in insurance premium calculation): E(rj)=ij (i=1, 2). In practice, these two expected return values could deviate from the technical rate of return, and then profit sharing would be applied (as described by insurance regulation). The standard deviation of the return of insurance companies can be calculated as a function of selected insurance portfolio attributes: σj=((1+ij)/s)∙((1- pj)/(njpj))0.5 (i=1, 2). Equation (4) describes the correlation matrix that is assumed to characterize the dependency structure of market returns. Theoretically a copula approach could also be applied in the modeling of the dependency structure (as described by for example Bargès et al. (2009)), but if loss values are assumed to follow multivariate normal distribution, then the linear correlation coefficient can also be considered as adequate in measuring return dependency.
𝑅 = (
1 𝜌12 𝜌13 𝜌12 1 𝜌23 𝜌13 𝜌23 1
) (4)
The relationship between insurance markets and other economic sectors may have several aspects, for example according to Lee et al. (2013) Granger causality testing related empirical results suggest that in case of stock, bond and insurance markets the direction of causality can differ across countries. Theoretically the correlation values ρ13 and ρ23 may also be influenced by the relationship of the insurance sector and other economic sectors, for example Lee et al. (2017) and Lee et al.
(2016) conclude that insurance development and economic growth may be related.
The market beta is calculated as a ratio of covariance values. The covariance between the returns can be calculated as cov(rj,rk)=ρjkσjσk. The variance of the market portfolio return depends on the composition of the market portfolio (that is defined according to the CAPM). If the weights that belong to the market portfolio are indicated by w1*, w2* and w3*, then the market beta belonging to one of the insurance companies can be calculated based on Equation (5), by assuming that T=w1*w2*cov(r1,r2)+w1*w3*cov(r1,r3)+w2*w3*cov(r2,r3):
𝛽1𝑀 = 𝑤1∗𝜎12+𝑤2∗𝑐𝑜𝑣(𝑟1,𝑟2)+𝑤3∗𝑐𝑜𝑣(𝑟1,𝑟3)
(𝑤1∗)2𝜎12+(𝑤2∗)2𝜎22+(𝑤3∗)2𝜎32+2𝑇 (5)
4 The relationship between risk measures
In the presented model it is possible to derive closed-form solutions for both internal and market (external) risk measures, thus it can be examined how certain insurance risk attributes affect their relationship. The focus of the analysis is on the size of insurance risk (measured by the pro bability of the insurance event occurrence) and the profit correlation between the two insurance companies.
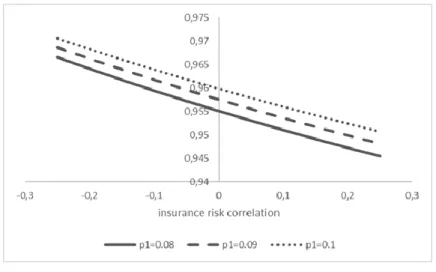
Figure 1 illustrates market (external) beta values as a function of insurance risk correlation for selected insurance risk sizes (in case of p2=0.085, s=0.1, i1=0.01, i2=0.01, n1=85000, n2=85000, r3=0.011, σ3=0.15, ρ13=0.1, ρ23=0.1). In this example only those correlation values are taken into consideration (and illustrated by Figure 1) for which the correlation matrix has nonnegative eigenvalues (in case of a correlation matrix with three variables two correlation values in the matrix define the maximum and minimum possible values for the third correlation value).
Figure 1. Market beta values Source: own calculations
Figure 1 demonstrates that an increasing correlation between insurance risks results in a lower market beta for all examined insurance risk sizes. This result can be interpreted so that if insurance risks are more correlated, then the examined insurance company is less sensitive to changes in the market return. In addition to this, if the correlation between insurance risks changes, the composition of the market portfolio also may change, thus the correlation can theoretically influence those investor decisions that are related to market beta values.
The internal beta values can also change as a result of correlation changes. Figure 2 illustrates (for correlation matrices with nonnegative eigenvalues, in case of p2=0.085, s=0.1, i1=0.01, i2=0.01, n1=85000, n2=85000, r3=0.011, σ3=0.15, ρ13=0.1, ρ23=0.1) that it depends on the size of the insurance risk (and the relation of insurance risk sizes in the two insurance company) in which direction the internal beta changes. If the insurance risk size in one of the insurers is lower than the other insurance risk size (that is measured by the insurance event occurrence probability in the model), then an increasing correlation results in an increasing internal beta. This result can be interpreted so that in this case a larger part of the capital requirement can be allocated to the insurance company with the lower insurance risk size. It is worth emphasizing that Figure 2 illustrates results that are related to relatively low insurance risk sizes, the results may also be influenced by this assumption.
Figure 2. Internal beta values Source: own calculations
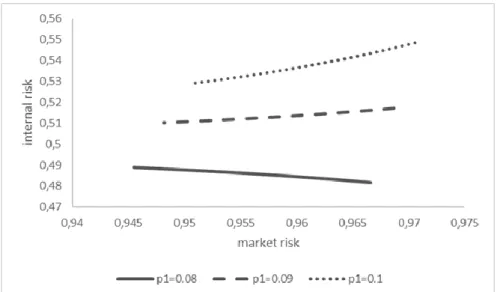
It is also possible to examine the relationship of market (external) and internal beta values.
Figure 3 shows summarized results illustrated by Figure 1 and Figure 2 (for correlation matrices with nonnegative eigenvalues, in case of p2=0.085, s=0.1, i1=0.01, i2=0.01, n1=85000, n2=85000, r3=0.011, σ3=0.15, ρ13=0.1, ρ23=0.1). On Figure 3, the market risk corresponds to the market beta value that is described by Equation (5), while the internal risk shows the internal beta values that are defined by Equation (3).
Figure 3. Relationship between market risk and internal risk Source: own calculations
Figure 3 shows that an increase in the market risk (as a result of a change in the correlation) may be accompanied by a decreasing or increasing internal risk. In the example illustrated by Figure 3 if the size of the insurance risk of the insurance company is higher than that of the other insurance company, then an increase in the correlation decreases both market risk and internal risk, in this case the return of the insurance company is less sensitive to the changes in market risk and a smaller part of the capital requirement can be attributed to the insurer during the capital allocation. In the presented example, if the size of the insurance risk of the insurer (the insurance event occurrence probability) is smaller than that of the other insurance company, then a smaller sensitivity to market risk (indicated by a smaller market beta) is accompanied by a higher internal beta (indicating that a larger part of the total capital requirement can be allocated to that insurance company).
5 Conclusions
Risk is a fundamental element in insurance business, and its aspects can be measured in several ways. In this paper the interactions between the „classical” insurance risk, the overall external (market) risk of insurance companies, and the internal capital allocation have been studied.
The key research question of the paper is whether external (market) and internal risk measures depend similarly on insurance risk. This question has not yet been extensively studied in previous literature, and the paper aims at contributing to literature with theoretical results. Although in the paper only theoretical results are calculated, both capital allocation and market risk of insurers have significant practical relevance.
The market risk in the model is measured by the external (market) beta that is a key concept in the classical CAPM model, while the internal beta is associated with CVaR based economic capital allocation. In the theoretical model it is possible to derive closed-form solutions for both beta values, and the effects of insurance risk features can be studied. A higher market beta indicates higher market risk, while a higher internal beta signifies that a larger part of the capital requirement is attributable to the business unit, thus it can be considered as a measure of internal risk. Theoretical results suggest that for higher insurance risk correlation the change in market risk may be
accompanied by a similar or opposite change in the internal risk, and it depends on the size of insurance risk whether similarity of these changes can be observed. These results highlight that insurance portfolio composition can have far-reaching consequences, by having a theoretical effect not only on company-level performance measures but also on investor decisions.
In the interpretation of the theroretical results it should be taken into account that the presented model construction is relatively simple. Directions for future research include for example a more detailed modeling of the market for investments.
References
[1] Artzner, P., Delbaen, F., Eber, J., Heath, D. (1998): Coherent measures of risk. Available:
https://people.math.ethz.ch/~delbaen/ftp/preprints/CoherentMF.pdf.
[2] Ágoston, K. Cs. (2012): CVaR minimization by the SRA algorithm. Central European Journal of Operations Research Vol. 20, Issue 4, pp. 623-632.
[3] Bargès, M., Cossette, H., Marceau, É. (2009): TVaR-based capital allocation with copulas. Insurance: Mathematics and Economics 45, pp. 348-361.
[4] Cossette, H., Mailhot, M., Marceau, É. (2012): TVaR-based capital allocation for multivariate compound distributions with positive continuous claim amounts. Insurance: Mathematics and Economics 50, pp. 247-256.
[5] Csóka, P., Pintér, M. (2010): On the impossibility of fair risk allocation. Munich Personal RePEc Archive, MPRA Paper No. 26515
[6] Dhaene, J., Tsanakas, A., Valdez, E. A., Vanduffel, S. (2012): Optimal capital allocation principles. The Journal of Risk and Insurance, Vol. 79, No. 1., pp. 1-28.
[7] Dickson, D. C. M., Hardy, M. R., Waters, H. R. (2011): Actuarial mathematics for life contingent risks. Cambridge University Press
[8] Fama, E. F., French, K. R. (2004): The Capital Asset Pricing Model: theory and evidence. Journal of Economic Perspectives, Vol. 18. Nr. 3, pp. 25-46.
[9] Fama, E. F., French, K. R. (2015): A five-factor asset pricing model. Journal of Financial Economics 116, pp. 1-22.
[10] Froot, K. A., Stein, J. C. (1998): Risk management, capital budgeting, and capital structure policy for financial institutions: an integrated approach. Journal of Financial Economics 47, pp. 55-82.
[11] Gründl, H., Schmeiser, H. (2005): Capital allocation for insurance companies – what good is it? Working Papers on Risk Management and Insurance No. 3, University of St.Gallen
[12] Handa, P., Kothari, S. P., Wasley, C. (1989): The relation between the return interval and betas. Implications for the size effect. Journal of Financial Economics 23, pp. 79-100.
[13] Homburg, C., Scherpereel, P. (2008): How should the cost of joint risk capital be allocated for performance measurement? European Journal of Operational Research 187, pp. 208-227.
[14] Insurance Europe (2014): Why insurers differ from banks. Insurance Europe aisbl, Brussels. Available:
https://www.insuranceeurope.eu/sites/default/files/attachments/Why%20insurers%20differ%20from%20banks.pdf [15] Markowitz, H. (1952): Portfolio selection. The Journal of Finance, Vol. 7, No. 1., pp. 77-91.
[16] McNeil, A. J., Frey, R., Embrechts, P. (2005): Quantitative Risk Management: Concepts, Techniques and Tools.
Princeton University Press
[17] Maume-Deschamps, V., Rullière, D., Said, K. (2016): On a capital allocation by minimization of some risk indicators.
European Actuarial Journal Vol. 6, Issue 1, pp. 177-196.
[18] Lee, C., Chang, C., Arouri, M., Lee, C. (2016): Economic growth and insurance development: the role of institutional environments. Economic Modelling 59, pp. 361-369.
[19] Lee, C., Huang, W., Yin, C. (2013): The dynamic interactions among the stock, bond and insurance markets. North American Journal of Economics and Finance 26, pp. 28-52.
[20] Lee, C., Lee, C., Chiou, Y. (2017): Insurance activities, globalization, and economic growth: new methods, new evidence. Journal of International Financial Markets, Institutions & Money 51, pp. 155-170.
[21] Lintner, J. (1965): The valuation of risk assets and the selection of risky investments in stock portfolios and capital budgets. The Review of Economics and Statistics, Vol. 47, No. 1., pp. 13-37.
[22] Panjer, H. H. (2001): Measurement of risk, solvency requirements and allocation of capital within financial conglomerates. Available: https://www.soa.org/Files/Research/Projects/measurement_risk.pdf
[23] Rockafellar, R. T., Uryasev, S. (2002): Conditional value-at-risk for general loss distributions. Journal of Banking &
Finance 26, pp. 1443-1471.
[24] Sharpe, W. F. (1964): Capital asset prices: a theory of market equilibrium under conditions of risk. The Journal of Finance, Vol. 19, No. 3., pp. 425-442.
[25] Zaks, Y., Tsanakas, A. (2014): Optimal capital allocation in a hierarchical corporate structure. Insurance: Mathematics and Economics 56, pp. 48-55.