Estimation of Optical Properties in Postharvest and Processing Technology
László Baranyai
Corvinus University of Budapest Hungary1. Introduction
Non-destructive analysis and qualification methods are of great interest in agriculture, postharvest technology and food processing. Computer vision systems have the additional advantage that sensors do not touch the product and measurements can be performed from comfortable distance. Due to the recent developments in electronics, several commercial applications are already available for grading on the basis of visible attributes, near infrared (NIR) readings (GREEFA, The Netherlands; MAF Industries Inc., USA) and laser scattering (BEST NV, Belgium). Portable devices also exist providing optical quality assessment for flexible measurements and in vivo inspections (CP, Germany; Unitec S.p.A., Italy).
Information about interaction between light and biological tissue is essential in visual evaluation of fresh horticultural produces, raw materials and food, since optical signal is significantly affected by physical stage and valuable compounds of the tissue. Hidden physical damages in cucmber fruit, caused during harvest, transport and handling, were investigated in the spectral region of 950-1650 nm using hyperspectral imaging system (Ariana et al., 2006). Four specific wavelengths were selected for classification. The ratio of relative reflectances calculated as 988 nm to 1085 nm and the differences of this property obtained using 1346 nm and 1425 nm resulted in the highest classification rates. This study also confirmed that time plays very important role in qualification of perishable produces. Light transmittance through cucumbers in the range of 500-1000 nm was also investigated (Ariana &
Lu, 2010). Transmittance for internally defected pieces and pickles was found to be generally higher compared to normal cucumbers. The wavebands around 745, 765, 885 and 965 nm were selected for best detection accuracy (94.7%). Advanced statistical methods, such as partial least square discriminant analysis (PLSDA) and k-nearest neighbor (KNN) may utilize the whole transmitted spectra. The highest classification rates of 97.3% and 88% were reached using PLSDA and KNN, respectively. Besides detection of damages and mechanical injury, estimation of quality parameters is also important for prediction of shelf-life and grading.
Key quality attributes, mainly firmness and soluble solids content (SSC), were predicted for apple fruits based on multispectral imaging (Lu, 2004; Qing et al., 2007; 2008). Firmness and SSC were predicted for ’Red Delicious’ apples, using the ratio of backscattering profiles in the wavelength range of 680-1060 nm, with the standard error of prediction (SEP) 5.8 N and 0.78%, respectively (Lu, 2004). Four specific wavelengths (680, 880, 905, and 940 nm) were selected for firmness and three (880, 905 and 940 nm) for SSC prediction. The size of the diffusively illuminated surface area and statistical description of the acquired
spatial intensity were used in prediction of firmness and SSC of ’Elstar’ and ’Pinova’ apples (Qing et al., 2007). Five selected wavelengths (680, 780, 880, 940 and 980 nm) resulted in SEP<13% in inter-cultivar validation. The distribution of measured surface intensity resulted in higher prediction accuracy than the size of the illuminated surface area. Additionally, the inter-cultivar validation on ’Pinova’ apples confirmed the finding that fruit flesh firmness can be measured in parallel with fruit SSC. The results of this study also pointed out that surface curvature had significant effect on observed intensity. The apple fruit response to drought stress was also evaluated on ’Elstar’ and ’Pinova’ samples (Qing et al., 2008). Validation of the prediction model showed good agreement between predicted and reference values, SEP<10%
for SSC and SEP<9% for firmness. According to the results, 12-13% effect of drought stress was observed compared to the sufficiently irrigated samples. Blue laser (408 nm) induced chlorophyll fluorescence was evaluated on ’Golden Delicious’ apples (Noh & Lu, 2007). Fruit firmness, SSC, titratable acid content, skin and flesh color (chroma and hue) were predicted.
Very good validation results were obtained for apple skin hue with the correlation coefficient of prediction of 0.94. Relatively good scores were obtained for fruit firmness, skin chroma, and flesh hue with correlation coefficients r≥0.74. The effect of processing technology on light-tissue interaction in banana slices was analyzed (Romano et.al, 2008). Three different drying temperatures were adjusted (53, 58 and 63◦C) and a laser light source emitting at 670 nm was used. The gradient of the collected intensity profiles was observed to move closer to the incident point. Based on the extracted parameters, fresh and dry banana slices were distinguished with 100, 98 and 97.33% accuracy for 53, 58 and 63◦C, respectively. The estimation of drying time resulted in 78.19, 75.76 and 73.33% for 53, 58 and 63◦C, respectively.
Tomato was also investigated using laser-scattering imaging (Tu et al., 2000). Low power (3 mW) laser module emitting at 670 nm was used to study the correlation between maturity, firmness and scattering. The total illuminated area correlated with acoustic firmness (r≈0.787).
This study also mention potential affecting factors such as fruit size and shape irregularities.
This chapter would like to present practical applications of diffuse reflectance imaging technique, also called backscattering imaging, supported by Monte Carlo simulation. This type of simulation provides detailed information about the sensitivity of measured data to changes in fruit and vegetable tissue, environmental conditions, processing technology.
The field of postharvest technology and process engineering requires sophisticated models taking several aspects into account, such as surface curvature, skin layer, measurement setup.
Combination of experimental and simulation results help building models for prediction purposes.
2. Materials and methods 2.1 Effect of surface curvature
Reference methods and code libraries for Monte Carlo simulation (Wang et al., 1995) use planar surfaces and layers. Horticultural produces and foodstuff usually have more complex surface. In order to obtain realistic intensity values close to the in vivo readings, shape and location dependent correction is recommended during data post-processing. The Lambertian cosine correction is commonly applied for spherical shape and circular cross section (Kortüm, 1969; Qing et al., 2007). This approach assumes that camera is placed right above the sample and the vertical reflection is collected.
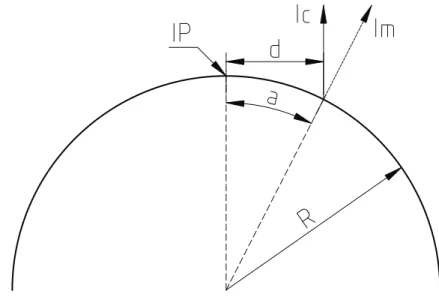
Ic=Im·cos(a) = Im
√R2−d2
R (1)
Correction formula is explained by Fig. 1, wheredmeans the observed distance between the selected location (Ic) and incident point (IP),Rmeans the radius of the fruit,a means the central angle between incident and exit points,Imis the intensity calculated for the specified location by simulation. According to the geometry, Equation 1 can be used to transform simulation result (Im) to acquired intensity (Ic).
Fig. 1. Geometry for Lambertian cosine correction
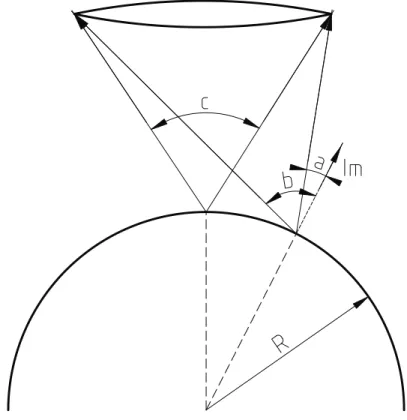
More sophisticated correction formula was recently introduced on the basis of acceptance angle of the optical system (Lu, 2009; Lu & Peng, 2007; Peng & Lu, 2008). Figure 2 shows the main concept of this computation. The observed intensity may be calculated by integration of reflectance (R(r)) over the acceptance angle (b−a) of the zoom lens.
R(r) =b
a ImdScos2ΘdΘ=ImdS b
2+sin2b 4
− a
2+sin2a 4
(2) A correction factor can be used to normalize integration to the range of−c/2 toc/2. Equation 3 shows the normalized calculation.
R(r) =c/2
−c/2ImdScos2ΘdΘ=ImdS c
2+sinc 2
(3)
2.2 Incident light beam
Light sources may be very different according to the applied system. Hyperspectral, multispectral or monochrome assembly require different hardware and wavelength ranges.
Power regulation of lamps and laser diodes is essential. Halogen lamps are typically used in hyperspectral systems (Ariana & Lu, 2010) and their beam is focused on one point or line of the surface. Laser light diodes are typically used in multispectral systems (Baranyai & Zude, 2008; Qing et al., 2007; 2008). Laser beams could be also focused on one selected point or line
Fig. 2. Intensity correction using acceptance angle
but quality laser modules are collimated and the default size may be sufficient for practical purposes. The diameter of the incident light beam and the power distribution within its cross section affects the calculated launch position of the photon packages (Jacques, 1998; Wang et al., 1997). In the simplest case, uniform power distribution is assumed over the circular cross section. Equation 4 shows that a uniformly distributed random number (ξ) can be expressed by an integral function based on the launch position (r) and beam radius (b).
ξ=r
0 p(r)dr=r
0
2πr πb2dr= r2
b2 (4)
Simulations usually assume that photon packages arrive perpendicular to the surface (0◦ direction). Direction of the incident ray and the refractive index of the tissue affect the amount of photons reflected back from the surface. This reflection depends on the polarization of light (s- or p-polarized). Equation 5 shows the calculation of reflection coefficients based on the refractive indices (n1andn2), incident angle (Θi) and travel direction in tissue (Θt).
Rs=
n1cosΘi−n2cosΘt
n1cosΘi+n2cosΘt 2
Rp=
n1cosΘt−n2cosΘi n1cosΘt+n2cosΘi
2
(5) Direct reflection from sample surface should be minimal, so that most of the photon packages can enter into the fruit tissue. Reflection coefficients for boundary of air and fruit tissue are
shown in Fig. 3. Type of polarization is usually unknown, especially due to the interaction between photon and biological tissue, therefore average value of Rs and Rp is commonly used (Wang et al., 1995). According to the close values ofRsandRp, the range below 20◦is recommended for incident light beam setup. Since the acquisition device is placed above the sample at 0◦direction, the minimum incident angle should be also calculated to avoid direct reflection into the front lens.
0 20 40 60 80
020406080100
Incident angle, deg
Reflection of light, %
Rp Rs
(a) Reflected amount of incident light
0 20 40 60 80
020406080100
Incident angle, deg
Reflection of light, %
Rp Rs
(b) Amount of light reflected back into tissue Fig. 3. Reflection of s-polarized (Rs) and p-polarized (Rp) photon packages entering (a) and leaving (b) fruit tissue of n=1.35. Average values are connected with line.
2.3 Evaluation of intensity profile
The observed intensity profile, also called backscattering profile, is calculated with radial averaging relative to the incident point. The typical logistic shape of this profile is analyzed in order to extract information about optical properties and quality. Due to the time consuming computation of Monte Carlo simulation, its primary role in agriculture and food science is to help construction and validation of inverse models used to estimate optical properties of biological tissues.
Intensity profiles can be evaluated with curve fitting of the diffusion theory model (Qin &
Lu, 2008; 2009). Diffusion equation was validated for scattering dominant materials, where scattering coefficient is larger than absorption coefficient (μs μa). Equation 6 shows the model used to describe diffuse reflectance (Rf(r)) measured on the surface atrdistance from incident point:
Rf(r) = 4πa
1 μt
μe+ 1
r1
exp(−μer1) r21 +
1 μt +3μ4A
t
μe+ 1 r2
exp(−μer2) r22
(6) whereμais the absorption coefficient,μsis the reduced scattering coefficient,ais the transport albedo (a=μs/(μa+μs)),μeis the effective attenuation coefficient (μe= [3μa(μa+μs)]1/2) andμt is the total attenuation coefficient (μt = μa+μs). Values ofr1 andr2 are calculated using Equation 7:
r1=μ1
t
2 +r2
1/2
r2=μ1
t
+3μ4A
t
2 +r2
1/2
(7) whereAis the internal reflection coefficient of the tissue determined from refractive indices.
This approach was successfully used to estimate the reduced scattering coefficient (μs)
and absorption coefficient (μa) for several types of fruits and vegetables (apple cultivars, cucumber, kiwifruit, peach, pear, plum, tomato, zucchini squash) within the wavelength range of 500-1000 nm (Qin & Lu, 2008).
Modified Lorentzian distribution functions (10 types) were tested for describing scattering intensity profile of ’Golden Delicious’ apple fruit (Peng & Lu, 2008). The function introduced by Equation 8 was found to be the most appropriate for prediction of both firmness and SSC:
R= b
1+z/cd (8)
wherebis the peak value of the profile,zis the scattering distance,cis the full scattering width at half maximal peak value (FWHM) anddis the slope around FWHM. This function (Eq. 8) resulted in good prediction of apple fruit firmness with r=0.894 and SEP=6.14 N, and of SSC with r=0.883 and SEP=0.73%.
First order descriptive parameters, such as FWHM, slope and distance between incident and inflection points, were used to monitor changes in fruit tissue (apple, banana, kiwifruit) (Baranyai & Zude, 2008; 2009; Romano et.al, 2008). Sensitivity of the intensity profile to the changes in absorption, scattering coefficients and anisotropy factor (g) was evaluated and anisotropy factor was found to be the most dominant parameter in case of apple and kiwifruit (Baranyai & Zude, 2008; 2009). The anisotropy factor was taken into account with the Heyney-Greenstein phase function (Jacques, 1998) instead of the approach of the reduced scattering coefficient (μs= [1−g]μs). The effect of anisotropy factor appeared as rotation of the logarithmic profiles as it is shown on Fig. 4.
0.0 0.5 1.0 1.5 2.0
1e−061e−041e−021e+001e+02
Radial distance, cm
Estimated photon flux, 1/cm2
g=0.0
g=0.9
Fig. 4. Rotation of intensity profiles for apple (μa=0.22,μs=30, n=1.35)
The sensitivity was tested with ANOVA method. The statistical effect, Fisher score, of factors μa,μs and g was also investigated in the range of g=0.5-0.9 within±10% range around the selected values. Figure 5 shows the statistical effect of optical parameters on the shape of
intensity profile. The observed statistical power of optical properties exponentially increased with increasing value of anisotropy factor. Anisotropy factor was found to be the most important contributing attribute provided that g>0.55.
0.5 0.6 0.7 0.8 0.9
1e−011e+001e+011e+021e+03
Anisotropy factor (g)
Statistical effect
Fig. 5. Statistical effect of optical propertiesμa(+),μs() and g (◦) on the shape of intensity profile
Based on the observed rotation, trigonometric function (Eq. 9) was selected to describe relationship between slope of the logarithmic profile (s) and anisotropy factor (g). Both determination coefficient (r2=0.9996) and Durbin-Watson autocorrelation test (D=2.1255) results were the best for this type of trigonometric function among exponential and polynomial functions.
s=a+b·tan(gπ/c) (9)
The inverse function was successfully applied to estimate anisotropy factor for kiwifruits of different commercial grades and classify them based on this property. Significant difference (p<0.01) was found between commercial grades of ripe and overripe kiwifruit (Baranyai &
Zude, 2009). However, commercial grade of unripe pieces overlapped others and statistical tests were unable to distinguish this class due to the high variance. The gradient was also found to change significantly for ’Idared’ apples (p<0.1) and the backscattering area for
’Golden Delicious’ apples (p<0.05) measured at 670 nm after bruising (Baranyai & Zude, 2008).
3. Case studies
3.1 Controlled atmosphere cool storage of apples
Apple fruits (Malus×domestica ’Elstar’ and ’Pinova’) have been harvested in the orchard near Glindow (Germany). The middle of the field was located at latitude 52N 22’ 14.96"
and longitude 12E 52’ 22.69". The selected area of 25×150 m had North-West to South-East
orientation and was split into upper and lower part according to the altitude. The upper part was suffering drought stress and both trees and fruits were obviously smaller. Harvested fruits were classified into the commercial grades of unripe, ripe and overripe according to the chlorophyll degradation (Fig. 6). Classes were well separated and no significant tendency was observed during storage. Harvested fruits were transferred into the storage facility immediately. Separate chambers were provided for apples of the same ripeness stage and cultivar. Temperature was adjusted to 2◦C. The atmosphere inside chambers consisted of 2%
CO2and 1.5% O2. This controlled atmosphere cool storage started in August 2008 and took 157 and 164 days for ‘Elstar’ and ‘Pinova’, respectively. The continuous storage was broken for a few minutes in order to perform the measurements.
0 50 100 150
0.20.40.60.81.0
Storage time, day
Chlorophyll red−edge
Elstar, upper
0 50 100 150
0.20.40.60.81.0
Storage time, day
Chlorophyll red−edge
Elstar, lower
0 50 100 150
0.20.40.60.81.0
Storage time, day
Chlorophyll red−edge
Pinova, upper
0 50 100 150
0.20.40.60.81.0
Storage time, day
Chlorophyll red−edge
Pinova, lower
Fig. 6. Chlorophyll red-edge mean values of grades unripe (green), ripe (red) and overripe (blue) with 95% confidence intervals for apple cultivars (rows) and drought stress (column) Digital images of 720×576 pixel size and 0.1694 mm/pixel resolution were acquired.
Measurements took place in a darkroom in order to maximize signal to noise ratio. The vision system was consisted of a monochrome camera (JAI A50IR CCIR, JAI, Denmark), zoom lenses (model H6Z810, PENTAX Europe GmbH, Germany), external analog video converter (VRM AVC-1, Stemmer Imaging GmbH, Germany) and a laser module (LPM785-45C, Newport Corp., USA) emitting at 785 nm with 45 mW power. The laser module was aligned with 7◦ incident angle. The acquisition process was controlled by LabView 8.6 PDS software (National Instruments, USA) extended with a dynamic library of specific image processing functions.
The optical parameters of simulation were adjusted in a wide range ofμa= 0.004-0.63 cm−1 andμs= 3.2-35 cm−1. The size of the diffusively illuminated area at 50% peak intensity level showed good correlation with optical properties (Table 1). Reciprocal function fitted well to data points withr2=0.998. The root mean square error of prediction (RMSEP) was 0.37 cm−1 using 10% randomly selected data in 100 repetitions.
Correlation μa μs μt μe
Pearson (linear) -0.0475 -0.8645 -0.8653 -0.6828 Spearman (rank) -0.0393 -0.9990 -0.9996 -0.7354 Table 1. Correlation between optical parameters and FWHM
The gradient at the outline of the illuminated area did not change significantly during controlled atmosphere cool storage, estimated values for anisotropy factor (Eq. 9) changed in a narrow band, less, than 2.1%. This is in agreement with the observed chlorophyll red-edge readings presented in Figure 6.
0 50 100 150
6.57.58.59.5
Storage time, day
Total attenuation, 1/cm
Elstar, upper
0 50 100 150
6.57.58.59.5
Storage time, day
Total attenuation, 1/cm
Elstar, lower
0 50 100 150
6.57.58.59.5
Storage time, day
Total attenuation, 1/cm
Pinova, upper
0 50 100 150
6.57.58.59.5
Storage time, day
Total attenuation, 1/cm
Pinova, lower
Fig. 7. Mean values of estimated total attenuation coefficient with 95% confidence intervals for apple cultivars (rows) and drought stress (column)
The diffusively illuminated area decreased significantly during storage, approximately 2.3%
per month. Figure 7 presents changes of the estimated μt values during the experiment.
The increasing value of this property results in decreasing value of the diffusion coefficient (D ∼ 1/μt). Decreasing value of diffusion coefficient together with the slightly changing anisotropy factor may support the assumption that light penetration depth can also decrease during storage of apple fruit.
3.2 Drying of banana slices
Cavendish bananas (Musa × cavendishii L.), originated in Central America, were used in drying experiment (Romano et.al, 2008). Sound pieces free from any visual deffect were selected and stored for 24h at 13 ◦C and 82% relative humidity. Slices of 2.5-3.0 cm diameter and 1.0-1.3 cm thickness were prepared and placed on perforated steel trays. Three temperatures (53, 58 and 63 ◦C) and constant hot air velocity (0.75 m/s) were adjusted for 5h drying. The vision system was consisted of a laser diode emitting at 670 nm with
3 mW power (RS194-026, Global Laser Ltd., UK), a 3CCD digital camera (JVC KY-F50E, Victor Co., Japan) and grabber board (Optimas, Stemmer, Germany). The incident angle of 15◦was applied. The collected intensity profiles were observed to shift closer to the incident point without significant change in the gradient. The color index measured with colorimeter (CR-300, Minolta, Japan) was found to increase until 4h drying in agreement with observed changes in intensity profile. The statistical analysis pointed out that changing moisture content had significant effect on observed profile (F=421.02, p<2.2×10⁻¹⁶). It can be explained with reduced photon transport due to the increased optical density of shrunken tissue. Pearson correlation coefficient, calculated between backscattering area and moisture content, resulted in r2=0.7214, 0.71 and 0.6698 for 53, 58 and 63 ◦C, respectively. Laser light distribution responded sensitively to changing tissue absorption caused by enhanced browning at higher temperature (63◦C). Influence of colour changes was also investigated (Romano et.al, 2010).
Different pre-treatments were applied to minimize colour degradation: chilling (4◦C for 18h), soaking in ascorbic and citric acid (1 min in a solution of 0.2% of 1:1 mixture), dipping in distilled water (30 s immersion). Untreated slices were separated as control set. The CIE L*
parameter was the most sensitive to colour change among treatments. Data analysis pointed out that higher moisture content resulted in deeper light propagation inside tissue and the diffusively illuminated area was affected only by the moisture content. Pre-treatments did not have significant influence on backscattering readings.
4. Summary
Monte Carlo simulation was found to be an effective tool providing information on optical properties of fruit tissue and sensitivity of diffuse reflectance readings. Common simulation methods, such as MCML and CONV (Wang et al., 1995; 1997), should be changed slightly to build more accurate models compared to in vivo experiments. It was shown that surface curvature may affect observed intensity distribution and correction is required in post-processing. Direction of incident light beam seems to be optimal below 20◦incident angle where minimal reflection is expected from surface. However, incident angle should be large enough to avoid direct reflection into the front lens.
Curve fitting of the diffusion equation and modified Lorentzian distribution functions was found to be successful in estimation of optical properties, firmness and SSC of various fruits and vegetables. Investigation of the shape of the backscattering profile revealed an additional potential parameter, the anisotropy factor (g). Analysis of anisotropy factor found significant difference between commercial grades of kiwifruit and revealed effect of bruising in ’Idared’
apples. Long term monitoring of apple storage and banana drying experiments proved that backscattering imaging can be utilized in postharvest and processing technology as well.
5. Acknowledgements
The author wish to thank the Leibniz Institute of Agricultural Engineering Potsdam-Bornim e.V. (Germany) for help and the TÁMOP 4.2.1.B-09/1/KMR project for financial support.
6. References
Ariana, D.P. & Lu, R. (2010). Hyperspectral waveband selection for internal defect detection of pickling cucumbers and whole pickles.Computers and Electronics in Agriculture, Vol.
74, No. 1, October 2010, 137-144, ISSN 0168-1699
Ariana, D.P.; Lu, R.; Guyer, D.E. (2006). Near-infrared hyperspectral reflectance imaging for detection of bruises on pickling cucumbers.Computers and Electronics in Agriculture, Vol. 53, No. 1, April 2006, 60-70, ISSN 0168-1699
Baranyai, L. & Zude, M. (2008). Analysis of laser light migration in apple tissue by Monte Carlo simulation.Progress in Agricultural Engineering Sciences, Vol. 4, No. 1, December 2008, 45-59, ISSN 1786-335X
Baranyai, L. & Zude, M. (2009). Analysis of laser light propagation in kiwifruit using backscattering imaging and Monte Carlo simulation.Computers and Electronics in Agriculture, Vol. 69, No. 1, November 2009, 33-39, ISSN 0168-1699
Jacques, S.L. (1998). Light distributions from point, line and plane sources for photochemical reactions and fluorescence in turbid biological tissues. Photochemistry and Photobiology, Vol. 67, No. 1, 23–32, ISSN
Kortüm, G. (1969). Reflectance spectroscopy. Principles, methods, applications. Springer-Verlag, LCCCN: 79-86181
Lu, R. (2004). Multispectral imaging for predicting firmness and soluble solids content of apple fruit.Postharvest Biology and Technology, Vol. 31, No. 2, February 2004, 147-157, ISSN 0925-5214
Lu, R. (2009). Spectroscopic technique for measuring the texture of horticultural products:
spatially resolved approach, In:Optical monitoring of fresh and processed agricultural crops, Zude, M. (Ed.) 391-423, CRC Press, ISBN 978-1-4200-5402-6, Boca Raton, USA.
Lu, R. & Peng, Y. (2007). Development of a multispectral imaging prototype for real-time detection of apple fruit firmness.Optical Engineering, Vol. 46, No. 12, December 2007, 123201
Noh, H.K. & Lu, R. (2007). Hyperspectral laser-induced fluorescence imaging for assessing apple fruit quality.Postharvest Biology and Technology, Vol. 43, No. 2, February 2007, 193-201, ISSN 0925-5214
Peng, Y. & Lu, R. (2008). Analysis of spatially resolved hyperspectral scattering images for assessing apple fruit firmness and soluble solids content. Postharvest Biology and Technology, Vol. 48, No. 1, April 2008, 52-62, ISSN 0925-5214
Qin, J. & Lu, R. (2008). Measurement of the optical properties of fruits and vegetables using spatially resolved hyperspectral diffuse reflectance imaging technique.Postharvest Biology and Technology, Vol. 49, No. 3, September 2008, 355-365, ISSN 0925-5214 Qin, J. & Lu, R. (2009). Monte Carlo simulation for quantification of light transport features
in apples.Computers and Electronics in Agriculture, Vol. 68, No. 1, August 2009, 44-51, ISSN 0168-1699
Qing, Z.; Ji, B.; Zude, M. (2007). Predicting soluble solid content and firmness in apple fruit by means of laser light backscattering image analysis.Journal of Food Engineering, Vol.
82, No.1 , September 2007, 58-67, ISSN 0260-8774
Qing, Z.; Ji, B.; Zude, M. (2008). Non-destructive analyses of apple quality parameters by means of laser-induced light backscattering imaging. Postharvest Biology and Technology, Vol. 48, No. 2, May 2008, 215-222, ISSN 0925-5214
Romano, G.; Argyropoulos, D.; Gottschalk, K.; Cerruto, E.; Müller, J. (2010). Influence of colour changes and moisture content during banana drying on laser backscattering.
International Journal of Agricultural and Biological Engineering, Vol. 3, No. 2, June 2010, 46-51, ISSN 1934-6344
Romano, G.; Baranyai, L.; Gottschalk, K.; Zude, M. (2008). An approach for monitoring the moisture content changes of drying banana slices with laser light backscattering
imaging.Food and Bioprocess Technology, Vol. 1, No. 4, December 2008, 410-414, ISSN 1935-5130
Tu, K.; Jancsók, P.; Nicolai, B.; De Baerdemaeker J. (2000). Use of laser-scattering imaging to study tomato-fruit quality in relation to acoustic and compression measurements.
International Journal of Food Science and Technology, Vol. 35, No. 5, October 2000, 503-510, ISSN 1365-2621
Wang, L.; Jacques, S.L.; Zheng, L. (1995). MCML - Monte Carlo modeling of light transport in multi-layered tissues.Computer Methods and Programs in Biomedicine, Vol. 47, No. 2, July 1995, 131-146, ISSN 0169-2607
Wang, L.; Jacques, S.L.; Zheng, L. (1997). Conv - convolution for responses to a finite diameter photon beam incident on multi-layered tissues.Computer Methods and Programs in Biomedicine, Vol. 54, No. 3, November 1997, 141-150, ISSN 0169-2607