Nanotechnology
PAPER • OPEN ACCESS
One-step fabrication of fiber optic SERS sensors via spark ablation
To cite this article: Attila Kohut et al 2021 Nanotechnology 32 395501
View the article online for updates and enhancements.
You may also like
Electrosynthesis and Simultaneously Performed In situ Impedance and UV-Vis- NIR Studies on Poly(3-Thiophene-Butyric- Acid)
Péter Tóth, Csaba Janáky, Emese Peintler-Kriván et al.
-
Determination of endogenous methane formation by photoacoustic spectroscopy E Tuboly, A Szabó, G Ers et al.
-
Composition-Dependent Optical and Photoelectrochemical Behavior of Antimony Oxide Iodides
Altantuya Ochirkhuyag, Ildikó Y. Tóth, Attila Kormányos et al.
-
This content was downloaded from IP address 193.224.205.229 on 02/12/2021 at 13:06
One-step fabrication of fi ber optic SERS sensors via spark ablation
Attila Kohut1,2 , Viktória Horváth1,2, Zsuzsanna Pápa4,5, Balázs Vajda1, Judit Kopniczky1, Gábor Galbács2,3and Zsolt Geretovszky1,2
1Department of Optics and Quantum Electronics, University of Szeged, Dóm sq. 9, 6720 Szeged, Hungary
2Department of Materials Science, Interdisciplinary Excellence Centre, University of Szeged, 6720 Szeged, Dugonics sq. 13, Hungary
3Department of Inorganic and Analytical Chemistry, University of Szeged, Dóm sq. 7, 6720 Szeged, Hungary
4Wigner Research Centre for Physics, Konkoly-Thege M. út 29-33, 1121 Budapest, Hungary
5ELI-ALPS Research Institute, ELI-HU Nonprofit Kft., Wolfgang Sandner u. 3, 6720 Szeged, Hungary E-mail:akohut@titan.physx.u-szeged.hu
Received 18 March 2021, revised 2 June 2021 Accepted for publication 17 June 2021 Published 6 July 2021
Abstract
Spark ablation, a versatile, gas-phase physical nanoparticle synthesis method was employed to fabricatefiber-optic surface enhanced Raman scattering(SERS)sensors in a simple single-step process. We demonstrate that spark-generated silver nanoparticles can be simply deposited onto afiber tip by means of a modified low-pressure inertial impactor, thus providing significant surface enhancement forfiber-based Raman measurements. The surface morphology of the produced sensors was characterized along with the estimation of the enhancement factor and the inter- and intra-experimental variation of the measured Raman spectrum as well as the investigation of the concentration dependence of the SERS signal. The electricfield enhancement over the deposited silver nanostructure was simulated in order to facilitate the better understanding of the performance of the fabricated SERS sensors. A potential application in the continuous monitoring of a target molecule was demonstrated on a simple model system.
Keywords: spark discharge nanoparticle generation, spark ablation, SERS,fiber optic sensor, silver nanoparticles, FDTD simulation
Introduction
Rapid development of optical fiber manufacturing technolo- gies allowed the development of various fiber optic probes and measurement systems. Opticalfiber-based systems have simple and compact design and due to theirflexibility they can also be employed for remote measurements, at hard-to- access locations, either outside the laboratory, or in vivo biomedical applications[1,2]. A well-established method for the detection of molecules is Raman spectroscopy, which is based on the detection and analysis of light inelastically scattered on a sample, directly representing its vibrational and
rotational energy levels [3]. Employing Raman spectroscopy via optical fibers is complicated by the fact that the fiber material, especially due to the long interaction length, gen- erates a considerable contribution to the Raman spectrum[4]. This is further complicated by the fact that Raman scattering itself has a very small cross section leading to rather poor signal-to-noise ratios in case of fiber optic Raman experi- ments. One way of increasing the intensity of the Raman signal is based on the so called surface enhanced Raman scattering(SERS), which exploits the so called chemical and the plasmonicfield enhancement occurring in the vicinity of a nanostructured - appropriate - metal surface [5]. Thus, an optical fiber equipped with a SERS-active structure on one end allows for spatially separating the monitored environment from the monitoring personnel and instrumentation, while maintaining a sufficiently high sensitivity. Such fiber optic SERS sensors have found many promising applications in the
Nanotechnology32(2021)395501(8pp) https://doi.org/10.1088/1361-6528/ac0c41
Original content from this work may be used under the terms of the Creative Commons Attribution 4.0 licence. Any further distribution of this work must maintain attribution to the author(s)and the title of the work, journal citation and DOI.
fields of biology, food science, detection of environmental pollutants, pharmaceutics or in vitro an in vivo biosensing [6–8]. One approach for creating a suitable surface for SERS on the tip of an optical fiber is based on microfabrication either by etching [9, 10], lithography [11, 12], or e.g. pho- topolymerization [13] followed by the homogenous deposi- tion of a metallic layer onto the structure. The other main approach relies on the preparation of a nanostructured metallic layer on the fiber tip. Nanoparticles (NPs) can be grown directly on the fiber tip via e.g. photoreduction [14–16], or synthesized via e.g. the well-known Lee–Meisel method [17]and deposited on the fiber tip in a second step [18,19]. Both of the above mentioned approaches have their limitation either regarding the complexity of the fabrication method or by the purity of the formed structure[13]. As for the cleanliness of the surface, gas-phase, physical NP synth- esis methods can provide real alternatives to chemical routes as they are able to omit the use of different reagents and solvents from the process[20]. A prominent example is spark ablation, which relies on the electrical plasma-based atomi- zation of bulk electrodes in a controlled gaseous environment, thus being able to provide exceptionally pure particles[21]. Moreover, spark-based NP synthesis is technically simple and straightforward. It has recently been shown that spark ablation can be used to fabricate versatile SERS substrates both from pure Ag NPs [22] and Au/Ag binaries with continuously tunable enhancement [23]. In the present study we demon- strate that spark-generated Ag NPs can be deposited onto the tip of an optical fiber by using a modified low-pressure inertial impactor and thus SERS sensors can be fabricated in a facile and straightforward way, thus providing a reasonable platform for simple and low-cost Raman-based sensing applications. The surface morphology of thefibers as well as the effect of particle deposition time and analyte concentra- tion on the SERS performance are discussed along with the reproducibility and enhancement factor. The electric field enhancement over the deposited Ag nanostructure was simulated by finite-difference time-domain (FDTD) method for better understanding the effect of experimental factors on the performance of the sensors. The potential applicability of the fabricated SERS sensors in the continuous monitoring and detection of a target molecule has been demonstrated on a simple model system.
Method
The spark ablation setup—referred to as spark discharge NP generator, or SDG—used in the present experiment has been described elsewhere [23], therefore we only give a brief overview of the relevant parameters here. Ag NPs were generated by sparking between two axially aligned Ag elec- trodes (3.0 mm diameter, 99.9% purity, Goodfellow Cam- bridge Ltd) placed 2.0 mm apart in a gas-tight chamber operated slightly above atmospheric pressure. Sparking was maintained by continuously charging and discharging an 8 nF capacitor(450PM980, General Atomics Inc.)with a repetition rate of 100 Hz. Argon(99.996% purity, Messer Hungarogáz
Kft.) was used as carrier gas to quench the atomic vapor generated by the spark plasma and to carry away the NPs formed. In order to deposit the Ag NPs dispersed in the Ar gas onto the tip of an optical fiber, a modified low-pressure impactor(LPI)was used. LPIs are based on the inertia of the particles which can exceed the drag force of the gas at suf- ficiently low pressures. They are often used to sample gas- borne NPs, usually employing small, planar substrates such as transmission electron microscopy grids or adhesive tapes [24, 25]. For adapting the concept of inertial particle deposition to optical fibers, we have built a modified LPI, being able to encase a fiber with proper positioning while maintaining the low pressure inside the LPI chamber. This is schematically shown in figure 1 along with the generation scheme. The optical fiber—without connectors and jacket— enters the LPI chamber via an 8 mm outer diameter plastic tube through a vacuum feedthrough connected to a custom- made fiber holder. The fiber holder is housing afiber optic ferrule with an inner diameter of 400 μm. This element is responsible for centering the fiber and holding it in place.
Once aligned, thefiber can befixed in the holder by a plastic screw. For maintaining the tightness of the system, the other end of the inlet tubing is sealed with an element made of standard vacuum components.
Multimode, silica fibers were used in the experiments with a core/cladding diameter of 200/220 μm and NA of 0.22 (FG200LEA, Thorlabs Inc.) with a length of about 50–60 cm. The coating was stripped from one of the fiber ends and it was cleaved before the deposition process by using an automaticfiber cleaver (CT105, Fujikura Ltd). The coating-free, cleaved section of thefiber was 10 mm long in every experiment. No further preparation of thefiber surface was carried out prior to particle deposition. Thefiber tip was exposed to the particle-laden gas stream for a couple of minutes(typically in the range of 2–30 min), after which the other, intact end of thefiber was also cleaved before testing the SERS performance. None of the fiber ends were con- nectorized or otherwise prepared before SERS measurements, thus ensuring simple and low-cost fabrication. Testing of the fiber optic sensors was carried out in the so called optrode geometry (seefigure 1), i.e. both the exciting 785 nm laser light and the Raman signal was transmitted through the same fiber coupled to a home-built Raman spectrometer system (laser: LASER-785-LAB-FC, spectrometer: QE65000, both Ocean Optics Inc.). The performance of the sensors was assessed by measuring the Raman spectrum of Rhodamine 6G (R6G) dissolved in water, having a concentration in the range of 10 nm–1 mM. The spectrum of the opticalfiber, i.e.
the measurement background was acquired by dipping it into pure water. The Raman spectrum was both measured when the fiber was in the solution and in air after dipping and drying the analyte on thefiber tip. The power of the Raman laser coupled to the probe was 3.2 mW, only a fraction of which could transmit through the silver structure and interact with the analyte, depending on the deposition condition(see in the next chapter). The spectra were acquired for 10 s without averaging. The morphology of the nanostructured probe surface was investigated by atomic force microscopy
2
Nanotechnology32(2021)395501 A Kohutet al
(AFM, XE-100, PSIA) and scanning electron microscopy (SEM, S-4700, Hitachi Ltd).
To investigate the possible field localization, the dis- tribution of the electric field along the surface of the nanos- tructured silver layer has to be calculated. For this purpose, we performed FDTD simulations with a commercially available software package(Lumerical FDTD Solutions). For being able to monitor thefield localization properties of the deposited nanostructures, AFM images recorded from the surface were directly introduced to the simulations. The simulated 3D unit cell(5μm×5μm×1μm)contained the nanostructured silver surface on top of a bulk fused silica substrate. The substrate was modeled with a constant refrac- tive index n=1.45. Optical data of silver was taken from literature[26]. For illumination, we used a plane wave source with 785 nm wavelength in a backside illumination geometry.
Distribution of the electricfield was monitored in the nearest mesh cells above the silver surface. The FDTD simulation parameters given above were set according to a strict conv- ergence check.
Results and discussion
The experimental setup described above and schematically depicted infigure1allowed for the direct deposition of spark- generated Ag NPs onto the tip of an opticalfiber. The time of particle deposition was arbitrarily set to 10 min, after which the SERS performance of thefiber was tested along with the characterization of thefiber tip exposed to the aerosol stream.
The Raman spectrum of R6G solution measured before and after particle deposition is shown infigure2. Please note that particles were always deposited onto a freshly cleaved surface.
It can be seen infigure2(A), that the reference spectrum measured with a barefiber, without NPs on the surface does not exhibit any of the characteristic peaks of R6G. Only the Raman spectrum of the silicafiber was visible which is not shown in this graph. After 10 min of Ag deposition thefiber
tip is fully covered with particles, as shown in the inset of figure 2(B), and the Raman peaks of R6G are clearly dis- cernible. In order to give an estimate on the SERS enhance- ment factor, the Raman spectrum of R6G must be measured without the presence of nanostructure, according to the well- known formula given in e.g.[27]. To this end, R6G solution with a concentration of 1 M and a freshly cleaved opticalfiber was used. At these conditions, the spectrum was heavily affected by fluorescence, but the peak intensity of the 1506 cm−1line could be deduced. By comparing this value with the corresponding SERS intensity measured at 1 μM R6G concentration (seefigure 2(B))an enhancement factor of ca.
5×10⁴was obtained. The value is even higher when the so- called dip-and-dry technique is used. Such an enhancement favorably compares to the values given in the literature for differentfiber optic SERS probes, typically ranging from 103 to 105[13,28,29]. In order to examine the intensity-stability of the prepared fibers, we recorded the variation of the R6G spectrum—both in solution and with the dip-and-dry method
—for 45 min. The relative root mean square deviation of the intensity of the 1506 cm−1 R6G line, characteristic to the intra-experimental variation was obtained to be less than 15%
for measurements in solution and less than 5% for the dip- and-dry method, indicating very good intensity stability dur- ing a measurement.
It is suggested by the optical micrograph shown in the inset offigure2(B)that Ag NPs uniformly cover thefiber tip.
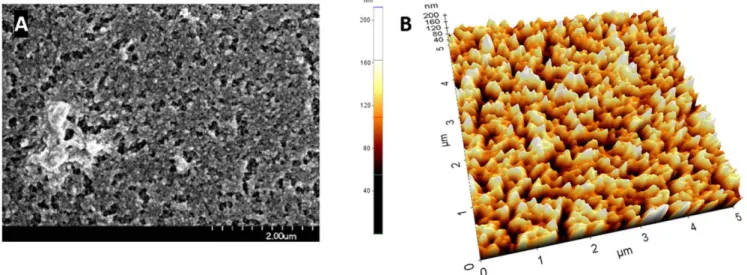
This is confirmed by the SEM measurements, shown in figure 3(A). A nanostructured silver layer is formed on the surface, with a typical particle size of ca. 40±5 nm, but much larger, micron-sized particles can also be found. It should be noted that under the experimental conditions used in the present study, spark ablation produces NP aggregates of a few tens of nanometers, consisting of primary particles with a typical diameter of only a few nanometers [30, 31]. Therefore, the particles seen in the SEM picture are repre- senting the Ag NP aggregates generated in our setup, which have an approx. 35 nm modal electrical mobility diameter, as measured by a scanning mobility particle sizer. In order to
Figure 1.Schematic experimental setup for particle deposition and Raman measurements.
characterize the roughness of the spark-produced nanos- tructure on thefiber tip, the AFM mapping of the surface was also carried out. The surface topography can be seen in figure 3, upon which an average roughness of 23 nm was determined. By calculating the surface area of the nanos- tructure from AFM traces carried out at different locations over thefiber tip, the total increase of the surface of thefiber end was estimated. This resulted in a less than 10% surface increase due to the Ag deposition, which proves that the enhancement factor given above can indeed be attributed to the SERS effect.
AFM measurement data shown infigure 3(B)were also used as input for the FDTD simulation of the electric field enhancement over the Ag nanostructure. As shown in figure4(A), the overall electricfield enhancement is quite low over the surface, there are smaller ‘islands’ where the enhancement factor is above 2. If we take a closer look on one of these islands, enhancement factors as high as 50 can be found, as exemplified in figure 4(B). When comparing this
region with the respective AFM profile(figure4(C)), one can conclude that the higher enhancement correlates not only with the presences of particle gaps but with small thickness of the structure as well. This is probably due to the backside illu- mination geometry, i.e. that the laser light is directed through the Ag structure before reaching its surface. Please note that the values shown in figure 4 represent the electric field enhancement factor, from which the SERS enhancement can be obtained by employing the generally used E4 approx- imation [32]. The peak enhancement corresponding to the area shown infigure4(B)is ca. 6×10⁶but typical values at most regions of the structure are much lower. By calculating the SERS enhancement at every point of the surface the average enhancement factor was estimated to be around 2×10² in the investigated area. Since it is not realistic to simulate the electric enhancement over the whole fiber tip, such a value remains a rough estimate of the total electro- magnetic enhancement, because the existence of a few hot spots could significantly contribute to the average
Figure 2.Reference Raman spectrum of 1 mM concentration R6G solution measured by using a bare opticalfiber(A), and the Raman spectrum of 1μM concentration R6G solution measured by an opticalfiber covered with spark-generated Ag NPs(B). The spectra are corrected for baseline. The optical micrograph of thefiber tip is shown in the insets for both cases.
Figure 3.Surface morphology(A)and topography(B)of the Ag nanostructure deposited onto thefiber tip based on SEM and AFM measurements, respectively.
4
Nanotechnology32(2021)395501 A Kohutet al
enhancement. Nevertheless, considering that a total enhancement factor of ca. 5×10⁴ was experimentally determined, this suggests that the chemical enhancement is approx. 2×10², which agrees well with the typical literature value[33].
FDTD simulation results shown infigure4indicates that besides the well-known significance of hot spot formation, the thickness of the nanostructure also plays an important role in the overall performance of the fabricated SERS sensors. In order to investigate this effect from a practical point of view of sensor fabrication, we used the‘transmission’of the sensor as a cumulative parameter affected by both the porosity, thickness, and surface coverage of the deposited nanos- tructure. It should be noted that such an indirect parameter is naturally unable to grasp every important aspect of SERS enhancement—such as exact surface morphology—but as will be shown below, it is still useful in the assessment of the performance offiber optic SERS sensors. The transmission is defined as the ratio of the laser power going through the Ag- covered fiber and the maximum laser power transmittable through an identical referencefiber without nanostructure. By varying the deposition time, we have fabricated Ag-covered fibers with different transmission and measured their perfor- mance both in solution and with the dip-and-dry method. The variation of the intensity of the 1506 cm−1peak of R6G as a function of the transmission—measured at the 785 nm wavelength of the laser used in the Raman measurements—is shown infigure5. It can be seen that the SERS intensity of the selected peak—correlating with the enhancement of the Ag structure—increases with increasing transmission until reaching an optimum around 30%–40%, which is followed by a gradual decrease. In our view, this behavior qualitatively explainable by the same considerations concluded from FDTD simulations above. When the transmission is high, the thickness of the nanostructure and/or the surface coverage is
low, hindering hot spot formation and resulting in weak overall enhancement. By depositing more particles, a higher coverage can be achieved also promoting the formation of hot spots in small NP gaps, which results in increasing enhancement eventually reaching a point when the thickness of the structure and hence the transmission is so low that the laser light can barely excite the surface plasmons and interact with the analyte molecules, hence producing a low SERS signal. Figure 5 indicates that the enhancement varies by a factor of ca. 1.7 in the approx. 15%–50% transmission range, i.e. between the very low or high transmission regions. It can also be seen in figure 4 that the measured Raman intensity scatters in the ±20% of the fitted intensity-transmission curve, indicating the reproducibility of thefiber-optic SERS
Figure 4.FDTD simulation of the electricfield enhancement over a characteristic surface region of the Ag nanostructure of thefiber optic SERS sensor(A)and close-up of a region exhibiting relatively high electricfield enhancement factors(B)together with the AFM profile of the same area(C).
Figure 5.Intensity of the 1506 cm−1R6G Raman peak as a function of the transmission measured in solution of 1 mM concentration (black)and with the dip-and-dry method(red). Please note that the total line intensity, i.e. the integral of the line profile is shown in the vertical axis.
probes’ performance at a given transmission. It should be noted that this is a composite value, incorporating both the fabrication and the measurement process. Considering the technical challenges potentially affecting the measurement— especially through thefiber coupling—this is considered to be a good reproducibility. It should also be added that the main field of application offiber optic SERS probes is sensing or qualitative monitoring, rather than quantitative analytical analysis. This means that even a bigger variation in the enhancement factor might be acceptable as long as the enhancement is still high enough for detecting the desired molecule. As can be seen in figure 5, the FWHM of the curves is about 35%, which means that considerable enhancement can be achieved in a relatively broad exper- imental range, proving the robustness of the present fabrica- tion method. Nevertheless, in order to investigate the dependence of the SERS signal on the concentration of the analyte—and hence assessing the potential applicability of the present fiber optic SERS sensors in quantitative measure- ments—systematic measurements were carried out at varying R6G concentrations. To this end, SERS sensors were fabri- cated ensuring that their transmission always stays within the optimal 15%–50% range(seefigure5).
As can be seen infigure6(A), the SERS signal increases monotonically with increasing concentration in the 10 nM– 100 μM concentration range. On a logarithmic scale, the concentration dependence of the intensity can be reasonably well described by a linear relationship, opening up the pos- sibility of calibrated measurements as well. In solution, the detection limit is around 10 nM, at which concentration the signal-to-noise ratio decreased significantly, as shown in figure 6(B). Using the dip-and-dry method the measured intensities are consistently higher, indicating that even lower concentrations could be detectable.
SERS was shown to have promising applications in the field of biosensing [7], where the use of fiber optic SERS platforms would be an organic step towards successfulin vivo measurements. In one potential applicationfiber optic SERS
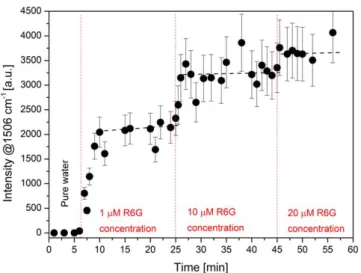
sensors could be employed to detect a specific marker molecule. In such a case, it is crucial for the applied sensor to be operational in a liquid medium for a prolonged time and also to be able to detect the potential concentration variation of the target analyte—at least qualitatively. As a proof of concept, a simplified experiment was carried out to model a similar situation. To this end, a fabricated fiber optic SERS sensor was introduced to pure water(3 ml volume), while the Raman spectrum was continuously acquired at the distal end of the fiber. After a few minutes, a drop of 100 μM R6G solution(30μl volume)was added to the water. The addition of R6G was repeated two more times with volumes of 300μl of the same, 100 μM concentration. The variation of the intensity of the SERS signal measured at 1506 cm−1—i.e. at the most intense peak of R6G—is shown in figure7.
Although, the conditions here are much more ideal than that in a real, turbid biological environment, the results shown infigure7well exemplify that the fabricated SERS sensor is able to detect the appearance of an analyte, indicated by the sudden increase in the measured intensity (around 6 min in figure7). Moreover, the variation of the concentration of the analyte can also be monitored, as evidenced by the intensity changes correspond to the moments when more R6G was added to the solution. It can be seen in figure 7 that after adding R6G, the signal increases and in about 1 min the intensity clearly exceeds the typical intra-experimental var- iation, indicating a reasonable response time. Please also note that the intensities shown in figure 7 agree reasonably well with the values predicted by the concentration dependence measurements (see figure 6), which were performed with freshly prepared fibers at each concentration value. This suggests that the saturation of the surface structure is not dominant in the present concentration and time range. This experiment provides a simple yet demonstrative example of the potential lying infiber optic SERS sensors fabricated via spark ablation. Considering the nowadays readily available, tabletop SDGs [34, 35] and the inherent advantages of the
Figure 6.Variation of the SERS intensity measured at the 1506 cm−1line of R6G as a function of the concentration. Please note that the total line intensity, i.e. the integral of the line profile is shown in the vertical axis(A). Variation of the SERS spectra measured in solution at different R6G concentrations. The spectra are smoothed, baseline corrected and vertically shifted for better clarity(B).
6
Nanotechnology32(2021)395501 A Kohutet al
spark-based process, such as the facile composition-tuning of high purity binary NPs [23, 36–38], together with the sim- plicity of the process the fabrication technique proposed here might be capable for the production of tailored yet inexpen- sive disposable fiber optic SERS sensors for real-life applications.
Conclusions
In the present study, the single-step fabrication offiber-optic SERS sensors was demonstrated by depositing spark ablation- produced Ag NPs onto the tip of an optical fiber. The Ag particles produced in a spark discharge generator were directly deposited onto a freshly cleaved fiber tip with a modified low-pressure inertial impactor. The SERS perfor- mance of the as-preparedfibers were tested by measuring the Raman spectrum of Rhodamine 6G both in solution and with the dip-and-dry method. It has been shown that the enhancement factor is in the order of 104, which is accom- panied by a 15% and 5% intra-experimental intensity varia- tion in solution and via dip-and-dry, respectively. The fabrication method is robust enough to maintain these values over a broad experimental range with a reproducibility better than 20%. By simulating the electricalfield enhancement over the surface of the sensors, the significance of the thickness of the deposited nanostructure was demonstrated. Based on the simulation results, a practical experimental parameter—the transmission of the SERS sensors—was used to optimize their performance. The applicability of the produced sensors in the monitoring of the appearance and concentration-variation of a specific molecule in a liquid medium was demonstrated by a model experiment. The dependence of the SERS signal on the analyte concentration was also experimentally determined, which indicates promising potential in calibrated
measurements. Our results prove that spark ablation is a promising method for fabricating simple and inexpensive yet effective and inherently tunablefiber-optic SERS probes that can be potentially applied in any applications where the fast detection and identification of specific molecules are targeted.
Acknowledgments
Research leading to these results has received funding from the National Research, Development and Innovation Office of Hungary through projects GINOP-2.3.2-15-2016-00036 and EFOP-3.6.2-16-2017-00005 and from the Ministry for Inno- vation and Technology of Hungary through the NKFIH-1279- 2/2020 TKP2020 program. One of the authors(A. Kohut)is also grateful for the support received from the NTP-NFTÖ- 19-B-0137 project and the ÚNKP-20-4—New National Excellence Program of the Ministry for Innovation and Technology from the source of the National Research, Development and Innovation Fund.
Data availability statement
The data that support the findings of this study are available upon reasonable request from the authors.
ORCID iDs
Attila Kohut https://orcid.org/0000-0003-4545-2943
References
[1] López-Higuera J M 2002Handbook of Optical Fibre Sensing Technology(New York: Wiley)
[2] Utzinger U and Richards-Kortum R R 2003 Fiber optic probes for biomedical optical spectroscopyJ. Biomed. Opt.8 121–47
[3] Smith E and Dent G 2005Modern Raman Spectroscopy: A Practical Approach(New York: Wiley)
[4] Santos L F, Wolthuis R, KoljenovićS, Almeida R M and Puppels G J 2005 Fiber-optic probes forin vivoRaman spectroscopy in the high-wavenumber regionAnal. Chem.
776747–52
[5] Langer Jet al2019 Present and future of surface-enhanced Raman scatteringACS Nano1428–117
[6] Wang C, Zeng L, Li Z and Li D 2017 Review of opticalfibre probes for enhanced Raman sensingJ. Raman Spectrosc.48 1040–55
[7] Bantz C K, Meyer F A, Wittenberg J N, Im H, KurtuluşÖ, Lee S H, Lindquist C N, Oh S-H and Haynes L S 2011 Recent progress in SERS biosensingPhys. Chem. Chem.
Phys.1311551–67
[8] Stoddart P R and White D J 2009 Opticalfibre SERS sensors Anal. Bioanal. Chem.3941761–74
[9] Viets C and Hill W 2001 Fibre-optic SERS sensors with conically etched tipsJ. Mol. Struct.563163–6
[10] Vass C, Kiss B, Kopniczky J and Hopp B 2013 Etching of fused silicafiber by metallic laser-induced backside wet etching techniqueAppl. Surf. Sci.278241–4
Figure 7.Detection of R6G added to pure water by measuring its Raman spectrum with afiber optic SERS sensor. The moments when R6G was added to the solution are indicated by dashed vertical lines.
Please note that the total line intensity, i.e. the integral of the line profile is shown in the vertical axis and the error bars represent the average intra-experimental variation of the measured intensity.
[11] Yang X, Ileri N, Larson C C, Carlson T C, Britten J A, Chang A S P, Gu C and Bond T C 2012 Nanopillar array on afiber facet for highly sensitive surface-enhanced Raman scatteringOpt. Express2024819
[12] Kostovski G, Stoddart P R and Mitchell A 2014 The optical fiber tip: an inherently light-coupled microscopic platform for micro- and nanotechnologiesAdv. Mater.263798–820 [13] Kim J A, Wales D J, Thompson A J and Yang G 2020 Fiber‐
optic SERS probes fabricated using two‐photon polymerization for rapid detection of bacteriaAdv. Opt.
Mater.81901934
[14] Bjerneld E J, Svedberg F and Käll M 2003 Laser induced growth and deposition of noble-metal nanoparticles for surface-enhanced Raman scatteringNano Lett.3593–6 [15] Fan Q, Cao J, Liu Y, Yao B and Mao Q 2013 Investigations of the
fabrication and the surface-enhanced Raman scattering detection applications for taperedfiber probes prepared with the laser- induced chemical deposition methodAppl. Opt.526163 [16] Zheng X, Guo D, Shao Y, Jia S, Xu S, Zhao B, Xu W,
Corredor C and Lombardi J R 2008 Photochemical modification of an opticalfiber tip with a silver nanoparticle film: a SERS chemical sensorLangmuir244394–8 [17] Lee P C and Meisel D 1982 Adsorption and surface-enhanced
Raman of dyes on silver and gold solsJ. Phys. Chem.86 3391–5
[18] Andrade G F S, Fan M and Brolo A G 2010 Multilayer silver nanoparticles-modified opticalfiber tip for high performance SERS remote sensingBiosens. Bioelectron.252270–5 [19] Lucotti A and Zerbi G 2007 Fiber-optic SERS sensor with
optimized geometry Sens. Actuator B-Chem.B121356–64 [20] Biskos G, Vons V, Yurteri C U and Schmidt-Ott A 2008
Generation and sizing of particles for aerosol-based nanotechnology KONAPowder Part. J.2613–35 [21] Schmidt-Ott A 2020Spark Ablation: Building Blocks for
Nanotechnology(Boca Raton, FL: Jenny Stanford Publishing) [22] El-Aal M A, Seto T, Kumita M, Abdelaziz A A and Otani Y
2018 Synthesis of silver nanoparticlesfilm by spark discharge deposition for surface-enhanced Raman scattering Opt. Mater.83263–71
[23] Kohut A, Kéri A, Horváth V, Kopniczky J, Ajtai T, Hopp B, Galbács G and Geretovszky Z 2020 Facile and versatile substrate fabrication for surface enhanced Raman spectroscopy using spark discharge generation of Au/Ag nanoparticlesAppl. Surf. Sci.531147268
[24] Guo X, Wagner M, Gutsche A, Meyer J, Seipenbusch M and Nirschl H 2015 Laboratory SWAXS combined with a low- pressure impactor for quasi-online analysis of nanoparticles generated by spark dischargeJ. Aerosol Sci.8517–29 [25] Rothenbacher S, Messerer A and Kasper G 2008
Fragmentation and bond strength of airborne diesel soot agglomeratesPart. Fibre Toxicol.59
[26] Haynes W M 2015CRC Handbook of Chemistry and Physics (Boca Raton, FL: CRC Press)
[27] Yu W W and White I M 2012 A simplefilter-based approach to surface enhanced Raman spectroscopy for trace chemical detectionAnalyst1371168–73
[28] Mullen K I and Carron K T 1991 Surface-enhanced Raman spectroscopy with abrasively modifiedfiber optic probes Anal. Chem.632196–9
[29] Guieu V, Lagugné-Labarthet F, Servant L, Talaga D and Sojic N 2008 Ultrasharp optical-fiber nanoprobe array for Raman local-enhancement imagingSmall496–9
[30] Byeon J H, Park J H and Hwang J 2008 Spark generation of monometallic and bimetallic aerosol nanoparticlesJ. Aerosol Sci.39888–96
[31] Kohut A, Ludvigsson L, Meuller B O, Deppert K, Messing M E, Galbács G and Geretovszky Z 2017 From plasma to nanoparticles: optical and particle emission of a spark discharge generatorNanotechnology28475603 [32] Pilot R, Signorini R, Durante C, Orian L, Bhamidipati M and
Fabris L 2019 A review on surface-enhanced Raman scatteringBiosensors957
[33] Otto A 2005 The‘chemical’(electronic)contribution to surface-enhanced Raman scatteringJ. Raman Spectrosc.36 497–509
[34] Palas GmbHwww.palas.de/en/(accessed: 29.06.2021) [35] VSPARTICLE B.V.https://vsparticle.com/(accessed:
29.06.2021)
[36] Pfeiffer T V, Feng J and Schmidt-Ott A 2014 New developments in spark production of nanoparticlesAdv.
Powder Technol.2556–70
[37] Feng J, Chen D, Pikhitsa P V, Jung Y H, Yang J and Choi M 2020 Unconventional alloys confined in nanoparticles:
building blocks for new matterMatter31646–63 [38] Kohut A, Villy L P, Kéri A, Bélteki Á, Megyeri D, Hopp B,
Galbács G and Geretovszky Z 2021 Full range tuning of the composition of Au/Ag binary nanoparticles by spark discharge generationSci. Rep.115117
8
Nanotechnology32(2021)395501 A Kohutet al