INTERDEPENDENCE AND RISK COMPARISON OF SLOVAK, HUNGARIAN AND POLISH STOCK MARKETS: POLICY AND MANAGERIAL
IMPLICATIONS*
Florin ALIU – Besnik KRASNIQI – Adriana KNAPKOVA – Fisnik ALIU
(Received: 1 December 2017; revision received: 12 February 2018;
accepted: 31 May 2018)
Risk captured through the volatility of stock markets stands as the essential concern for fi nancial investors. The fi nancial crisis of 2008 demonstrated that stock markets are highly integrated. Slo- vakia, Hungary and Poland went through identical centralist economic arrangement, but nowadays operate under diverse stock markets, monetary system and tax structure. The study aims to measure the risk level of the Slovak Stock Market (SAX index), Budapest Stock Exchange (BUX index) and Poland Stock Market (WIG20 index) based on the portfolio diversifi cation model. Results of the study provide information on the diversifi cation benefi ts generated when SAX, BUX and WIG20 join their stock markets. The study considers that each stock index represents an independent port- folio. Portfolios are built to stand on the available companies that are listed on each stock index from 2007 till 2017. The results of the study show that BUX generates the lowest risk and highest weighted average return. In contrast, SAX is the riskiest portfolio but generates the lowest weighted average return. The results fi nd that the stock prices of BUX have larger positive correlation than the stock prices of SAX. Moreover, the highest diversifi cation benefi ts are realized when Portfolio SAX joins Portfolio BUX and the lowest diversifi cation benefi ts are achieved when SAX joins WIG20.
Keywords: portfolio diversifi cation, risk level, eastern stock markets, fi nancial globalisation, inter- national diversifi cation, fi nancial crisis
JEL classifi cation indices: G11, G32
* We are very grateful for the support provided by the Internal Grant Agency of Tomas Bata Uni- versity in Zlin, No. IGA/FaME/2016/018.
Florin Aliu, corresponding author. PhD Candidate in the Department of Finance, Faculty of Man- agement and Economics, Tomas Bata University in Zlin, Czech Republic. E-mail: aliu@fame.utb.cz Besnik Krasniqi, Professor at Faculty of Economics, University of Prishtina, Republic of Kosovo.
E-mail: b.krasniqi@staffs.ac.uk
Adriana Knapkova, Associate Professor at the Department of Finance, Faculty of Management and Economics, Tomas Bata University in Zlin, Czech Republic. E-mail: knapkova@fame.utb.cz Fisnik Aliu, Student at the Faculty of Mathematics & Natural Science, University of Prishtina, Republic of Kosovo. E-mail: fisnik.a@hotmail.com
1. INTRODUCTION
Stock markets are important elements of the financial system that converts sav- ings into financial investments. As such, stock markets deliver the first signals of the country’s economic problems. Daily outputs generated from the stock mar- kets reflect company performance, political environment, international context and so forth. The stock markets of the European Union (EU) are not the major financial source for injecting business activities (ECB 2016). Slovakia, Hungary and Poland went from the planned economy to the market oriented economy. Af- ter breakup of the communist system, structural transformations were introduced including real economy and the financial system. One of the major aspects of the financial transformation was to establish stock markets as a new gate for firms to diversify their capital structure, reduce information asymmetry in their financial statements and generate modern practices of business organisation.
The financial crisis of 2008 showed that the stock market is an important framework of the economic system since it gives spillover effects on the domes- tic and international economies. Financial turmoil of 2008 required government intervention to save the financial system from collapse. Financial and economic globalisation has created interdependency among national states and their econo- mies. For example, the study by Syriopoulos (2007) measured the integration of the Central and Eastern European stock markets with those of Germany and the United States, showing that in the long-run both the German and US stock markets have a strong impact on the eastern European stock markets while in the short-run only the US stock market employs higher influence. Fedorova – Saleem (2009) also showed that the stock markets of the Czech Republic, Poland and Hungary are affected by the Russian stock market volatility.
The efficiency of the stock markets is an additional concern for financial inves- tors. Efficient stock prices reflect underlying conditions of the economy, political environment and the industry where the companies operate. Efficient stock mar- kets self-correct their imperfections where deviations from the intrinsic values are random. Literature suggest that, within efficient markets, financial investors will not be able to earn excess profits in the long- run since stock markets adjust very fast to equilibrium (Fama 1968). The study of Dragota – Tilica (2013) for the post-communist Eastern European countries reveals that market efficiency hypothesis is not rejected for certain securities. Moreover, liquidity within the stock markets of the post-communist countries affects the diversification strate- gies. In addition, Dragota – Mitrica (2004) confirmed that lack of liquidity in the case of the Romanian stock market influences investment strategies since some stocks are not traded each day.
The results concerning market efficiency of the eastern EU countries provide new and better insights for portfolio managers to benefit from international in- vestments. Real life examples and standard theories in the investment manage- ment confirm that higher risk generates higher reward and the other way round.
Investors keep various types of financial securities in their portfolio based on the utility preferences. Therefore, some investors keep less risky investment (risk averse), while others are attracted by risky financial instruments (risk lovers).
Our study measures the risk level of the Budapest stock market (BUX), Bra- tislava stock market (SAX) and Warsaw stock market (WIG20) from a diversifi- cation viewpoint. We could confirm which stock indexes are most well diversi- fied considering them as independent portfolios. Consequently, the results of the study offer signals for potential financial investors that exclusively concentrate on building their portfolios on these stock markets. Our work distinguishes itself from the former researches in the following objectives: 1. Generates answers on the historical risk perspectives for portfolios BUX, SAX, and WIG20; 2. Com- pares the risk level between the three portfolios; 3. Identifies diversification op- portunities when three portfolios operate together within one portfolio.
The rest of the paper is structured as follows: Section 2 provides a review of literature on the portfolio management, Section 3 contains methodology; Sec- tion 4 comments on the results, while Section 5 summarises our results.
2. LITERATURE REVIEW
Arranging a well diversified portfolio is linked with the manager’s ability to over- come standard theoretical guidelines in the portfolio construction. Portfolio per- formance is influenced by the manager’s talent, experience and ability to foresee upcoming events. Scientific results might help building common principles in the investment management, but not the portfolio success. Standard theories on the portfolio diversification confirm that investing all financial recourses in one place would expose investors to higher risk (Brealey – Myers 2007). Reaching the maximum diversification is known as buying market portfolio. Lowenfeld (1909) introduced the first academic discussions concerning diversification ben- efits. Markowitz (1952, 1959) shaped the modern concepts of the portfolio man- agement, where the volatility of the portfolio might be lower than the volatility of individual securities only when portfolios contain securities that are not perfectly correlated. In addition, Markowitz (1959) considers that efficient portfolio is the one that generates the highest return for a given risk level or the lowest risk for a given level of return.
Grubel (1968) showed that international diversification reduces unsystematic risk. Portfolio optimization is influenced by systematic risk (market risk) and un- systematic risk (controlled risk). Unsystematic risk is eliminated from construct- ing the portfolio where assets are not perfectly correlated. Olibe et al. (2007) show that systematic risk is beyond the scope of managers’ control. Diversifica- tion benefits are highly influenced by the correlation coefficient between finan- cial securities (Tang 2004; Sentana 2004; Medo et al. 2009; Drake – Fabozzi 2010; Behr at al. 2013). Higher correlation increases the risk level of the portfo- lio. Correlation coefficient measures the short-run dependency within financial assets while co-integration method captures the long-run relationship (Alexander – Dimitriu 2005). Therefore, financial securities might be positively correlated in the short-run, but can be negatively correlated in the long-run. The underlying logic was that geographical distribution of financial investments diminishes the risk level. However, this paradigm was standing as the investment instruction for portfolio managers till the stock market crash of 1987. Evidences confirm that the stock markets of Japan, Germany and U.S. were highly integrated during the market crash of 1987 (Dwyer – Hafer 1988; Eun – Shim 1989; Vonfurstenberg – Jeon 1989; Bertero – Mayer 1990; Longin – Solnik 1995). The crisis refuted the theory that international diversification diminishes systematic risk.
However, financial investors’ focus is shifted towards the stock markets that are less integrated. Voronkova (2004) showed that a long-run relationship be- tween the western and eastern stock markets exists. In addition, the work con- ducted by MacDonald (2001) confirmed long-run interdependency of the Eastern and Western European stock markets. Gilmore – McManus (2002) confirmed the short-run relationship between the U.S stock markets and the Eastern European stock markets (Czech Republic, Hungary and Poland), while in the long run they are not integrated. Rockinger – Urga (2001) tested integration between the stock markets of the Czech Republic, Poland, Hungary and Russia with the stock mar- kets of the developed countries (U.S., UK and Germany). Their study showed that the stock markets of Czech Republic, Hungary and Poland are influenced by the UK stock market but not by the U.S. stock markets. Moreover, Yang et al. (2006) used co-integration analysis to measure the short- and long-run effect within the Eastern European countries (Czech Republic, Hungary, Poland and Russia) and the developed countries (U.S. and Germany). The results of the study confirmed that the U.S. and German stock markets employed short- and long-run influence in the Eastern European countries (Czech Republic, Hungary, Poland and Russia) mainly during the 1999 and 2002 period.
Additional element that influences risk exposure is the number of securities within the portfolio. Still there is no consensus among scholars about the opti- mal number of securities that achieves full diversification benefits. Therefore,
a small number of assets in the portfolio tend to increase the correlation coef- ficient (Demiguel et al. 2013). Moreover, portfolios with 50 stocks totally elimi- nate diversifiable risk (Cleary – Copp 1999; Domain et al. 2007). In contrast, studies by Evans – Archer (1968); Jennings (1971); Johnson – Shanon (1974);
Bird – Tippett (1986); Statman (1987); Surz – Price (2000); Tang (2004); Brand – Gallagher (2005) confirm that portfolios with 5 to 16 stocks are sufficient to eliminate diversification risk.
To respond to this ongoing debate our study uses portfolio diversification tech- niques into the stock markets. To our best of knowledge, this is the first work that measures the risk level of the SAX, BUX and WIG20 from the portfolio risk perspectives. Further, our study shows which index would deliver the most diver- sified portfolio among the three stock indexes. Previous studies were mainly fo- cused on regional and international integration of the stock indexes. In addition, our study shows which stock indexes offer the highest diversification benefits to create a portfolio, standing on the available companies listed on the respective indexes. Finally, we explain what will happen with the volatility level and cor- relation coefficients if three stock indexes operate together. Policymakers in Slo- vakia, Hungary and Poland would gain signals on the risk benefits of the common stock market, while local and international managers will have better insights about the risk levels enabling them to make informed investment decisions.
3. METHODOLOGY
Our study uses the data collected from the Thomson Reuters Ikon database.
Stock prices data were collected on the weekly basis. Risk was initially meas- ured separately for portfolios: SAX, BUX and WIG20. The same methodological approach was used when SAX joined BUX (SAX+BUX), BUX joined WIG20 (BUX+WIG20), SAX joined WIG20 (SAX+WIG20) and when they operated to- gether (SAX+BUX+WIG20). Two inputs were used in measuring diversification benefits, such as: weekly stock prices and weekly trade volume. Data were col- lected on the same date for the three stock indexes. The risk level is influenced by elements, such as: average correlation coefficient of the companies listed on the stock market, weights of the companies based on the trade volume, and variance and standard deviation of the returns. Risk level rises when all these elements increase and the other way round. Each of these elements (weights, standard deviation, correlation and variance) is measured on the yearly basis. Each year the structure of the formula changes since the number of correlation coefficients was diverse from 2007 to 2017. Standard deviation is calculated from weekly stock market prices of the companies listed on the stock indexes. Correlation
coefficient is used since it measures the short run dependency within financial assets while co-integration method captures the long-run relationship. Moreover, the methodology does not consider transaction costs when weighted average re- turns are calculated.
SAX, BUX and WIG20 operate under different monetary and corporate tax systems. However, when we join the stock indexes together we assume an identi- cal tax system. Slovakia has euro as a national currency, Hungary has HUF, while Poland has zloty as an official currency. However, we have collected historical stock prices and trade volume on SAX, BUX and WIG20 in euro.
The following formula represents the risk level of the SAX, BUX and WIG20 on the yearly basis. Identical formula has been used when we join stock indexes together (WIG20+BUX, SAX+BUX, BUX+WIG20 and SAX+BUX+WIG20).
(1)
Formula explanation: σ2k of the portfolio in the year k is computed on the sample of nk companies. Indexes i,j = 1,….,nk represents and identifies a posi- tion in the set of arbitrary order stock market companies for that year, so index i (repectively j) indicates a stock market company. Index i indicates a stock market company, j is an auxiliary index assuring that correlation is computed on distinct companies, ω represents weight of each listed company in the respective stock index within the portfolio based on their trade volume, ω2 represents weight in square, σ2is variance of returns (stock prices of individual listed companies in the stock index or joint stock index), σstands for the standard deviation of returns (stock prices of the individual listed companies in the stock index or joint stock index), while φ(i, j) shows correlation coefficient between returns (stock prices of the individual listed companies in the stock index or joint stock indexes) of stock market companies in the portfolio.
The formula has been implemented through the following program: Python 3.6.3 (version: 0.21.0), Numpy (version: 1.13.3), and Jupiter Notebook (version:
5.2.0). Generating the inputs of the risk level (σ2) starts with splitting the tables that contain prices and trade volume. The following matrix has been used to gen- erate the results:
(2) where aij represents combinations (correlation coefficient) between companies i and j.
An additional aim of our study is to show if the investors would be compen- sated for the risk that they undertake. The weighted average return is a better
2 2 2
2
k k k
k k k k k k
n n n
k i i i j j ij
i i j i
σ ω σ ω ω σ ρ
0
ij ij
a for i j
U for i j
representation of the real returns since weights (trade volumes) of the listed com- panies are different each year.
The following formula represents weighted average return:
(3)
Formula explanation: WAR denotes weighted average return of the individual portfolios (SAX, BUX and WIG20). Ei shows returns of the individual listed com- panies on the respective stock indexes (SAX, BUX and WIG20) and Wi indicates weights of the listed companies measured from the trade volume.
4. RESULTS AND DISCUSSION
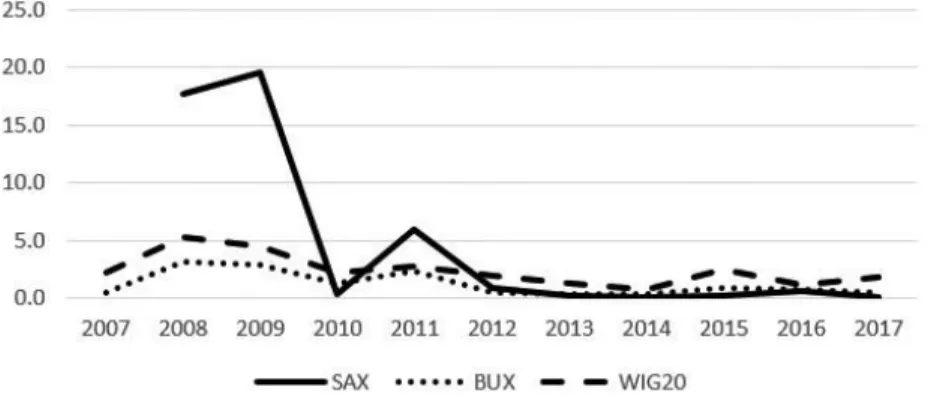
4.1. Risk level of the Slovak, Hungarian and Polish stock markets (2007–2017) SAX, BUX and WIG20 have a limited number of listed companies and low turn- over level. SAX in 2017 had only 6 listed companies, BUX had 16 listed compa- nies, while WIG20 had 20 listed companies. Table 1 shows the risk levels of the analysed portfolios from 2007 to 2017. SAX is 3.8 times riskier (σ) than BUX on average, while 2 times riskier than WIG20. In addition, WIG20 is 2 times riskier than BUX on average. In contrast, risk level is diverse among years. Therefore, the highest diversification benefit (lowest risk level) for financial investors is provided by portfolio (BUX).
Table 1. Diversification risk ( ) of SAX, BUX and WIG20 (2007–2017) σ 2007 2008 2009 2010 2011 2012 2013 2014 2015 2016 2017
SAX 17.70 19.60 0.39 5.99 0.84 0.27 0.04 0.17 0.63 0.06
BUX 0.46 3.19 2.87 1.23 2.32 0.54 0.29 0.37 0.82 0.72 0.52
WIG20 2.18 5.25 4.49 2.22 2.76 1.96 1.28 0.76 2.41 1.11 1.83 Note: Risk level is not calculated for SAX in 2007 because data is not available.
Source: Authors’ calculations based on the Thomson Reuters database.
The reason why BUX offers higher diversification benefits than SAX and WIG20 based on the factors that influence risk (see Table 3 in the Appendix).
BUX on average (2007–2017) was 3.5 times less volatile than SAX, while 27 times less volatile than WIG20. And, WIG20 has the highest average volatility compared to SAX and BUX. Average correlation coefficient (2007–2017) is an additional factor that influences risk level. BUX, on average, was 2.6 times more
1
*
n
i i
i
WAR E W
correlated than SAX, while WIG20 had almost the same average correlation.
Moreover, BUX generates the highest weighted average return (0.02%) from 2008 to 2017, followed by WIG20 with 0.01% and SAX with –0.013%. In addi- tion, BUX is less risky than SAX and WIG20 but generates the highest weighted average return (Table 3 in Appendix).
The number of correlation coefficients depends on the number of listed compa- nies in the stock index. On average, SAX has a smaller number of listed compa- nies than BUX and WIG20. As seen in Table 3 in Appendix, SAX on average has 10.5 correlation coefficients, BUX has 106 correlation coefficients while WIG20 has 141.8 correlations. Therefore, SAX was a highly concentrated market and this made it riskier than WIG20, even though it had lower average correlation and lower volatility. During 2008–2009, SAX trade volume was mainly concentrated in the Slovnaft (98%), while from 2010 to 2016 it was held by Best Hotel Proper- ties (73%) and Tatry Mountain (15%). However, in Poland (WIG20) from 2008 to 2016, the majority of the trade volume was concentrated on Polskie Górnictwo Naftowe i Gazownictwo (PGN) (23.3%). While in Hungary (BUX) the concen- tration of trade volume on average from 2007 to 2016 was spread almost equally within two companies: Magyar Telekom Távközlési Nyrt. with 30.8% and OPT Bank Nyrt. with 31.6% on average.
Figure 1 represents the risk level from 2007 to 2017 of SAX, BUX and WIG20.
The financial crisis of 2008–2009 had increased the risk level in the three stock markets. During 2008-2009, BUX had the lowest risk level compared to SAX and WIG20, such as 6 times less risky than SAX and 1.6 times less risky than WIG20. The reasons why BUX was less risky than SAX and WIG20, stands on the facts that its listed companies were more active in selling and buying stocks (less concentration in particular companies) and also with lower average volatil- ity while higher correlation coefficient.
Figure 1. Risk level of SAX, BUX and WIG20 (2007–2017) Source: Authors’ elaboration.
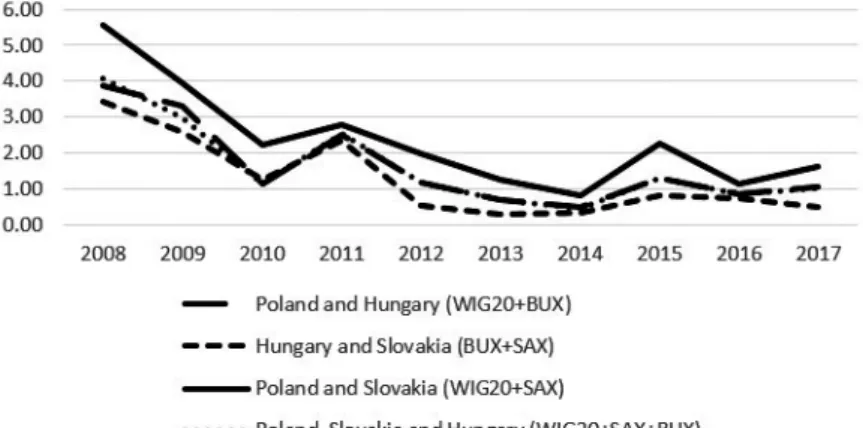
4.2. Risk level when SAX, BUX and WIG20 operate together
Risk level is measured when SAX operates together with BUX (SAX+BUX), BUX operates together with WIG20 (BUX+WIG20), SAX operates to- gether with WIG20 (SAX+WIG20) and when all of them operate together (BUX+SAX+WIG20), and the results are given in Table 2. Since stock prices and trade volume in each stock indexes are in euro, this enables the joining together of the stock indexes. Results show diversification benefits when SAX, BUX and WIG20 operate together. The highest diversification benefits are realized when Hungary and Slovakia join their stock markets (BUX+SAX). In contrast, the low- est diversification benefits are reached when Poland joins the stock market with Slovakia (WIG20+SAX). Average risk measurements from 2008 to 2017 show that WIG20+BUX are 1.2 times riskier than BUX+SAX, while 1.43 times less risky than WIG20+SAX and have almost same risk as WIG20+SAX+BUX. In contrast, BUX+SAX are 1.8 times less risky than WIG20+SAX and 1.2 times less risky than WIG20+SAX+BUX. Therefore, WIG20+SAX are 1.4 times risk- ier than WIG20+SAX+BUX.
Table 2. Risk level of different combinations of SAX, BUX and WIG20 stock markets 2008 2009 2010 2011 2012 2013 2014 2015 2016 2017 σ-WIG20+BUX 3.85 3.32 1.13 2.52 1.19 0.70 0.48 1.31 0.86 1.03 σ-BUX+SAX 3.43 2.59 1.23 2.35 0.54 0.28 0.34 0.82 0.72 0.48 σ-WIG20+SAX 5.57 3.94 2.21 2.77 1.97 1.24 0.81 2.28 1.12 1.63 σ-WIG20+SAX+BUX 4.09 3.00 1.13 2.53 1.19 0.70 0.46 1.31 0.86 1.00 Source: Authors’ calculations based on the Thomson Reuters database.
Figure 2 shows a risk level of four different combinations between SAX, BUX and WIG20. Highest diversification benefits are reached when Hungary and Slovakia join their stock markets (BUX+SAX). In addition, risk level of WIG20+BUX moves in the same line with WIG20+BUX+SAX. Therefore, the lowest diversification benefit for investors is found when Poland and Slovakia (WIG20+SAX) join their stock markets. Moreover, weighted average returns dur- ing the same period are as follows: BUX+SAX generate 0.02%, BUX+WIG20 with 0.0049%, WIG20+BUX+SAX with 0.047% and WIG20+SAX with 0.013%
(see Table 4 in the Appendix). The best portfolio in terms of risk and rewards is generated when BUX joins SAX.
The reasons why the combinations between BUX and SAX deliver the highest diversification benefits are linked with the influential factors affecting risk level.
They generate the lowest average volatility compared to all other combinations (Table 4 in the Appendix) and the highest volatility occurs when Slovakia joins
the stock market with Poland. Therefore, WIG20+SAX are14 times more volatile on average than BUX+SAX. SAX+BUX+WIG20, on average, generate the high- est number of correlation coefficients (705.6), while BUX+SAX contain the low- est number of correlation coefficients (195.7). Average correlation coefficient is moving almost in the same range. Further, WIG20+SAX and WIG20+SAX+BUX have the same average correlation coefficient (rij = 0.26). Highest positive cor- relation occurs when BUX joins WIG20 (rij = 0.3).
5. CONCLUSION
Stock market is an essential component that enables individuals and financial in- stitutions to diversify their portfolio. Risk is mainly linked with volatility of stock markets. Financial investors tend to find securities and stock indexes that gener- ate the highest diversification benefits. The stock markets in Slovakia, Poland and Hungary hold small share within their national financial pie. The risk level of the individual stock markets shows that BUX offers the highest diversifica- tion benefits for financial investors. On average BUX was 2 times less risky than WIG20 and 3.5 times less risky than SAX. Therefore, SAX was 2 times riskier than WIG20. Moreover, BUX has the lowest volatility compared to SAX and WIG20. Low volatility is an important element in eliminating uncertainty for financial investors.
The financial crisis of 2008 affected SAX, BUX and WIG20 by declining their prices and raising average correlation coefficient. During the crisis, SAX was the
Figure 2. Diversification risk with different combinations between SAX, BUX and WIG20 Source: Authors’ calculations.
riskiest stock market compared to BUX and WIG20. Even though, WIG20 has higher market size than BUX yet offers lower diversification benefits. The results obtained from BUX disprove the theory that more assets in the portfolio lower risk level. Additionally, BUX has the lowest risk on average but also generates the highest weighted average return. In contrast, SAX is the riskiest portfolio but generates the lowest return.
Additional aim of our research was to capture diversification benefits when the stock markets of Slovakia, Hungary and Poland operate together. The highest portfolio diversification benefits are gained when Slovakia joins the stock market with Hungary (SAX+BUX). The portfolio of SAX+BUX contains the lowest risk and generates the highest weighted average return. Alternatively, the lowest di- versification benefits in terms of risk and rewards are achieved when Poland joins the stock market with Slovakia (WIG20+SAX). Standard theories on the portfo- lio management claim that more financial securities within the portfolio deliver lower risk. In contrast to the theory, SAX+BUX have the lowest number of stocks compared to all other combinations but generate the highest diversification ben- efits. Furthermore, SAX during the 2008 crisis would have been 4.2 times less risky if it had operated under one common stock market (SAX+BUX+WIG20), while WIG20 would have been 1.2 times less risky. In contrast, BUX would have higher risk level of 22% during the crisis if it had operated under the common stock market. Joining the stock markets for Slovakia, Hungary and Poland would be more beneficial in terms of uncertainties (volatility), diversification benefits, size of the market and more international attention from financial investors.
Moreover, operating under the common stock market might be a difficult task, since stock markets represent the economic identity of the nation states. Future research will identify which of the stock indexes in the Eastern and Central Euro- pean countries generate the highest diversification benefits, and what will happen with the diversification benefits when they operate as one stock index.
REFERENCES
Alexander, C. – Dimitriu, A. (2005): Indexing and Statistical Arbitrage. The Journal of Portfolio Management, 31(2): 50–63.
Behr, P. – Guettler, A. – Miebs, F. (2013): On Portfolio Optimization: Imposing the Right Con- straints. Journal of Banking & Finance, 37(4): 1232–1242.
Bertero, E. – Mayer, C. (1990): Structure and Performance: Global Interdependence of Stock Mar- kets around the Crash of October 1987. European Economic Review, 34(6): 1155–1180.
Bird, R. – Tippett, M. (1986): Naive Diversifi cation and Portfolio Risk – A Note. Management Science , 32(2): 244–251.
Brands, S. – Gallagher, D. R. (2005): Portfolio Selection, Diversifi cation and Fund-of-Funds:
A Note. Accounting & Finance, 45(2): 185–197.
Brealey, R. – Myers, S. C. – Marcus, A. J. (1995): Fundamentals of Corporate Finance. New York:
McGraw-Hill.
Cleary, S. – Copp, D. (1999): Diversifi cation with Canadian Stocks: How Much is Enough. Cana- dian Investment Review, 12(3): 7–16.
Demiguel, V. – Martin-Utrera, A. – Nogales, F. J. (2013): Size Matters: Optimal Calibration of Shrinkage Estimators for Portfolio Selection. Journal of Banking & Finance, 37(8): 3018–
3034.
Domian, D. L. – Louton, D. A. – Racine, M. D. (2007): Diversifi cation in Portfolios of Individual Stocks: 100 Stocks are Not Enough. Financial Review, 42(4): 557–570.
Drake, P. P. – Frank, J. F. (2010): The Basics of Finance. New Jersey: John Wiley & Sons, Inc.
Dwyer Jr, G. P. – Hafer, R. W. (1988): Are National Stock Markets Linked? Federal Reserve Bank of St. Louis Review, November/December: 3–14.
Eun, C. S. – Him, S. (1989): International Transmission of Stock Market Movements. Journal of Financial and Quantitative Analysis, 24(2): 241–256.
European Central Bank (ECB) (2015): Annual Report (2015): [Retrived 2017–9–27] Https://Www.
Ecb.Europa.Eu/Pub/Pdf/Other/Reportonfi nancialstructures201610.En.Pdf?592b728066f71be0 788991e606b504bd
Evans, J. L. – Archer, S. H. (1968): Diversifi cation and the Reduction of Dispersion: An Empirical Analysis. The Journal of Finance, 23(5): 761–767.
Fama, E. F. (1968): Risk, Return And Equilibrium: Some Clarifying Comments. The Journal of Finance, 23(1): 29–40.
Fedorova, E. J. – Saleem, K. (2009): Volatility Spillovers between Stock and Currency Markets:
Evidence from Emerging Eastern Europe. Czech Journal of Economics and Finance, 60(6):
519–533.
Gilmore, C. G. – McManus, G. M. (2002). International Portfolio Diversifi cation: US and Central European Equity Markets. Emerging Markets Review, 3(1): 69–83.
Grubel, H. G. (1968): Internationally Diversifi ed Portfolios: Welfare Gains and Capital Flows. The American Economic Review, 58(5): 1299–1314.
Jennings, E. H. (1971): An Empirical Analysis of Some Aspects of Common Stock Diversifi ca- tion. Journal of Financial and Quantitative Analysis, 6(2): 797–813.
Jeon, B. N. – Vonfurstenberg, G. M. (1990): Growing International Co-Movement in Stock-Price Indexes. Quarterly Review of Economics And Business, 30(3): 15–30.
Johnson, K. H. – Shannon, D. S. (1974): A Note on Diversifi cation and the Reduction of Disper- sion. Journal of Financial Economics, 1(4): 365–372.
Longin, F. – Solnik, B. (1995): Is the Correlation in International Equity Returns Constant: 1960–
1990? Journal of International Money and Finance, 14(1): 3–26.
Lowenfeld, H. (1909): Investment an Exact Science. London: The Financial Review of Reviews.
MacDonald, R. (2001): Transformation of External Shocks and Capital Market Integration. In:
Schröder, M. (ed.): The New Capital Markets in Central and Eastern Europe. Springer: Berlin, pp. 268–283.
Markowitz, H. (1952): Portfolio Selection. The Journal of Finance, 7(1): 77–91.
Markowitz, H. (1959): Portfolio Selection: Effi cient Diversifi cation of Investments. Cowles Foun- dation Monograph, No. 16.
Medo, M. – Yeung, C. H. – Zhang, Y. C. (2009): How to Quantify the Infl uence of Correlations on Investment Diversifi cation. International Review of Financial Analysis, 18(1): 34–39.
Olibe, K. O. – Michello, F. A. – Thorne, J. (2008): Systematic Risk and International Diversifi ca- tion: An Empirical Perspective. International Review of Financial Analysis, 17(4): 681–698.
Rockinger, M. – Urga, G. (2001): A Time Varying Parameter Model to Test for Predictability and Integration in the Stock Markets of Transition Economies. Journal of Business & Economic Statistics, 19(1): 73–84.
Sentana, E. (2004): Factor Representing Portfolios in Large Asset Markets. Journal of Economet- rics, 119(2): 257–289.
Statman, M. (1987): How Many Stocks Make a Diversifi ed Portfolio? Journal of Financial and Quantitative Analysis, 22(3): 353–363.
Surz, R. J. – Price, M. (2000): The Truth about Diversifi cation by the Numbers. The Journal of Investing, 9(4): 93–95.
Syriopoulos, T. (2007): Dynamic Linkages between Emerging European and Developed Stock Mar- kets: Has the EMU Any Impact? International Review of Financial Analysis, 16(1): 41–60.
Tang, G. Y. (2004): How Effi cient is Naive Portfolio Diversifi cation? An Educational Note. Ome- ga, 32(2): 155–160.
Thomson Reuters Ikon Database (TASS Database) (2017): Excel Reports on the Company Data of 2017. Https://Www.Thomsonreuters.Com/En/Resources/Third-Party-Restrictions/Tass- Database.
Html
Voronkova, S. (2004): Equity Market Integration in Central European Emerging Markets: A Cointeg- ration Analysis with Shifting Regimes. International Review of Financial Analysis, 13(5): 633–
647.
Yang, J. – Hsiao, C. – Li, Q. – Wang, Z. (2006): The Emerging Market Crisis and Stock Market Linkages: Further Evidence. Journal of Applied Econometrics, 21(6): 727–744.
APPENDIX
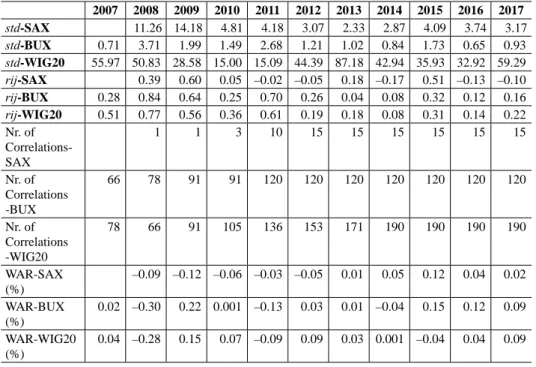
Table 3. Risk components of the analysed stock markets (SAX, BUX and WIG20) 2007 2008 2009 2010 2011 2012 2013 2014 2015 2016 2017
std-SAX 11.26 14.18 4.81 4.18 3.07 2.33 2.87 4.09 3.74 3.17
std-BUX 0.71 3.71 1.99 1.49 2.68 1.21 1.02 0.84 1.73 0.65 0.93
std-WIG20 55.97 50.83 28.58 15.00 15.09 44.39 87.18 42.94 35.93 32.92 59.29
rij-SAX 0.39 0.60 0.05 –0.02 –0.05 0.18 –0.17 0.51 –0.13 –0.10
rij-BUX 0.28 0.84 0.64 0.25 0.70 0.26 0.04 0.08 0.32 0.12 0.16
rij-WIG20 0.51 0.77 0.56 0.36 0.61 0.19 0.18 0.08 0.31 0.14 0.22 Nr. of
Correlations- SAX
1 1 3 10 15 15 15 15 15 15
Nr. of Correlations -BUX
66 78 91 91 120 120 120 120 120 120 120
Nr. of Correlations -WIG20
78 66 91 105 136 153 171 190 190 190 190
WAR-SAX (%)
–0.09 –0.12 –0.06 –0.03 –0.05 0.01 0.05 0.12 0.04 0.02 WAR-BUX
(%)
0.02 –0.30 0.22 0.001 –0.13 0.03 0.01 –0.04 0.15 0.12 0.09 WAR-WIG20
(%)
0.04 –0.28 0.15 0.07 –0.09 0.09 0.03 0.001 –0.04 0.04 0.09 Source: Authors’ calculation.
Notes: Average correlation coefficient (rij) is measured from all available correlations between companies listed on the stock market. Average standard deviation (std) measures the average of individual standard deviation of the listed companies in each year, average variance (v) measures the average volatility of individual listed stocks. Number of correlation coefficients (Nr. of correlations) is determined from the number of listed com- panies in the respective years. WAR represents the weighted average return of the individual portfolios (SAX, BUX and WIG20) from 2007 to 2017.
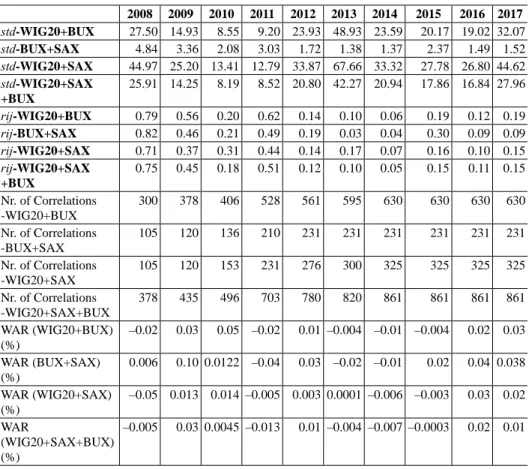
Table 4. Risk components within different combinations of the stock markets, such as:
WIG20+BUX, WIG20+SAX, BUX+SAX, WIG20+SAX+BUX
2008 2009 2010 2011 2012 2013 2014 2015 2016 2017 std-WIG20+BUX 27.50 14.93 8.55 9.20 23.93 48.93 23.59 20.17 19.02 32.07
std-BUX+SAX 4.84 3.36 2.08 3.03 1.72 1.38 1.37 2.37 1.49 1.52
std-WIG20+SAX 44.97 25.20 13.41 12.79 33.87 67.66 33.32 27.78 26.80 44.62 std-WIG20+SAX
+BUX
25.91 14.25 8.19 8.52 20.80 42.27 20.94 17.86 16.84 27.96
rij-WIG20+BUX 0.79 0.56 0.20 0.62 0.14 0.10 0.06 0.19 0.12 0.19
rij-BUX+SAX 0.82 0.46 0.21 0.49 0.19 0.03 0.04 0.30 0.09 0.09
rij-WIG20+SAX 0.71 0.37 0.31 0.44 0.14 0.17 0.07 0.16 0.10 0.15
rij-WIG20+SAX +BUX
0.75 0.45 0.18 0.51 0.12 0.10 0.05 0.15 0.11 0.15 Nr. of Correlations
-WIG20+BUX
300 378 406 528 561 595 630 630 630 630
Nr. of Correlations -BUX+SAX
105 120 136 210 231 231 231 231 231 231
Nr. of Correlations -WIG20+SAX
105 120 153 231 276 300 325 325 325 325
Nr. of Correlations -WIG20+SAX+BUX
378 435 496 703 780 820 861 861 861 861
WAR (WIG20+BUX) (%)
–0.02 0.03 0.05 –0.02 0.01 –0.004 –0.01 –0.004 0.02 0.03 WAR (BUX+SAX)
(%)
0.006 0.10 0.0122 –0.04 0.03 –0.02 –0.01 0.02 0.04 0.038 WAR (WIG20+SAX)
(%)
–0.05 0.013 0.014 –0.005 0.003 0.0001 –0.006 –0.003 0.03 0.02 WAR
(WIG20+SAX+BUX) (%)
–0.005 0.03 0.0045 –0.013 0.01 –0.004 –0.007 –0.0003 0.02 0.01
Source: Authors’ calculations.