Does volatility transmission between stock market returns of Central and Eastern European countries
vary from normal to turbulent periods?
NGO THAI HUNG
pFaculty of Economics and Law, University of Finance-Marketing, Ho Chi Minh City, Vietnam
Received: April 22, 2018 • Revised manuscript received: October 09, 2020 • Accepted: November 12, 2018
© 2020 Akademiai Kiado, Budapest
ABSTRACT
This study investigates the transmission mechanism of price and volatility spillovers across the Budapest, Warsaw, Prague, Bucharest, and Zagreb stock markets in the pre- and post-financial crisis periods under the framework of the multivariate Exponential Generalized Autoregressive Conditional Heteroskedasticity (EGARCH) model. By using daily closing prices, the results highlight certain interesting findings. I found evidence of price spillovers of the intraregional linkages among the stock price movements in five countries.
This analysis shows the existence of bi-directional volatility spillovers between stock markets of the Czech Republic and Croatia in the pre-crisis period, and between Hungary and Romania in the post-crisis period.
Also, there are significant volatility spillovers from Croatia to Poland and from Poland to the Czech Re- public during two periods. The volatility is found to respond asymmetrically to innovations in other markets. The findings also indicate that the stock markets are more substantially integrated into crisis, as well as the persistence of volatility spillovers between the stock markets increases, and the financial stock markets become more integrated after the crisis period.
KEYWORDS
volatility spillover, 2007financial crisis, market integration, Central and Eastern Europe JEL CLASSIFICATION INDICES
C15, C51, G15
pE-mail: hung.nt@ufm.edu.vn
1. INTRODUCTION
Analyses of the stock market volatility spillovers are dated back toEngle et al. (1990)andNelson (1991), who created much attention in thefinancial market literature. The heat-wave hypothesis and the meteor-shower hypothesis were introduced as the theoretical foundations for own and cross-type spillovers. The heat-wave hypothesis representing own-spillover illustrates that the current volatility of a market is a function of past volatility of the same market. On the other hand, the meteor-shower hypothesis representing cross-spillover reveals that the current vola- tility of a market is a function of both past volatility of the same market and past volatility from other markets.
There have been many studies based on the GARCH-type framework to examine volatility spillovers among financial markets in different countries. The key study of Nelson (1991) contributed a significant characteristic regarding volatility spillover to literature, which is the salient property of asymmetry. Volatility transmission also exhibits asymmetry with regards to the kind of news. Bad news seems to have a severe effect on spillover as compared to good news.
This asymmetric property of spillover is a prime contributor to the cause offinancial contagion.
It is clear that the volatility spillover can be divided into three fundamental points: (i)first, a bi- directional volatility spillover among stock markets; (ii) a unidirectionalflow of volatility from a stock market to another stock market and vice versa; and (iii) non-persistence of the volatility spillover among them (Hung 2018).
It is strongly believed that the regional economic integration across the world is a conse- quence of increasing regionalisation of economic activities and liberalisation. This is also the result of the increased globalisation of financial markets, the interdependence of major financial markets, the international investment processes and the contagion effects. In addition, the international volatility spillover effect of markets has important implications for domestic economies and for international diversification. Systematic understanding of short-run inter- dependence in return and volatility spillovers and the nature of the markets provide valuable information on diversification and hedging strategies. The important topic of investigation of transmission of stock market information and the behaviour of emerging markets among the Central and Eastern European (CEE) countries in particular, global equity markets in general, has attracted great attentions from academic researchers and industry professionals because the openness of financial markets contributes to economic development. Scholars and policymakers are attempting to understand the changing pattern of integration behaviour of the developed markets with emerging markets. It is obvious that the emerging nations have experienced several crises during the last three decades, the stock market crash in 1987, the Mexican currency crisis in 1994, the Asian currency crisis in July 1997, and the subprime crisis of 2007–2008. The term
“turbulent” episodes, with some key features, mean large negative asset returns and high volatility and their effects have swiftly proliferated to other emerging economies (Kamisli et al.
2015).
An investigation of volatility spillover effects between equity markets could provide a straightforward insight for foreign investors who seek for diversification opportunities abroad.
This is because price, volatility and interlinkages of stock markets imply that the volatility of markets tends to move together, and the potential gains from international diversification will be reduced. Interestingly, the developing markets in the emerging economies with a relatively high and stable growth rate in the CEE countries, such as Hungary, Poland, the Czech Republic,
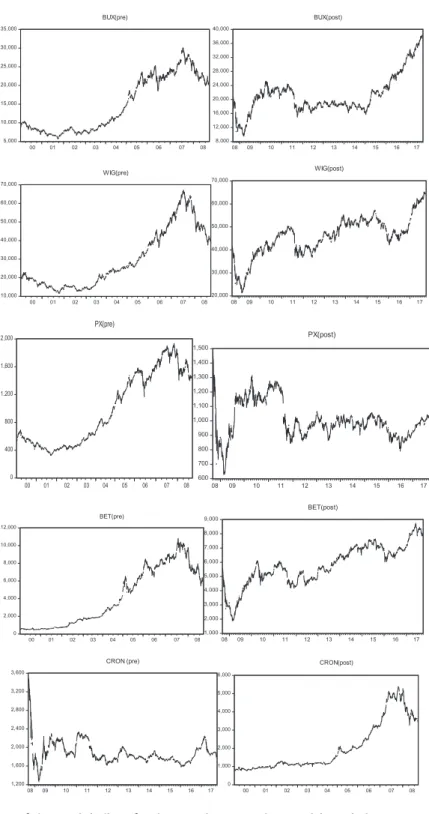
Romania, and Croatia in recent years are especially remarkable, and they are usually good choices for market participants looking to diversify their portfolios internationally (Figure 1).
This is the case because these markets achieved substantial level of development, the same in size and institutional characteristics. Therefore, considering the empirical research of volatility spillovers, intraregional linkages have become necessary from the perspective of portfolio diversification and hedging strategies.
The purpose of this study is to analyse the changes in the co-movement of return and volatility spillovers among the stock markets of the countries which have undergone the crisis directly in the neighbouring CEE countries using the Exponential Generalized Autoregressive Conditional Heteroskedasticity (EGARCH) framework. More specifically, I select five stock markets, Budapest Stock Exchange (BUX), Warsaw Stock Exchange (WIG), Prague Stock Ex- change (PX), Bucharest Stock Exchange (BET) and Zagreb Stock Exchange (CRON). The period of study is divided into the pre-crisis and post-crisis subperiods. The crisis seems to have the common impact on these countries as a whole. Rapid economic growth has been accompanied by a sharp increase in the size of the markets; therefore, I consider whether the integration of financial markets in the post-crisis period takes place (AsJebran et al. (2017)explained that the long-lasting effect of the subprime crisis of 2007–2008 was probably due to the increasing stock market integration in the emerging markets of Asia.).
This paper contributes to the existing literature of the ongoing debate about stock interaction in several ways. Firstly, I consider five important markets of CEE. This analysis will provide useful information for investors to international portfolio diversification. Secondly, the CEE countries have attempted to increase cooperation and trade among themselves in order to examine integrations among the stock markets, taking into account of the pre- and post- financial crisis. Thirdly, I model the possible returns and asymmetric volatility spillovers among five emerging markets in which the previous studies only focused on the dynamic relationship between returns and transmissions.
Based on the results and findings of this study it can be concluded that there is a new ev- idence on price and volatility spillovers across five developing stock markets for the periods before and after the 2007–2008financial crisis. The process of integration of the CEE countries is Figure 1.Significance of selected equity markets
Source:Web pages of equity exchanges and Bloomberg.
relatively remarkable in the post-crisis period, and it is expected to continue to progress further given the initiatives undertaken by the countries’policymakers.
The rest of the paper is organised as follows: Section 2 describes a brief review of the previous researches on return and volatility spillovers across markets. Methodology and data employed for this study are explained in Section 3. Section 4 discusses the results on volatility spillover.
The final section includes conclusions and recommendations.
2. LITERATURE REVIEW
Interdependence among international markets has attracted great attention from academic re- searchers and practitioners. It has been investigated in two primary contexts: interdependence in returns and interdependence in volatility. This interdependence exists in stock markets in the region which will respond similarly to the common shocks. Most of the studies have concen- trated on the interdependence of the developed markets, such as the US, Japanese and major European markets (Ko–Lee 1991;Koutmos–Booth 1995; Maghyereh et al. 2015).
(a) Asian countries
Some of the researchers have also paid their attention to studying the developed Asian and emerging markets (Jebran et al. 2017; Jang – Sul 2002). The earlier studies illustrated slight integration and spillover effect between the stock markets (Ko –Lee 1991;Panton et al. 1976;
Kim et al. 2015; Bhar–Nikolova 2009). However, most recent investigations indicated strong interdependence between them because of the development of advanced technology and financial deregulations of the financial markets (Jebran et al. 2017; Okicic 2015; Johsi 2011;
Baum€ohl et al. 2018;Mensi et al. 2018;Morales Zumaquero–Sosvilla Rivero 2018;Caloia et al.
2018;Alotaibi–Mishra 2015;Lau–Sheng 2018;BenSaı€da et al. 2018;Tiwari et al. 2018;Bala– Takimoto 2017;Ghouse –Khan 2017;Ahmed –Huo 2018;Naresh et al. 2018;Huo–Ahmed 2017).
More recently, there have been several investigations in the GARCH-type framework, for instance, Alotaibi–Mishra (2015)examined the effects of return spillovers from the regional (Saudi Arabia) and global (US) markets to the Gulf Cooperation Council (GCC) stock markets (Bahrain, Oman, Kuwait, Qatar, United Arab Emirates). Their findings reported that there existed significant return spillover effects from Saudi Arabia and US to the GCC markets; and trade, turnover, and institutional quality had significant influences on regional volatility spill- overs from Saudi Arabia to the GCC markets. Bala–Takimoto (2017) highlighted the lower correlations among the emerging markets and these coefficients had a dramatical increase during thefinancial crises. They also detected evidence of volatility spillovers and observed that own-volatility spillovers were higher than cross-volatility spillovers for the emerging markets.
Ghouse–Khan (2017)studied dynamic linkages and spillover effect between the Pakistani and leading foreign stock markets, and the authors documented mixed co-movements between these stock markets, also bidirectional spillover effect between the Dubai Financial Market General Index (DFMGI) and the Karachi Stock Market (KSE100).Huo– Ahmed (2017)conducted a study of the influence of the recently introduced Shanghai-Hong Kong stock connect. Their results revealed that the new stock connect contributed to the increasing importance of the Chinese mainland stock market and economic activities. Lau – Sheng (2018) found out an
evidence of the inter-regional spillover effect in the daytime returns and the Shanghai stock market was the least integrated of all nine markets selected by considering the inter- and intra- regional spillover effects across the international stock markets in London, Paris, Frankfurt, Toronto, New York, Tokyo, Shanghai, Hong Kong, and Mumbai.Baum€ohl et al. (2018)analysed 40 developed, emerging and Frontier stock markets during the periods of 2006–2014 and documented that volatility spillovers decreased with the temporal effects regarding the US equity markets. These markets were characterised by greater temporal proximity.Ahmed–Huo (2018) showed a substantial evidence of bidirectional feedback relationships between the Chinese and most of the African stock market prices and at least a unidirectionalflow of spillover effect from China to most of the African stock markets.Xuan Vinh and Ellis (2018)illustrated a statistically significant correlation, return spillover and volatility linkage between the Vietnamese stock market with other advanced stock markets of the US, Hong Kong and Japan.
The volatility transmission mechanism using the GARCH-type models across various markets is also studied by different researchers.Nath Mukherjee–Mishra (2010)studied stock market integration and volatility spillover between India and its major Asian counterparts and found that contemporaneous intraday return spillovers between them were positively significant and bi-directional. It was observed that there was a significantflow of market information from the four Asian markets of Hong Kong, Korea, Singapore and Thailand to India. Singh et al.
(2010)examined price and volatility spillovers across the North American, European and Asian stock markets. The results indicated that a particular index was mostly affected by the indices which opened/closed before it and there was a more considerable regional influence among the Asian and European stock markets.Sok-Gee et al. (2010)studied volatility spillovers among the ASEAN-5 (Malaysian, Indonesian, Siamese, Singaporean, Philippines) stock markets and be- tween the ASEAN-5 with the US and Japan for a period after the Asianfinancial crisis. The paper highlighted intraregional linkages among the stock price movements and volatility spillovers in the ASEAN-5 were more influenced by the stock market in the US relative to the Japanese.Lahrech–Sylwester (2011)measured the extent of integration and co-movement in the Latin American equity markets of Argentina, Brazil, Chile and Mexico with the US equity market and found that there was an increase in the degree of co-movement between these countries and the US.Natarajan et al. (2014) focused on the mean-volatility spillover effects happening across the markets of Australia, Brazil, the US, Germany and Hong Kong. The analysis provided strong evidences of mean and volatility spillover across some stock exchanges.
From Latin American nations, Gamba-Santamaria et al. (2017) reported that Brazil is a net volatility transmitter for most of the sample period, while Chile, Colombia and Mexico are net receivers. The volatility spillover is substantially higher between 2008Q3 and 2012Q2, and shock transmission from the US to Latin America dramatically increased around the Lehman Brothers’
episode. I shall only present the following recent econometric modelling results of the condi- tional mean and volatility spillovers of stock returns from the emerging and Frontier stock markets and state of the art results using the GARCH-type models.
(b) European countries
Shields (1997)considered two emerging Eastern European markets (Hungary and Poland) to investigate stock return volatility. The Tobit GARCH model was employed, and the estimation pointed out that no asymmetry exists in either emerging markets.Scheicher (2001)investigated the regional and global integration of the stock markets in Hungary, Poland and the Czech
Republic by employing a vector autoregression with a multivariate GARCH component and found that there was an existence of limited interaction in returns both at the regional and global shocks, but news to innovations to volatility have a primarily regional character. Murinde – Poshakwale (2001)studied volatility in six emerging stock markets including Croatia, the Czech Republic, Hungary, Poland, Russia, and Slovakia. Their estimations based on ARIMA, the Brock–Dechert–Scheinkman–LeBaron (BDSL) test as well as asymmetric GARCH models indicated that the daily return volatility exhibits significant conditional heteroskedasticity and non-linear effects. The GARCH models provided the explanation by symmetric and asymmetric, but it was not significant enough for predicting future volatility. Moreover, estimating the behaviour of stock returns in the case of the CEE stock markets mainly concerned with the relationship between returns and conditional volatility was conducted by Okicic (2015). The findings provided parsimonious approximations of conditional mean and volatility dynamics in daily return series based on the ARIMA and GARCH specifications, and the author demon- strated that there was a strong evidence of the existence of a leverage effect in the selected stock markets. In these CEE countries, based on weekly data,Kamisli et al. (2015)also identified the structure of conditional correlations between the stock markets returns as well as observed the volatility transmission between these countries. By using the constant conditional correlations GARCH (CCC-GARCH) models over the dynamic GARCH models, the results of this study have some keyfindings analogous toOkicic (2015). Thefindings imply that most of the con- ditional correlations between stock markets returns of the selected nations are constant. This means that markets do interact with each other regarding shocks and volatility. Two other studies examined linkages and volatility spillovers in equity markets using the GARCH types model.Dedi–Yavas (2016)focused on thefinancial markets of Germany, the United Kingdom, China, Russia, and Turkey, whileYavas– Dedi (2016)conducted their research in Germany, Austria, Poland, Russia and Turkey. Both studies utilised Exchange Traded Funds (ETFs) instead of the benchmark indices that were mostly used in the literature. This was because ETFs had undergone dramatic growth and become the preferred mediums of investment for hedge funds and institutional investors. Moreover, the advantage of applying the ETF data was that it allowed the mitigation of certain critical issues that emerged in traditional academics, such as the volatility of exchange rates, diversities in stock exchange trading times, bank holidays and re- strictions on cross-border trading and investments. Thefindings ofDedi–Yavas (2016)indi- cated that the existence of significant co-movements of returns and evidence of volatility between them, whereas Russia and Turkey exhibited the highest volatility. Further, the lowest volatility occurred in the markets of the UK and China. Similarly, Yavas –Dedi (2016) also confirmed that there was strong evidence of volatility spillovers and the existence of significant co-movement of return among these countries; mainly, the Russian and Turkish markets were more volatile than Austria. As a matter of fact, the results of the volatility transmission and the time-varying nature of volatility provided an explanation for the implications for those investors and portfolio managers who evaluated such information and rebalanced their portfolios to finally achieve efficient portfolio diversification. In addition, there were significant implications concerning the European Neighbourhood Policies (ENPs), entailing that if the ENP implements different kinds of programs that continue to bear fruit, it may possibly result in greater inte- gration of the equity markets of the EU and the border countries. Also, ENP might create increased volatility transmissions among the highly connected markets. As a result, the investors desiring to diversify their portfolios might choose the market elsewhere in which these do not
move together. However, the limitation of using ETFs had not been around long enough to be tested for crisis situations.
Though there is a vast amount of literature on volatility spillover across markets, only a few of them have mentioned the effect of the financial crisis on equity market integrations. The 1987 European market crisis was studied by, e.g.Arshanapalli–Doukas (1993), Koutmos–Booth (1995),Meric –Meric (1997). Some research studied the Russianfinancial crisis such as, e.g.
Patev et al. (2006), Diebold–Yilmaz (2009); and the 1997 Asian financial crisis, e.g. Arsha- napalli et al. (1995), Jang – Sul (2002), Karunanayake et al. (2010). More recently, Sidek – Abdul-Rahman (2011),Srivastava et al. (2015),Bae–Zhang (2015),Maghyereh et al. (2015),Jin –An (2016),Jebran et al. (2017), Bajo-Rubio et al. (2017),Latinovic et al. (2018) investigated stock market integration in the 2007financial crisis period. The globalfinancial crisis of 2007– 2009 and its influence across financial markets have stimulated a considerable interest in the analyses of stock market volatility spillovers. Most of thosefindings reveal that the stock markets have grown more substantially integrated into the postfinancial crisis period.
In general, although the literature review summarised above proved that dynamic in- teractions exist between stock markets as well as market integration after the financial crisis period; there is still a need to carry out investigation into the Frontier and emerging markets of CEE in the financial crisis period.
3. METHODOLOGY
3.1. The multivariate EGARCH model
A rich empirical investigation exists on the examination of the asymmetric volatility spillovers between financial markets. In this study, I adopt the model of EGARCH to analyse a financial time series to monitor volatility spillover effects. The multivariate EGARCH model is employed so as to examine market interdependence and volatility transmission between stock markets in different countries. The simple GARCH model enforces a symmetric effect of volatility (positive shocks) and is not able to capture asymmetric shocks (negative shocks) because of the condi- tional variance being a function of the lagged residuals and not their signs (Jebran et al. 2017, Hung 2018). The EGARCH specification is suitable for the study of volatility spillover effects because it is able to capture the contemporaneous correlation between the stock indices under study (Jane–Ding 2009). Additionally, the EGARCH modelling is applied to test whether the volatility spillover effects are asymmetric. Furthermore,Koutmos–Booth (1995) put forward that the model captures the asymmetric effect of negative and positive returns on the conditional variance, and thus, allows the news generated in one market to be evaluated in term of size and sign by the next market to trade. Therefore, numerous empirical studies are conducted based on the EGARCH framework to specify volatility spillovers between differentfinancial markets in different countries (e.g.Koutmos–Booth 1995;Jebran et al. 2017;Okicic 2015;Sok-Gee et al.
2010;Bhar–Nikolova 2009;Mishra et al. 2007;Yang–Doong 2004;Elyasiani–Mansur 2017).
In this paper, I apply the EGARCH (1,1) model to examine the transmission mechanism of volatility betweenfivefinancial markets in CEE. The EGARCH specification byNelson (1991) may be represented as follows:
The conditional mean equation is:
Ri;t¼ai;0þX5
j¼1
ai;j«j;t−1þ«i;t; for i;j¼1;5 (1)
The conditional variance equation is:
σ2i;t¼exp (
bi;0þX5
j¼1
di;jfi zj;t−1
þgiln
σ2i;t−1)
; for i;j¼1;5 (2)
The asymmetric transmission of shock from marketjto marketiis denoted as:
fj zj;t−1
¼
jzj;t−1j Eðjzj;t−1j
þ
f
jzj;t−1Þ; for i;j¼1;5 (3)where relative asymmetry measured by the conditional covariance specification is:
σi;j;t¼ri;jσi;tσj;t; for i;j¼1;5 and i≠j (4)
The functionfigenerates sequences of zero mean, identically and independently distributed random variables by construction and allowing past standardised innovations to affect asym- metrically. The termjzj;t−1j−Eðjzj;t−1jÞin Eq. (3) captures the size effect and the term
f
jzj;t−1measures the sign effect. When
f
jis negative it will increase the volatility by more than a positive realisation of equal magnitude. Similarly, if the past absolute value ofzt is greater than its ex- pected value, the ongoing volatility will rise. This effect is referred to as leverage effect and is pointed out byNelson (1991).I summarise each of the relevant terms in Eqs. (1)–(4) inTable 1.
The termP5
j¼1di;jfiðzj;t−1Þis defined in Eq. (2) and partial derivatives are:
vfj zj;t
vzj;t ¼1þ
f
j; if zj>0 and; vfjzj;t
vzj;t ¼−1þ
f
j; if zj<0Asymmetric is demonstrated if
f
jis negative and statistically significant. A significant positive di;jcouples with a negativef
jimplies that negative innovation in marketjhave a higher impact on the volatility of market i than positive innovations (Koutmos – Booth 1995). Relative asymmetry is defined asj−1þf
ij=ð1þf
iÞ. This quantity is greater than, equal to, or less than 1 for negative asymmetry, symmetry and positive asymmetry respectively (Bhar – Nikolova 2009). The conditional correlations are presupposed to be constant over time (Bollerslev 1990).With the assumption that the conditional joint distribution of the returns of five markets are normal and given a sample of T observations, the log-likelihood function of a multivariate EGARCH model can be expressed as:
LðQÞ ¼ 1
2
ðNTÞlnð2pÞ 1
2 XT
i¼1
lnjStj þ«0tS−1t «t
(5)
where N is the number of equations, Q is the parameter vector to be estimated,
«0t¼ ð«1;t;«2;t;«3;t;«4;t;«5;tÞis the 135 vector of innovations at time t, St is the 535 time
varying conditional variance-covariance matrix with diagonal elements are given by Eq. (4). The log-likelihood function is estimated using theBerndt et al. (1974)algorithm.
The procedures of this research are conducted in the following four stages (Tsay 2005): (i) conducting the unit root test for relevant variables to make sure that all variables are stationary series; (ii) identifying and estimating an autoregressive and moving average (ARMA) model for the mean equation, using the residuals of the mean equation to test for the ARCH effect; (iii) estimating the EGARCH model for volatility spillover and (iv) checking the robustness of the estimation. The study uses the Eview 8.0 in order to estimate the EGARCH (1,1) model.
3.2. Data
Data used in this paper consists of time series of daily stock market indexes at the close of the markets in five CEE countries. I take daily data covering the period from 1st April, 2000 to 29th September, 2017, in terms of local currency in order that all indices are in domestic currency to avoid problems associated with transformation because of fluctuations in exchange rates (Gupta –Guidi 2012). The key points of this study are to make comparisons of the changes as well as to show the interrelation and volatility spillovers amongfive financial markets before and after 2007sfinancial crisis period. Therefore, the entire investigation period is subdivided into two Table 1.Description of parameters Eqs. (1)–(4)
Explanation Parameters
Continuous compounding returns of the stock index Ri;t
Constant ai;0
Extend for price spillover across markets ai;j
Stochastic error terms «i;t
Allow for autocorrelation in the return due to non-synchronous trading (Hamao et al. 1990)
ai;j«j;t−1
Standardised residuals assumed to be normal distribution with zero mean and varianceσ2i;t
zi;t¼σ«i;ti;t
Size effect jzj;tj−Eðjzj;tjÞ
Persistence of volatility gi
Volatility spillover from the respective stock market to the stock market under consideration
di;j
Constant level of volatility bi;0
Asymmetric effect of volatility fj
Correlation coefficient of standardised residuals ri;j
Conditional covariance σi;j;t
Note: Persistence of volatility in which the unconditional variance isfinite ifgj<1 and ifgj¼1, then the unconditional variance does not exist and the conditional variance follows an integrated process of order one.
sub-periods: pre-crisis period: 1st April, 2000 to 29th August, 2008, and post-crisis period: 1st September, 2008 to 29th September, 2017. The number of observations across the market is 4,013, which is less than the total number of observations because joint modelling of five markets requires matching returns.
The reason for collecting daily data is to receive more precise information about the changes in stock prices than doing with weekly or monthly data and better able to capture the dynamics between variables (Agrawal et al. 2010). The data for the empirical investigation is obtained from Bloomberg through the Department of Finance, Corvinus University of Budapest. The reason why I choose these markets is that these capital markets are known as Frontier markets and emerging markets, so the emerging and Frontier capital markets have vastly different charac- teristics than the developed capital markets. Primary features of the emerging and Frontier market are that the average returns are higher, correlations with the developed market returns are low, returns are more predictable, and volatility is higher (Bekaert–Harvey 1997). The daily return data series are calculated asRt 5100 3 ln (Pt/Pt1), wherePt is the price level of the market at timet. The logarithmic stock returns are multiplied by 100 to approximate percentage changes and avoid convergence problems in estimation.
4. EMPIRICAL FINDINGS
4.1. Preliminary statistics
Table 2depicts summary statistics for the daily returns offive markets as well as statistics testing for normality, unit root and ARCH test for both sub-periods. The analyses show that sample means of stock returns are positive and significantly different from zero forfive countries over the study period except for the Czech Republic and Croatia in the post-crisis period. The Romanian stock market has the highest daily average return of 0.12% in the pre-crisis period, and the figure for Hungarian market is 0.02% in the post-crisis period. On average, the stock displays a negative return0.0159% for the Czech Republic and0.0309% for Croatia in the post-crisis period, mostly because of the effects of the recent global crises and the Eurozone turmoil. The unconditional volatility of stock markets is measured by standard deviations. The sample variances range from 1.36% for the Czech Republic to 1.76% for Romania in the pre- crisis period, and 1.25% for Croatia to 1.70% in the post-crisis respectively. The measures for skewness and excess kurtosis indicate that all return series are skewed and highly leptokurtic with respect to the normal distribution. This is formally confirmed by the Jarque–Bera test statistics. In the next step, the stationarity of the data is tested. All stock return series are found to be stationary at level (i.e. I(0)) at the 1% significance level according to the PP and ADF statistics for both sub-periods. Similarly, the ARCH effect illustrates the presence of autocor- relation and heteroskedasticity issues in the data. The result shows that there is a strong evidence of the existence of ARCH effect in all concerned series. Hence, modelling the EGARCH model can successfully capture the price volatility interaction between the financial markets.
The raw series are plotted inFigure 2where stock market returns infive countriesfluctuate. I observed that all the five stock markets follow similar movements over the study period.
Nevertheless, all the concerned variables present a downward trend after the eruption of the subprimefinancial crisis. The downward trend reveals that the subprimefinancial crisis affected thefinancial performance of the indices.
I present the sample correlations for all markets inTable 3. The highest correlation I canfind is between Poland and the Czech Republic (0.690), followed by the correlation between Hungary and the Czech Republic (0.602) in the post-crisis period. On the other hand, the correlation between Poland and the Czech Republic is (0.248) in the pre-crisis period. In general, the Table 2.Descriptive statistics of daily return of stock indices
Countries Hungary Poland Czechia Romania Croatia
Panel A. Pre-crisis period
Mean 0.0450 0.0377 0.0550 0.1220 0.0778
Median 0.0208 0.0326 0.1013 0.1155 0.0645
Maximum 9.4805 6.6392 8.0836 14.576 14.978
Minimum 6.8735 8.4678 7.8757 9.7428 9.0232
Std. Dev 1.4857 1.3834 1.3627 1.7648 1.4109
Skewness 0.1670 0.1929 0.2845 0.1607 0.5071
Kurtosis 5.0120 5.2244 5.9688 9.9593 15.465
Jarque–Bera 327.24* 400.96* 718.87* 3818.1* 12304*
PP test 42.191* 42.043* 42.333* 38.909* 42.077*
ADF test 42.195* 41.915* 42.324* 38.737* 42.054*
ARCH test 11.287* 4.221** 18.431* 94.118* 104.82*
Panel B. Post-crisis period
Mean 0.0278 0.0218 0.0159 0.0163 0.0309
Median 0.0465 0.0554 0.0233 0.0504 0.0047
Maximum 22.016 8.4639 12.364 10.564 14.778
Minimum 14.985 8.2888 19.901 14.754 14.587
Std. Dev 1.7085 1.2903 1.5844 1.6108 1.2508
Skewness 0.3525 0.3405 1.2358 1.0197 0.6072
Kurtosis 23.391 9.5029 27.580 17.187 27.580
Jarque–Bera 36825* 3781.7* 53986* 18174* 75053*
PP test 45.349* 42.929* 44.718* 44.696* 43.424*
ADF test 45.340* 33.826* 35.777* 44.713* 25.497*
ARCH test 92.763* 90.151* 360.76* 300.03* 300.45*
Notes: *, ** denotes significance at the 1 and 5% level, respectively. All returns are expressed in percentages.
ADF and PP tests represent the augmented Dickey–Fuller test and Phillips–Perron test of stationarity respectively.
ARCH test is employed to test the presence of ARCH effect in the data sets.
Source: Own calculations.
Figure 2. Plots of the stock indices for the sample pre- and post-crisis periods Source: Own research.
correlation coefficients amongfinancial markets have an upward trend after the eruption of the subprimefinancial crisis.
4.2. Price and volatility spillovers
In order to find price and volatility spillover under the EGARCH framework, estimating the system of Eqs. (1)–(5) based on the maximum likelihood is the final step. The results of the extended EGARCH model are estimated inTable 4(pre-crisis period) andTable 5(post-crisis period). In terms of the mean equations for the stock returns offive countries show that there are significant own lagged price spillovers in the stock market of Romania over the study period.
On the other hand, in the case of Poland, the own lagged return spillovers were only statistically significant in the pre-crisis period, while the Czech Republic was in the post-crisis period. The analysis of the individual country in CEE for mean returns found that the Hungarian stock market is influenced by the returns in the stock market from Poland in sub-periods. This phenomenon is similar to the case of Croatia affected by the stock market of Romania. These results are consistent withScheicher (2001). The price movement in the Czech Republic has a positive impact on the stock market of Romania in the pre-crisis period and negative influence on the Croatian stock market in the post-crisis period respectively. Particularly, the Croatian stock market seems to be affected by the price movements of the stock markets in the Czech Republic and Romania in the post-crisis period and Hungary in the pre-crisis period, while in the post-crisis, price spillover from Romania to Poland is significant. Furthermore, the bidi- rectional relationship in market returns also appears between Romania and Hungary, Romania and the Czech Republic, Croatia and Hungary in the post-crisis period as indicated byTable 5.
These results reveal that rapid growth in international financial stock markets has become substantially more integrated in the post-crisis period. This remarkable result is compatible with the investigation ofJebran et al. (2017).
Turning to volatility spillover (second moment interdependencies), the estimation results of the EGARCH model represent the conditional variance in each market affected by innovations coming at least from one of the other five markets in the two sub-periods. Specifically, there are significant volatility spillovers from Croatia to Poland and from Poland to the Czech Republic during two periods. In addition, the result reveals bidirectional volatility spillover between the Table 3.Unconditional correlation coefficients in both periods
Hungary Poland Czechia Romania Croatia
Hungary 1.000 0.602 (0.507) 0.612 (0.237) 0.188 (0.117) 0.418 (0.175)
Poland 1.000 0.690 (0.248) 0.170 (0.136) 0.472 (0.209)
Czech 1.000 0.190 (0.120) 0.567 (0.119)
Romania 1.000 0.173 (0.128)
Croatia 1.000
Note: Numbers in parentheses are correlation coefficient in the pre-crisis period.
Source:Own calculations.
Czech Republic and Croatia in the pre-crisis period, and between Hungary and Romania in the post-crisis period. This result is also supported byOkicic (2015)for the period from October 2005 to December 2013.
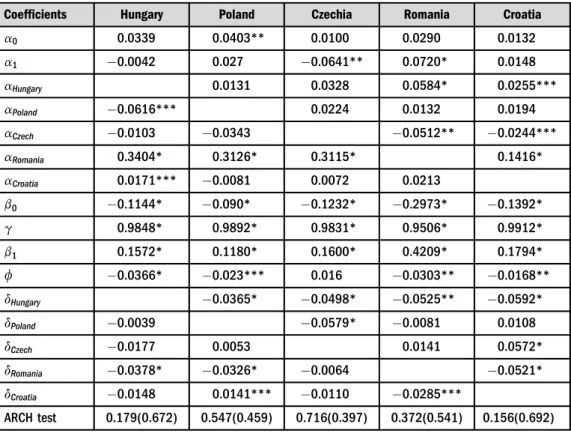
Similarly, it can be seen from the significant coefficient of the parameterdithat the volatility spillover comes from thefinancial markets in the post-crisis period, but having non-persistence in the pre-crisis period, for instance, Romania to Hungary, Romania to Poland, Hungary to the Czech Republic, Hungary to Romania, Croatia to Romania, Hungary to Poland, the Czech Republic to Croatia, Hungary to Croatia and Romania to Croatia. This suggests that the financial crisis has a huge influence on the association between financial stock markets, and financial integration dramatically increases in the crisis situations. This result tallies with Kamisli et al. (2015). Differently, there is a strong evidence of the volatility spillover from the financial stock markets to the other stock markets in the pre-crisis period, but having the absence in the post-crisis period, namely the Czech Republic to Hungary, Romania to the Czech Republic, Croatia to the Czech Republic and Poland to Romania.
Table 4. Volatility spillover in the pre-crisis period
Coefficients Hungary Poland Czechia Romania Croatia
a0 0.0578*** 0.0676** 0.0908* 0.1050* 0.1007*
a1 0.0271 0.1063** 0.0350 0.1891* 0.0384
aHungary 0.0249 0.0168 0.0030 0.0505***
aPoland 0.0737*** 0.0341 0.0050 0.0269
aCzech 0.0439 0.0095 0.0541*** 0.0324
aRomania 0.0047 0.0217 0.0344 0.0756*
aCroatia 0.0121 0.0094 0.0098 0.0034
b0 0.0183 0.0572* 0.0980* 0.1768* 0.1992*
g 0.9204* 0.9753* 0.9360* 0.9353* 0.8764*
b1 0.0979* 0.0909* 0.1626* 0.3230* 0.3549*
f 0.0625* 0.0203*** 0.0786* 0.0246** 0.0096
dHungary 0.0208 0.0163 0.0026 0.0047
dPoland 0.0122 0.0358** 0.0810* 0.0006
dCzech 0.0284** 0.0125 0.0143 0.0906*
dRomania 0.0120 0.0027 0.0510* 0.0103
dCroatia 0.0025 0.0023** 0.0039* 0.0080
ARCH test 0.180(0.671) 2.652(0.103) 3.146(0.076) 0.717(0.397) 0.145(0.702)
Notes:Numbers in parentheses are the probability. *, **, ***denote significance at the 1, 5 and 10% level, respectively.
Source:Own calculations.
More importantly, the asymmetric parameters measured by
f
is statistically significant in all markets except with Croatia in the pre-crisis period and the Czech Republic in the post-crisis period. I can conclude that the volatility transmission mechanism is asymmetric; this result confirms the assertion that both the size of the innovations are crucial determinants of volatility spillovers. This result supportsBajo-Rubio et al. (2017)andJebran et al. (2017), who found that negative shocks have more significant impact than that of positive innovations in the emerging economies.In order to evaluate the robustness of the estimation results, I examined the ARCH effect on the standardised residuals of each model to determine whether the ARCH effect still exists in the model. The null hypothesis is that there is no ARCH effect (Tsay 2005). The results of the ARCH–LM testfind strong evidence that there is no ARCH effect for all series considered at 1%
significance level. Therefore, modelling the EGARCH specifications can successfully capture the price and volatility spillovers among thefinancial stock markets infive countries.
Table 5.Volatility spillover in the post-crisis period
Coefficients Hungary Poland Czechia Romania Croatia
a0 0.0339 0.0403** 0.0100 0.0290 0.0132
a1 0.0042 0.027 0.0641** 0.0720* 0.0148
aHungary 0.0131 0.0328 0.0584* 0.0255***
aPoland 0.0616*** 0.0224 0.0132 0.0194
aCzech 0.0103 0.0343 0.0512** 0.0244***
aRomania 0.3404* 0.3126* 0.3115* 0.1416*
aCroatia 0.0171*** 0.0081 0.0072 0.0213
b0 0.1144* 0.090* 0.1232* 0.2973* 0.1392*
g 0.9848* 0.9892* 0.9831* 0.9506* 0.9912*
b1 0.1572* 0.1180* 0.1600* 0.4209* 0.1794*
f 0.0366* 0.023*** 0.016 0.0303** 0.0168**
dHungary 0.0365* 0.0498* 0.0525** 0.0592*
dPoland 0.0039 0.0579* 0.0081 0.0108
dCzech 0.0177 0.0053 0.0141 0.0572*
dRomania 0.0378* 0.0326* 0.0064 0.0521*
dCroatia 0.0148 0.0141*** 0.0110 0.0285***
ARCH test 0.179(0.672) 0.547(0.459) 0.716(0.397) 0.372(0.541) 0.156(0.692)
Notes:Numbers in parentheses are the probability. *, **, ***denote significance at the 1, 5 and 10% level, respectively.
Source:Own calculations.
Briefly, there are notable differences of volatility transmission mechanism between financial stock markets in the two sub-periods. The remarkable results play a prominent role in shedding lights on how the integration between five financial stock markets varies from normal to tur- bulent periods. This is because the integration of stock markets was influenced by the subprime financial crisis period and the mutual relationship between five financial stock markets became more correlated during the financial crisis period. The findings are consistent withPatev et al.
(2006),Xuan Vinh Ellis (2018), andJebran et al. (2017).
5. CONCLUSION
I empirically formulate and estimate the volatility spillover by a multivariate EGARCH model of the daily stock markets returns for five emerging markets, namely Hungary, Poland, the Czech Republic, Romania and Croatia reflecting the outlook of investors in these countries. The model is employed to examine the first and second moment interdependencies among the various markets in the pre- and post-subprime financial crisis periods. The pre-crisis period covers from 1st April, 2000 to 29th August, 2008 and the post-crisis period is considered from 1st September, 2008 to 29th September, 2017. The volatility transmission mechanism is asymmetric, bad news in a given market increase volatility in the next market to trade considerably more than the positive innovations for the whole period. However, these results exclude the Croatian stock market in the pre-crisis period and the Czech Republic stock market in the post-crisis period.
The results reveal that volatility spillover varies from normal to turbulent periods. I found evidence of price spillovers of the intraregional linkages among the stock price movements in five CEE countries. For the second moment interactions, the results highlight certain interesting findings that the stock markets were more substantially integrated into a crisis. In addition, the persistence of volatility spillovers among the stock markets increases and the financial stock markets become more integrated after the crisis period.
This study has several important economic and financial implications for economic poli- cymakers and investors. In terms of price volatility, the increase in co-movement is significant since a global market shock might create excessive fluctuation in the emerging markets as they are more vulnerable to global shocks, and to lower commodity prices, they can experience a sudden acceleration of systematic risk through deteriorations in both the capital and currency crisis. Also, the process of globalisation and financial liberalisation is the primary factor to promote further international linkages. Therefore, investors should take into account of the price movements from the stock markets over the region in their investment strategies.
Moreover, Singhal – Ghosh (2016) suggest that investors tend to diversify their investment portfolio and hedging in order to maximise returns and minimise risks. Elyasiani – Mansur (2017) also provide a valuable channel of diversification for investors at the time of market distress as well as in making optional investment decision. Regarding volatility spillover, the integrations among financial markets suggest that investors would have low diversification opportunities. The research ofAhmed–Huo (2018)documented that market integration will provide several new opportunities to accelerate productivity and economic growth; new eco- nomic partnership will extend the region’s global competitiveness in attracting investment.
Investors in thefive CEE countries can also consider diversifying their investment strategies by following the integration of different financial markets. Furthermore, policymakers should
consider previous market condition and integration offinancial markets before implementing policy on the stock market because there are considerable impacts on thefinancial performance of the markets and the subprimefinancial crisis spillover from one market to other markets.
ACKNOWLEDGEMENT
The paper is based on Chapter 3 of my PhD thesis“Volatility Spillover of the Stock Market and Foreign Exchange Evidence from CEE Countries”, (2020). I would like to extend my sincere appreciation to my supervisor Barbara Maria D€om€ot€or, at Corvinus University of Budapest, for valuable comments and suggestions. I would like to thank two anonymous referees for constructive comments.
REFERENCES
Agrawal, G.–Srivastav, A. K.–Srivastava, A. (2010): A Study of Exchange Rates Movement and Stock Market Volatility.International Journal of Business and Management, 5(12): 62.
Ahmed, A. D.–Huo, R. (2018): China–Africa Financial Markets Linkages: Volatility and Interdepen- dence.Journal of Policy Modelling, 4(1): 25–38.
Alotaibi, A. R.–Mishra, A. V. (2015): Global and Regional Volatility Spillovers to GCC Stock Markets.
Economic Modelling, 45: 38–49.
Arshanapalli, B.–Doukas, J. (1993): International Stock Market Linkages: Evidence from the Pre- and Post-October 1987 Period.Journal of Banking & Finance, 17(1): 193–208.
Arshanapalli, B.–Doukas, J.–Lang, L. H. (1995): Pre- and Post-October 1987 Stock Market Linkages between US and Asian Markets.Pacific-Basin Finance Journal, 3(1): 57–73.
Bae, K. H.–Zhang, X. (2015): The Cost of Stock Market Integration in Emerging Markets.Asia‐Pacific Journal of Financial Studies, 44(1): 1–23.
Bajo-Rubio, O.–Berke, B.–McMillan, D. (2017): The Behaviour of Asset Return and Volatility Spillovers in Turkey: A Tale of Two Crises.Research in International Business and Finance, 41: 577–589.
Bala, D. A.–Takimoto, T. (2017): Stock Markets Volatility Spillovers during Financial Crises: A DCC- MGARCH with Skewed-T Density Approach.Borsa Istanbul Review, 17(1): 25–48.
Baum€ohl, E.–Kocenda, E.–Lyocsa,S.–Vyrost, T. (2018): Networks of Volatility Spillovers among Stock Markets.Physica A: Statistical Mechanics and its Applications, 490C: 1555–1574.
Bekaert, G.–Harvey, C. R. (1997): Emerging Equity Market Volatility.Journal of Financial Economics, 43(1): 29–77.
BenSaı€da, A.–Litimi, H.–Abdallah, O. (2018): Volatility Spillover Shifts in Global Financial Markets.
Economic Modelling, 73C: 343–353.
Berndt, E. R.–Hall, B. H.–Hall, R. E.–Hausman, J. A. (1974): Estimation and Inference in Nonlinear Structural Models.Annals of Economic and Social Measurement, 3(4): 653–665.
Bhar, R.–Nikolova, B. (2009): Return, Volatility Spillovers and Dynamic Correlation in the BRIC Equity Markets: An Analysis Using A Bivariate EGARCH Framework.Global Finance Journal, 19(3): 203–218.
Bollerslev, T. (1990): Modelling the Coherence in Short-Run Nominal Exchange Rates: A Multivariate Generalized ARCH Model.The Review of Economics and Statistics, 72(3): 498–505.
Caloia, F. G.–Cipollini, A.–Muzzioli, S. (2018): Asymmetric Semi-Volatility Spillover Effects in EMU Stock Markets.International Review of Financial Analysis, 57: 221–230.
Dedi, L.–Yavas, B. F. (2016): Return and Volatility Spillovers in Equity Markets: An Investigation Using Various GARCH Methodologies. Cogent Economics & Finance, 4: 1–18. https://doi.org/10.1080/
23322039.2016.1266788.
Diebold, F. X. – Yilmaz, K. (2009): Measuring Financial Asset Return and Volatility Spillovers, with Application to Global Equity Markets.The Economic Journal, 119(534): 158–171.
Elyasiani, E. – Mansur, I. (2017): Hedge Fund Return, Volatility Asymmetry, and Systemic Effects: A Higher-Moment Factor-EGARCH Model.Journal of Financial Stability, 28: 49–65.
Engle, R. F.–Ng, V. K.–Rothschild, M. (1990): Asset Pricing with a Factor ARCH Covariance Structure:
Empirical Estimates for Treasury Bills.Journal of Econometrics, 45(1): 213–237.
Gamba-Santamaria, S.–Gomez-Gonzalez, J. E.–Hurtado-Guarin, J. L. –Melo-Velandia, L. F. (2017):
Stock Market Volatility Spillovers: Evidence for Latin America.Finance Research Letters, 20: 207–216.
Ghouse, G.–Khan, S. A. (2017): Tracing Dynamic Linkages and Spillover Effect between Pakistani and Leading Foreign Stock Markets.Review of Financial Economics, 35C: 29–42.
Gupta, R.–Guidi, F. (2012): Cointegration Relationship and Time Varying Co-Movements among Indian and Asian Developed Stock Markets.International Review of Financial Analysis, 21: 10–22.
Hamao, Y.–Masulis, R. W.–Ng, V. (1990): Correlations in Price Changes and Volatility across Inter- national Stock Markets.The Review of Financial Studies, 3(2): 281–307.
Hung, N. T. (2018): Dynamics of Volatility Spillover Between Stock and Foreign Exchange Market:
Empirical Evidence from Central and Eastern European Countries.Conference Proceedings of ECMS 2018, Wilhelmshaven, Germany, May 22–25, 2018, pp. 27–34.https://doi.org/10.7148/2018-0027.
Huo, R. – Ahmed, A. D. (2017): Return and Volatility Spillovers Effects: Evaluating the Impact of Shanghai-Hong Kong Stock Connect.Economic Modelling, 61C: 260–272.
Jane, T. D.–Ding, C. G. (2009): On the Multivariate EGARCH Model.Applied Economics Letters, 16(17):
1757–1761.
Jang, H. – Sul, W. (2002): The Asian Financial Crisis and the Co-Movement of Asian Stock Markets.
Journal of Asian Economics, 13(1): 94–104.
Jebran, K.–Chen, S.–Ullah, I.–Mirza, S. S. (2017): Does Volatility Spillover among Stock Markets Varies from Normal to Turbulent Periods? Evidence from Emerging Markets of Asia.The Journal of Finance and Data Science, 3(1–4): 20–30.
Jin, X.–An, X. (2016): Global Financial Crisis and Emerging Stock Market Contagion: A Volatility Impulse Response Function Approach.Research in International Business and Finance, 36C: 179–195.
Joshi, P. (2011): Return and Volatility Spillovers Among Asian Stock Markets.Sage Open, 1(1): 1–8.
Lahrech, A.–Sylwester, K. (2011): US and Latin American Stock Market Linkages.Journal of International Money and Finance, 30(7): 1341–1357.
Latinovic, M.–Bogojevic Arsic, V.–Bulajic, M. (2018): Volatility Spillover Effect in the Case of Western Balkans.Acta Oeconomica, 68(1): 79–100.
Lau, C. K. M.–Sheng, X. (2018): Inter- and Intra-Regional Analysis on Spillover Effects across Interna- tional Stock Markets.Research in International Business and Finance, 1–10.https://doi.org/10.1016/j.
ribaf.2018.04.013.
Kamisli, M.–Serap Kamisli, S. –Ozer, M. (2015): Are Volatility Transmissions between Stock Market Returns of Central and Eastern European Countries Constant or Dynamic? Evidence from MGARCH Models. Conference Proceedings of 10th MIBES Conference, 15–17 October 2015, Larisa, Greece, pp.
190–203.
Karunanayake, I.–Valadkhani, A.–O’Brien, M. (2010): Financial Crises and International Stock Market Volatility Transmission.Australian Economic Papers, 49(3): 209–221.
Kim, B. H.–Kim, H.–Lee, B. S. (2015): Spillover Effects of the US Financial Crisis on Financial Markets in Emerging Asian Countries.International Review of Economics & Finance, 39: 192–210.
Ko, K. S.–Lee, S. B. (1991): A Comparative Analysis of the Daily Behavior of Stock Returns: Japan, the US and the Asian NICS.Journal of Business Finance & Accounting, 18(2): 219–234.
Koutmos, G.–Booth, G. G. (1995): Asymmetric Volatility Transmission in International Stock Markets.
Journal of International Money and Finance, 14(6): 747–762.
Maghyereh, A. I.–Awartani, B.–Al Hilu, K. (2015): Dynamic Transmissions between the US and Equity Markets in the MENA Countries: New Evidence from Pre- and Post-Global Financial Crisis. The Quarterly Review of Economics and Finance, 56: 123–138.
Mensi, W.–Boubaker, F. Z.-Al–Yahyaee, K. H.–Kang, S. H. (2018): Dynamic Volatility Spillovers and Connectedness between Global, Regional, and GIPSI Stock Markets.Finance Research Letters, 25: 230–
238.
Meric, I.–Meric, G. (1997): Co-Movements of European Equity Markets before and after the 1987 Crash.
Multinational Finance Journal, 1(2): 137–152.
Mishra, A. K.–Swain, N.–Malhotra, D. K. (2007): Volatility Spillover between Stock and Foreign Ex- change Markets: Indian Evidence.International Journal of Business, 12(3): 343–359.
Morales-Zumaquero, A.–Sosvilla-Rivero, S. (2018): Volatility Spillovers between Foreign Exchange and Stock Markets in Industrialized Countries.The Quarterly Review of Economics and Finance, 70C: 121–
136.https://doi.org/10.1016/j.qref.2018.04.013.
Murinde, V.–Poshakwale, S. (2001): Volatility in the Emerging Stock Markets in Central and Eastern Europe: Evidence on Croatia, Czech Republic, Hungary, Poland, Russia and Slovakia. European Research Studies, 4(3–4): 73–101.
Naresh, G.–Vasudevan, G.–Mahalakshmi, S.–Thiyagarajan, S. (2018): Spillover Effect of US dollar on the Stock Indices of BRICS.Research in International Business and Finance, 44: 359–368.
Natarajan, V. K.–Singh, A. R. R. –Priya, N. C. (2014): Examining Mean-Volatility Spillovers Across National Stock Markets.Journal of Economics Finance and Administrative Science, 19(36): 55–62.
Nath Mukherjee, K.–Mishra, R. K. (2010): Stock Market Integration and Volatility Spillover: India and its Major Asian Counterparts.Research in International Business and Finance, 24(2): 235–251.
Nelson, D. B. (1991): Conditional Heteroskedasticity in Asset Returns: A New Approach.Econometrica:
Journal of the Econometric Society, 59(2): 347–370.
Okicic, J. (2015): An Empirical Analysis of Stock Returns and Volatility: The Case of Stock Markets from Central and Eastern Europe.South East European Journal of Economics and Business, 9(1): 7–15.
Panton, D.–Lessig, V.–Joy, O. (1976): Co-Movement of International Equity Markets: A Taxonomic Approach.The Journal of Financial and Quantitative Analysis, 11(3): 415–432.https://doi.org/10.2307/
2330417.
Patev, P.–Kanaryan, N.–Lyroudi, K. (2006): Stock Market Crises and Portfolio Diversification in Central and Eastern Europe.Managerial Finance, 32(5): 415–432.
Scheicher, M. (2001): The Co-Movements of Stock Markets in Hungary, Poland and the Czech Republic.
International Journal of Finance & Economics, 6(1): 27–39.
Shields, K. K. (1997): Threshold Modelling of Stock Return Volatility on Eastern European Markets.
Economics of Planning, 30(2–3): 107–125.
Sidek, N. Z. M.–Abdul-Rahman, A. (2011): Spill-over Effect of US Sub-Prime Crisis on ASEAN-5 Stock Markets.International Review of Business Research Papers, 7(3): 207–217.
Singh, P.–Kumar, B.–Pandey, A. (2010): Price and Volatility Spillovers across North American, European and Asian Stock Markets.International Review of Financial Analysis, 19(1): 55–64.
Singhal, S. –Ghosh, S. (2016): Returns and Volatility Linkages Between International Crude Oil Price, Metal and Other Stock Indices in India: Evidence from VAR-DCC-GARCH models.Resources Policy, 50C: 276–288.
Sok-Gee, C.–Karim, M. A.–Karim, M. A. (2010): Volatility Spillovers of the Major Stock Markets in ASEAN-5 with the US and Japanese Stock Markets. International Research Journal of Finance and Economics, 44: 161–172.
Srivastava, A.–Bhatia, S.–Gupta, P. (2015): Financial Crisis and Stock Market Integration: An Analysis of Select Economies.Global Business Review, 16(6): 1127–1142.
Tiwari, A. K.–Cunado, J.–Gupta, R.–Wohar, M. E. (2018): Volatility Spillovers across Global Asset Classes: Evidence from Time and Frequency Domains.The Quarterly Review of Economics and Finance, 70C: 194–202.https://doi.org/10.1016/j.qref.2018.05.001.
Tsay, R. S. (2005):Analysis of Financial Time Series. (vol. 543). John Wiley & Sons.
Xuan Vinh, V.–Ellis, C. (2018): International Financial Integration: Stock Return Linkage and Volatility Transmission between Vietnam and Other Advanced Countries.Emerging Markets Review, 36C: 19–27.
https://doi.org/10.1016/j.ememar.2018.03.007.
Yang, S. –Doong, S. (2004): Price and Volatility Spillovers Between Stock Prices and Exchange Rates:
Empirical Evidence from the G-7 Countries. International Journal of Business and Economics, 3(2):
139–153.
Yavas, B. F.–Dedi, L. (2016): An Investigation of Return and Volatility Linkages Among Equity Markets: A Study of Selected European and Emerging Countries.Research in International Business and Finance, 37C: 583–596.