Stress events in the Hungarian stock market
by Barbara Dömötör, Kata Váradi
C O R VI N U S E C O N O M IC S W O R K IN G P A PE R S
http://unipub.lib.uni-corvinus.hu/2202
CEWP 3 /201 6
1
STRESS EVENTS IN THE HUNGARIAN STOCK MARKET
Barbara Dömötör1
Corvinus University of Budapest, Department of Finance Kata Váradi23
Corvinus University of Budapest, Department of Finance
Budapest, 20.01.2016
Central clearing and the role of central counterparties (CCP) has gained on importance in the financial sector, since counterparty risk of the trading is to be managed by them. The regulation has turned towards them lately, by defining several processes, how CCPs should measure and manage their risk. Stress situation is an important term of the regulation, however it is not specified clearly, how stress should be identified. This paper provides a possible definition of stress event based on the existing risk management methodology: the usage of risk measure oversteps, and investigates the potential stress periods of the last years on the Hungarian stock market. According to the results the definition needs further calibration based on the magnitude of the cross-sectional data. The paper examines furthermore whether stress is to be predicted from market liquidity. The connection of liquidity and market turmoil proved to be contrary to the expectations; liquidity shortage was rather a consequence, than a forecaster phenomenon in the tested period.
Keywords: EMIR regulation, Value at Risk models, market liquidity measurement, stress definition
JEL classification: G18, G28, G32
1 e-mail:barbara.domotor@uni-corvinus.hu 2 e-mail: kata.varadi@uni-corvinus.hu
3 This research was supported by the European Union and the State of Hungary, co-financed by the European Social Fund in the framework of TÁMOP-4.2.4.A/ 211/1-2012-0001 ‘National Excellence Program’ for Kata Váradi.
2
1 INTRODUCTION
Trading with financial instruments on stock exchanges or on over-the-counter (OTC) markets used to differ in the management of counterparty risk. All trades on the organised markets are settled through a central counterparty, while the settlement of OTC trading used to be cleared bilaterally. Nowadays this difference is disappearing, due to the new market infrastructure regulation. Central counterparties, acting as trading partner in each trade, take over counterparty risk, namely the risk that one of the parties will not perform as promised. Since the counterparty risk is a notable risk category, CCPs should measure and manage their risk efficiently, in order to maintain the market’s financial stability, as bankruptcy of a CCP would have a serious effect on the whole financial sector. Consequently the new regulation: the Dodd-Frank Act in the USA, accepted by the United States Congress, and the European Market Infrastructure Regulation (EMIR, Regulation (EU) No. 648/2012 on OTC derivatives, central counterparties and trade repositories4) in the EU, accepted on 4th July, 2012 by the European Parliament and the Council, focuses the risk management of the CCPs with special care.
The focus of this paper is the EMIR regulation, since the analysed data stem from the Hungarian financial market. EMIR and its supplementation aim to ensure the prudence of the risk management procedure of the central counterparties, however in some cases EMIR is not specific enough, and doesn’t give an exact solution how to interpret some notions, like one of its key terms: the stress situation. The proper definition is important, as according to the regulation, the different applications of certain models are based on whether a financial stress is present on the market or not.
In this paper a definition for stress situation is presented, based on the results of the backtest of the applied risk measurement model, and the consequences of applying the definition is investigated on real market data of the Hungarian stock exchange, the Budapest Stock Exchange (BSE), in the after crisis period, between 2010 and 2013. We do not build a general stress index for the financial sector, or analyse the market under stress as Berlinger et al.
(2011), we just define stress based on the risk management system of a clearing house, since it is the most simplest and straightforward way to define stress. The general stress indices of the literature like the Kansas City Financial Stress Index (KCFSI) of Hakkio and Keeton (2009); Financial Stress Indicator of Canada (FSI) by Illing and Liu (2006); Composite Indicator of Systemic Stress (CISS) of Hollo et al. (2012); or the Financial Stability Index by Bordo et al. (2000) also could have been applied for defining stress event, but these general stress indices usually do not take into account the special features of the clearing industry5. Besides defining stress in this paper, we also analyse whether the identified stress events would have been predictable from the (il)liquidity of the market.
The paper is built up as following: the regulation and its elements referring to stress are introduced in the second section. The third section contains the risk and liquidity measurement methodology used in the model and the empirical research: the analysis of stress events and its co-movement with liquidity.
4 This regulation was supplemented by the European Commission on 19th December, 2012, with the Regulation (EU) No 153/2013, providing the technical standards of the EMIR regulation.
5 See Berlinger et al (2015).
3
2 THE REGULATION
The main risk, CCPs are facing, derives from the default of their clearing parties. For taking over this risk, CCPs apply a waterfall system of collateral elements that decreases their losses, if one of the parties fails to fulfil its obligations. The first component ensuring the performance of the trading parties is an initial margin, a certain amount of cash or cash- equivalent that is required to be placed by both parties - the seller and the buyer - of the trade.
As the definition of stress in the analysis is based on the shortfall of the initial margin, only this part of the collateral system is introduced in more details. The concept of determining its level is regulated by EMIR and the 153/2013 regulation.
2.1 Model of margin determination
The regulation says, that ‘a CCP shall calculate the initial margins to cover the exposures arising from market movements for each financial instrument that is collateralised on a product basis’ (Regulation 153/2013/EU, Article 24). The regulators do not define the models the CCPs shall use. The only limitations they give are the following:
1. CCP has to use a 99% confidence interval in case of financial instruments other than OTC derivatives, and 99.5% for OTC derivatives (Regulation 153/2013/EU, Article 24).
2. For estimating the model CCPs shall use the data at least of the latest 12 months’ data (Regulation 153/2013/EU, Article 25).
3. CCPs shall take into account the time horizon for the liquidation period, which shall be two days for financial instruments other than OTC derivatives, and five days for OTC derivatives (Regulation 153/2013/EU, Article 26).
The most widespread risk measure used also by the Basel rules – regulating financial institutions – is the Value-at-Risk (VaR), and because of its popularity and applicability for the purposes of the EMIR, it was applied by most of the CCPs, too. The features, shortcomings and alternatives of VaR are introduced in details in the next section.
2.2 Time horizon for historical volatility
The regulation requires a period of at least 12 months to be used to estimate the historical volatility. Besides that the regulation requires further specification in order to be prepared for even extreme market circumstances, by prescribing a ‘full range of market conditions, including periods of stress’ (Regulation 153/2013/EU, Article 25).
This means, that the definition of stress has an effect on the observation period the CCP shall use to calculate the model, and also on the calculated volatility and margin level.
2.3 Procyclicality
The financial crisis shed light on the possible procyclical effect of the risk management regulations in the financial sector. The models using more rigorous capital requirements in case of market turbulences contributed to the financial difficulties of the institutions and deepened even the crisis. Consequently the latest direction of the macroprudencial regulations aims to minimise that effect by applying anticyclical provisions.
4
That was formulated in Regulation 153/2013/EU: ‘A CCP shall ensure that its policy for selecting and revising the confidence interval, the liquidation period and the lookback period deliver forward looking, stable and prudent margin requirements that limit procyclicality to the extent that the soundness and financial security of the CCP is not negatively affected’
(Regulation 153/2013/EU, Article 28). To achieve this goal, the regulator requires the CCPs to use a margin buffer at least equal to 25%, when calculating margin in normal market conditions. On the other hand, in case of changing market conditions, which would cause an essential rise in the margin requirements, the CCP can disregard the margin buffer. This procedure is to be used in stress situation that depends on the definition of stress, also.
3 MODELLING STRESS
The present practice of most CCPs relies on the decision of the risk management committee when deciding about the existence of stress. Although this method provides flexibility that is necessary in crisis, it is suggested to define some objective criteria that give a signal when market may be regarded in stress.
As the risk measurement models are reviewed and tested on a daily basis, the results of these backtests are suggested to be used as a warning signal about stress. If the real market change exceeds the maximal movement based on the applied risk measure (VaR) for one or more main products, the situation is to be analysed further as stress situation is assumable.
3.1 Risk measuring models
A risk measure is defined as a function that assigns a scalar to a random variable quantifying a certain loss. In the models of the capital market, standard deviation is used to quantify risk, but for risk management purposes measures focusing on the downside outcomes are more appropriate.
Value-at-Risk (VaR) was defined by JP Morgan in the mid 90’s, as the maximum loss of the portfolio over a predefined time horizon (T) at a given significance level () under normal circumstances. VaR can be expressed either in absolute value or as a percentage of the portfolio value (Jorion, 2007). Because of its simplicity VaR was adopted by the whole financial sector, even though the regulation of the financial institutions – Basel Rules – uses it in the risk management systems, or in defining treasury trading limits (Walter, 2002), since it is easy to use and to understand. In order to calculate VaR, the probability distribution of the position in the certain security/portfolio at time T is to be modelled.
The (1-α)th percentile of this distribution shows the threshold value (K) the portfolio underperforms with a probability of (1-α) at time T (Jorion, 2007), as it is shown in Equation (1).
𝑃(𝑉𝑡< 𝐾) ≤ 1 − 𝛼 (1)
where the value of the position is V at time t.
5
Value-at-Risk is given as the difference of the actual value and the threshold.
There are 3 main concepts to calculate VaR: historical calculation, analytical method and Structured Monte Carlo Simulation (Jorion, 2007). In the framework of the historical method, the events of a chosen reference period are supposed to describe the potential future outcomes, so the whole distribution is given by them. The analytical method assumes the knowledge of the distribution, and as it is provided in most of the cases to be normal, this method is also called delta-normal method.
The third possibility to determine the distribution is simulation that can rely either on historical data or on the knowledge of the value generating process.
Although VaR is not a coherent risk measure, as it was presented by Artzner et al. (1999), and a coherent alternative6 was suggested by Acerbi and Tasche (2002), it is still the most commonly used risk measure in the financial sector. Even if EMIR does not restrict the circle of the applied risk measures to VaR, most CCPs use VaR for risk management, to measure their risk and to calculate margin requirements.
3.2 Measurement of liquidity
The predictability of financial difficulties or even crisis would be very important for both micro- and macroeconomic perspectives. As financial stress is often attended by liquidity shortages, the question arises, whether liquidity can be used as an indicator of the forthcoming stress.
The notion of liquidity has several interpretations, like the liquidity of a company, the liquidity of the whole financial system, or the liquidity of the market. In each different interpretation liquidity is to be measured differently and so the management of illiquidity risk differs too. This paper focuses on the concept of market liquidity that is defined by the Bank for International Settlements (BIS) as: ‘Liquid markets are defined as markets where participants can rapidly execute large-volume transactions with little impact on prices.’ (BIS, 1999)
The definition of liquidity suggests that its concept is very complex, there does not even exist a single best way to measure its value. A broad overview of liquidity indicators is provided by von Wyss (2004). The liquidity indicators can be grouped into three main categories (Csávás and Erhart, 2005): (1) indicators of transaction costs, (2) indicators of volumes, (3) indicators of prices.
The liquidity indicator used in the analysis is the Budapest Liquidity Measure (BLM), that is based on transactions cost, since it is a cost of roundtrip type of indicator. The first liquidity measure of this type was the Xetra Liquidity Measure (XLM) created by the Deutsche Börse Group in 2002, by Gomber and Schweikert (2002). The same measure was introduced on the Budapest Stock Exchange (BSE) under the name of Budapest Liquidity Measure (BLM) in 2005 (Kutas and Végh, 2005, Gyarmati et al. 2010). These liquidity measures are weighted spread measures that represent the implicit costs of trading, arising from the fact that actual trading is not executed at the mid-price.
6 Even coherent risk measures face risk allocation problems as presented in Csóka-Pintér (2016).
6
A simpler version of this liquidity measure is the relative spread, which can be computed according to Equation (2):
Ask tBid
t
tBid tAsk
t p p
p RSpread p
2
1 , (2)
where piAsk denotes the best ask, and ptBid the best bid price in the order book at time t. This measure displays the loss realized when buying and then immediately selling the same asset, relative to the mid-price (average of the best bid and ask price in the order book).
Basically, the BLM is a version of the relative spread measure. The difference is, that in case of the relative spread, only the best ask and bid price appear in the calculation, while in case of BLM we take into account that an order is not necessarily fulfilled on the best price levels.
The calculation of BLM is shown in Equation (3):
Mid t t
i
Bidi, Bid t
i, i t
Aski, Ask t
i, t
t p q
q p q
p
BLM
(3)
where pt,iAsk(Bid) shows the ith best price on the ask(bid) side at time t , whereas qt,iAsk(Bid)
denotes the depth of (the overall quantity submitted to) that same price level. piMid is the mid- price at time t.
An interpretation for the calculation of a BLM type liquidity measure is shown on Figure (1).
Figure 1: The Calcutation of the Liquidity Measure Source: Gomber and Schweikert (2002), p. 3.
In sum, the smaller these measures, the higher the liquidity of the asset.
The Budapest Stock Exchange calculates this measure every time when there is a change in the order book, and also on a daily basis. The daily BLM value is the average of the intraday
7
BLM data. The BSE publishes these daily data at the end of every month in order to provide information for the market.
3.3 Empirical test of stress
In order to test the suggested stress-definition, we took the real market data of the Budapest Stock Exchange. A daily risk measure (VaR) was calculated and stress signal was identified, if the market movement on the next day exceeded the VaR value.
The daily closing prices of the bluechip stocks of the Budapest Stock Exchange, namely, the OTP, MOL, Richter, MTelekom were used in the analyzed in a 4 years period, between January 2010 and December 20137. In finance the daily (log)return of financial assets are regarded to be a stationer random variable whose realisations derive from independent, identical distribution. Despite of some stylised facts (e.g. fat tail phenomena), daily logreturn is assumed to be normally distributed in most of the models. Following the literature, we calculate the daily logreturn (y) of the stocks, according to the Equation (4):
) ln(
1
t
t S t
y S (4)
where S denotes the stock price and the indices stand for the time.
The Value-at-Risk for each day is calculated according to the delta-normal method, the parameters of the return generating process are calculated as the average (µ) and standard deviation (σ) of the logreturns in the previous 250 days, as it is shown in Equation (5):
1(1 )
VaR (5)
where Φ-1 denotes the inverse of the cumulated distribution function of the standard normal distribution.
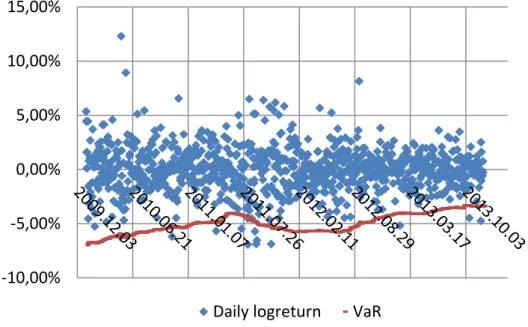
After having the logreturn and the VaR for every day, those days are to be investigated further, where the real price fall exceeds the VaR of the previous day that should happen in 1- α percent of the cases, as a consequence of the VaR-definition. The significance level (α) is 99%, as it is prescribed by EMIR. Figure (2) illustrates the calculation in case of MOL, the Hungarian Oil company, representing almost one third of the Hungarian stock market.
7 BSE calculated and published the daily BLM data only until December 2013, after switching to Xetra trading system, these data are not available.
8
The points below the red line show the days, when the negative price movement exceeded the maximal loss predicted by VaR with a probability of 99%. These days are to be examined further in order to decide about stress, according to our suggestion.
Figure 2: The daily logreturns and VaR of MOL between 2010 and 2013.
Source: calculation based on the data of BSE.
As the outlying points can be caused by company specific reasons, we searched for the outlying days for all 4 stocks, in order to find those periods, when more assets give a warning signal. According to the VaR model the number of the outlying days should sum up to 1 percent, so 10 days out of the 1000 working days during the period. We found 8-15 outliers for each of the tested group of stocks – the least, 8 in case of MTelekom, and the most, 15 in case of OTP. This result supports the applicability of the VaR model, as even in case of MOL, the difference is insignificant.
-10,00%
-5,00%
0,00%
5,00%
10,00%
15,00%
Daily logreturn VaR
9
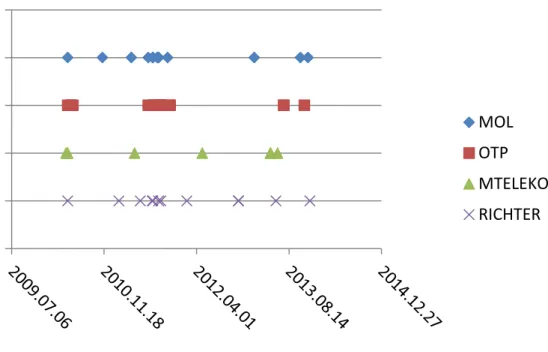
The potential stress days are depicted on Figure (3).
Figure 3: Stress signals of 4 Bluechips between 2010 and 2013.
Source: calculation based on the data of BSE.
The only date when all the 4 tested papers signalled, was the 6th of May 2010, when a sudden fall on the New York Stock Exchange due to technical problems caused worldwide market turbulences. Even then the market calmed down rapidly, so it is not reasonable to speak about a stress period.
Two other dates are worth investigating in the period, because 3 of the 4 stocks (except for MTelekom) signalled. The market fall of 8-9th of August 2011 was a consequence of global markets’ events. In September 2011 the possibility to pay back foreign denominated mortgage loan at out-of market exchange rate forced to the Hungarian banking sector caused the extreme price movement, but these days were also followed by some correction, that offset the losses of the previous market collapse. The further warning dates are triggered by single stocks, so they are not to be interpreted as stress period in the market. Based on the above, we can state, that the examined period of the last 4 years was characterised by quiet market movements and free of stress.
Even if we have not found evidence of a real stress, it is worth to analyse the market liquidity in the periods of the signalling days. For the purpose to quantify liquidity we used the daily value of the Budapest Liquidity Measure, for the same stocks and for the same time period as in the case of the daily logreturn calculation. The time series are given by the Budapest Stock Exchange. BLM refers to the cost of trading a certain amount, expressed in basis points, in the calculations we used the 20.000 euro BLM figures, referring to the cost of trading in that volume. The time series of BLM need to be differentiated also in order to get stationer data, consequently we calculated the daily change of BLM. As the liquidity shortage is indicated by
MOL OTP
MTELEKOM RICHTER
10
growing BLM figures, similarly to the stress calculation, we looked for those days, when the daily change exceeded the 99% maximum of the previous 1 year period. We had access to BLM figures from 2010, so the analysed time-series shortened to 3 years because of the reference period.
For the purpose to quantify liquidity we used the daily value of the Budapest Liquidity Measure, for the same stocks and for the same time period as in the case of the daily logreturn calculation. The time series derive from the Budapest Stock Exchange.
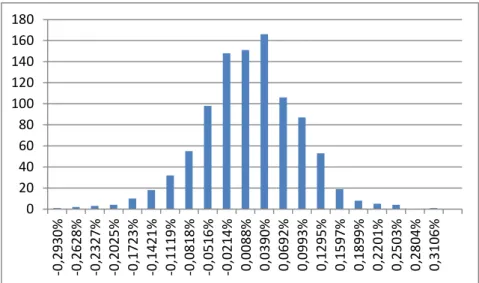
The delta normal method cannot be applied, since the daily differences of BLM are not normal, as shown on the example of MOL on Figure (4). The rejection of normality was confirmed by the Kolmogorov-Smirnov test also (with a p-value of 0,000).
Figure 4: Distribution of the daily BLM differences of MOL between 2010-2013.
Source: calculation based on the data of BSE.
Therefore, we applied the historical method to calculate Value-at-Risk characteristic risk measure for BLM. We took the 99% percentile of the data, and warning signal was defined as those days, when the daily change of BLM exceeded the 99% percentile of the previous 250 days.
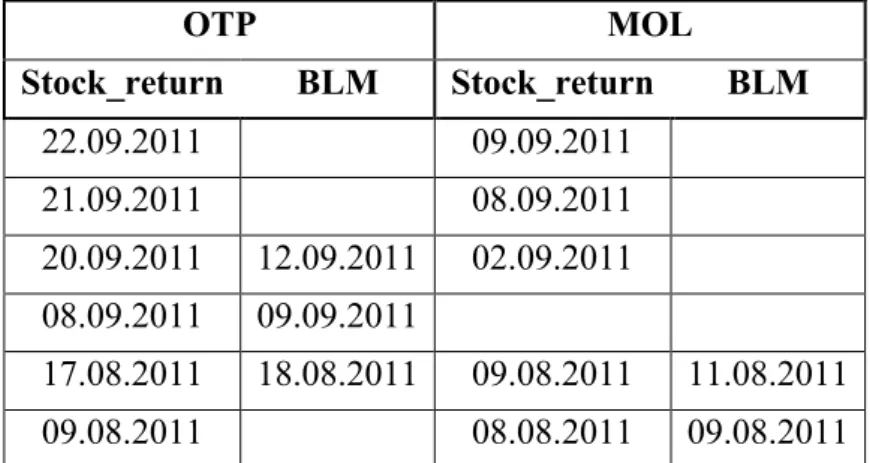
First, we examined the signals of the liquidity measure in the two periods – August and September 2011 - identified by stock returns.
0 20 40 60 80 100 120 140 160 180
-0,2930% -0,2628% -0,2327% -0,2025% -0,1723% -0,1421% -0,1119% -0,0818% -0,0516% -0,0214% 0,0088% 0,0390% 0,0692% 0,0993% 0,1295% 0,1597% 0,1899% 0,2201% 0,2503% 0,2804% 0,3106%
11
OTP MOL
Stock_return BLM Stock_return BLM
22.09.2011 09.09.2011
21.09.2011 08.09.2011
20.09.2011 12.09.2011 02.09.2011 08.09.2011 09.09.2011
17.08.2011 18.08.2011 09.08.2011 11.08.2011
09.08.2011 08.08.2011 09.08.2011
Table 1:Signalling dates of MOL and RICHTER between 2011-2013.
Source: calculation based on the data of BSE.
The BLM of RICHTER gave no signals at all, and MTELEKOM had no extreme price fall in the period, so only the stress dates of MOL and OTP are shown in Table 1. We can see, that merely about the half of the warning dates were accompanied by a liquidity signal, and even in these cases the liquidity measure signs followed the market fall, instead of predicting it. It seems as if market participants withdraw their orders after the price fall of the market and not the reduction of the order book causes the fall of the prices. The other warning signals of BLM in the period appeared independently from the extreme market movements.
An explanation of the results can be the lack of real stress in the analysed 4 years period, therefore the highest changes in price and liquidity are independent from each other.
4. CONCLUSION
Based on the recent direction of the regulation of financial markets and institutions, in this paper an objective reference for defining stress situation was suggested. As the empirical analysis showed, applying VaR oversteps as stress signals has also some subjective elements, and further investigation of the market is needed in order to decide whether a real stress exists or extreme movements were caused by individual events. There were 3 dates identified in the reference period, when at least 3 of the 4 analysed stocks alarmed for stress simultaneously.
The paper analysed furthermore the connection between the above defined stress signal and market liquidity. No strict connection of the price and liquidity movement was found. In contrast to the expectations, the liquidity shortage rather followed the extreme price changes, than predicted it. The market movements of the tested period – between 2010 and 2013 – proved to be very quiet that can explain the results.
12
REFERENCES
Acerbi, C., Tasche, D. (2002):.Expected Shortfall: A Natural Coherent Alternative to Value at Risk. Economic Notes 31 No. 2. July, pp. 379–388.
Artzner, P., Delbaen, F., Eber, J. M., Heath, D. (1999): Coherent Measures of Risk.
Mathematical Finance Vol. 9, No. 3. pp. 203–228.
Bank for International Settlements (1999): Market Liquidity: Research Findings and Selected Policy Implications. Committee on the Global Financial System, Publications, No. 11.
Berlinger, E., Dömötör, B., Illés, F., Váradi, K. (2015): How to define stress events in the practise of a clearing house? Conference paper, Hungarian Economic Association Conference, Budapest
Berlinger, E., Michaletzky, M., Szenes, M. (2011): The network dynamics of the Hungarian Interbank deposit market before and after the global liquidity crisis. Economic Review, Vol.58. No.3. pp. 229-252
Bordo, M.; Dueker M.J.; Wheelock, D.C. (2000): Aggregate price shocks and financial instability: an historical analysis. NBER Working Paper No. 7652.
Csávás, Cs., Erhart, Sz. (2005): Are the Hungarian Money Markets Liquid? – The Liquidity of the Foreign Currency- and the Government Security Market in Theory and in Practice.
Hungarian National Bank working paper No. 44.
Csóka, P., Pintér, M. (2016): On the impossibility of fair risk allocation. B E Journal of Theoretical Economics, Vol.16. No.1. pp. 143-158
Gomber, P., Shcweikert, U. (2002): The Market Impact – Liquidity Measure in Electronic Securities Trading. Die Bank, 7/2002.
Gyarmati, Á., Michaletzky, M. , Váradi, K. (2010): Liquidity on the Budapest Stock Exchange 20, 07-2010. Budapest Stock Exchange, working paper. Available at:
http://ssrn.com/abstract=1784324 Hakkio, C.S.; Keeton, W.R. (2009): Financial stress:
what is it, how can it be measured, and why does it matter? Economic Review, Vol.94.
No.2. pp. 5-50
Hollo, D.; Kremer, M.; Lo Duca, M. (2012): CISS-a composite indicator of systemic stress in the financial system.
Illing, M.; Liu, Y. (2006): Measuring financial stress in a developed country: An application to Canada. Journal of Financial Stability, Vol.2. No.3. pp. 243-265.
Jorion, P. (2007): Value at Risk. McGraw-Hill Companies, Inc. 3rd Edition.
Kutas, G., Végh, R. (2005): About the Introduction of the Budapest Liquidity Measure.
Economic Review, Vol.52, No.7. pp. 686-711
Von Wyss, R. (2004): Measuring and predicting liquidity in the stock market. Universität St.
Gallen, Dissertation.
Walter, Gy. (2002): Maximizing yield against a VaR limit system: the casino effect. Economic Review, Vol.49, No.3. pp. 212-234
13
Regulations:
European Market Infrastructure Regulation: Regulation (EU) No 648/2012 of the European Parliament and of the Council of 4 July 2012, on OTC derivatives, central counterparties and trade repositories.
http://eur-
lex.europa.eu/LexUriServ/LexUriServ.do?uri=OJ:L:2012:201:0001:0059:EN:PDF
Supplementation of EMIR: Commission Delegated Regulation (EU) No 153/2013 of 19 December 2012, supplementing Regulation (EU) No 648/2012 of the European Parliament and of the Council with regard to regulatory technical standards on requirements for central counterparties.
http://eur-
lex.europa.eu/LexUriServ/LexUriServ.do?uri=OJ:L:2013:052:0041:0074:EN:PDF