NGO THAI HUNG
VOLATILITY SPILLOVER OF THE STOCK MARKET AND FOREIGN EXCHANGE: EVIDENCE FROM CEE
COUNTRIES
Department of Finance
Supervisor: Barbara Maria Domotor, PhD
©Copyright- Ngo Thai Hung, 2020
Corvinus University of Budapest
Doctoral School of Business and Management
VOLATILITY SPILLOVER OF THE STOCK MARKET AND FOREIGN EXCHANGE: EVIDENCE FROM CEE
COUNTRIES
Doctoral Dissertation
Ngo Thai Hung
Budapest, 2020
i
TABLE OF CONTENTS
INTRODUCTION……….1
0.1 Background ...1
0.2 Overview ...3
LITERATURE OVERVIEW……….8
1.1 The flow-oriented model ...8
1.2 The stock-oriented model ...8
1.3 Volatility and its properties ...9
1.4 Volatility spillovers ...10
1.5 Volatility spillover in the CEE markets ...12
1.6 The EGARCH model ...13
1.7 Data ...19
1.8 Market characteristics ...20
THE DYNAMICS OF VOLATILITY SPILLOVER BETWEEN STOCK AND FOREIGN EXCHANGE MARKETS: EMPIRICAL EVIDENCE FROM CENTRAL AND EAST EUROPEAN COUNTRIES………29
2.1 Introduction ...30
2.2 Review of the literature ...31
2.3 Methodology ...35
2.3.1 Data………..35
2.3.2 Model Specification……….40
2.4 Results ...43
2.5 Conclusion ...51
DOES VOLATILITY TRANSMISSION BETWEEN STOCK MARKET RETURNS OF CENTRAL AND EASTERN EUROPEAN COUNTRIES VARY FROM NORMAL TO TURBULENT PERIODS?...53
3.1 Introduction ...54
3.2 Literature review ...57
3.3 Methodology ...63
ii
3.3.1 The multivariate EGARCH model………..63
3.3.2 Data………..66
3.4 Empirical findings ...68
3.4.1 Preliminary statistics………68
3.4. 2 Price and volatility spillovers……….71
3.5 Conclusion ...76
VOLATILITY BEHAVIOR OF THE FOREIGN EXCHANGE RATE AND TRANSMISSION AMONG CENTRAL AND EASTERN EUROPEAN COUNTRIES………...78
4.1 Introduction ...79
4.2 Review of Related Literature...82
4.3 Research Objectives and Rationale ...87
4.4 Data and Methodology ...88
4.4.1 Methodology……… 88
4.4.2 Data Sources………91
4.5 Results and Discussion ...94
4.5.1 Summary Statistics………..94
4.5.2 Volatility Estimates Using GARCH……….100
4.6 Conclusion ...104
SUMMARY………...107
REFERENCES………...110
APPENDIX………122
OWN PUBLICATIONS………128
iii
INDEX OF FIGURES
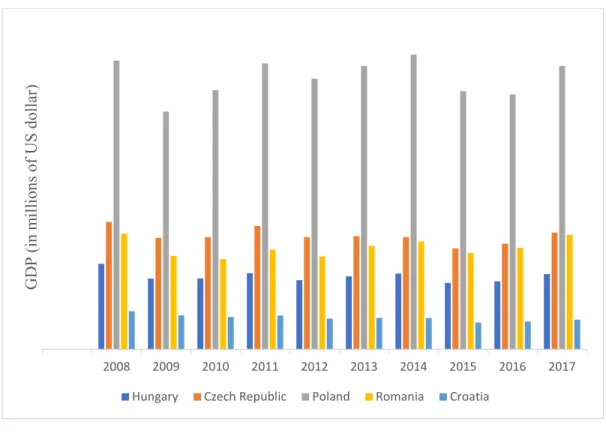
Figure 1 GDP, billion currency units ... 20
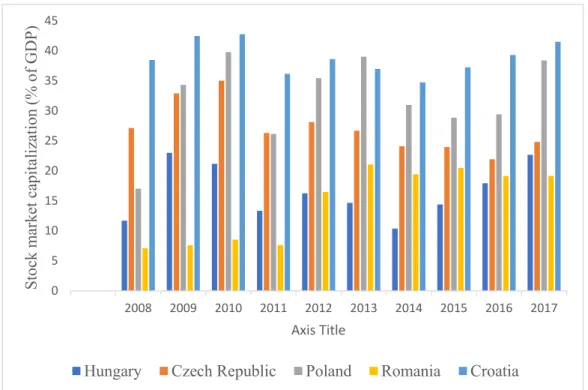
Figure 2 Stock market capitalization as percent of GDP in CEE countries ... 21
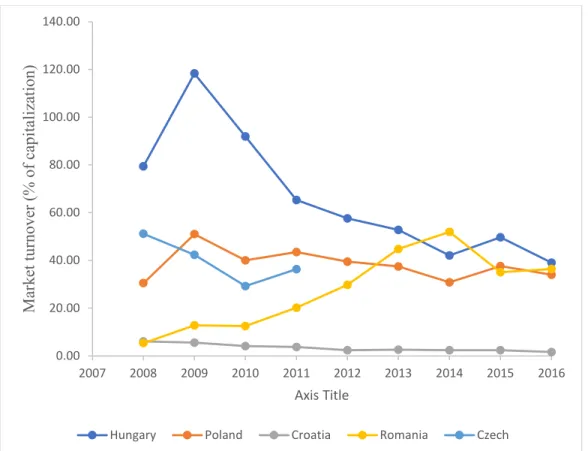
Figure 3 Stock market turnover ratio ... 22
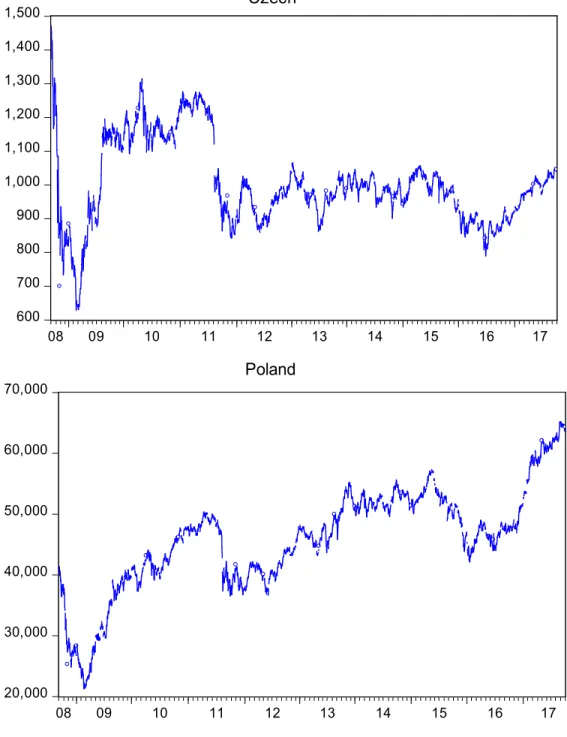
Figure 4 Foreign exchange and stock prices, 2008-2017 ... 28
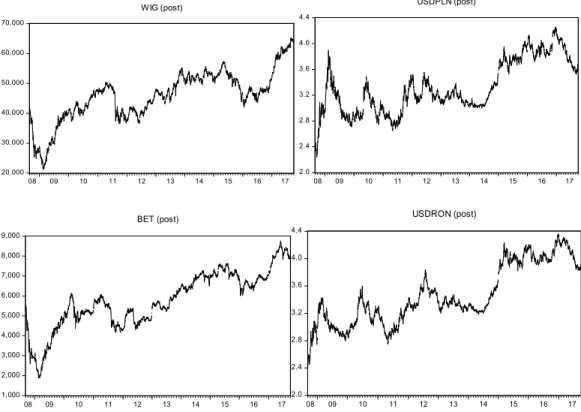
Figure 5 Plots of the indices for the sample pre- and post-crisis periods ... 40
Figure 6 Significance of selected equity markets ... 56
Figure 7 Plots of the stock indices for the sample pre-and post-crisis periods ... 71
Figure 8 Conditional variances from the univariate AR(1)–EGARCH(1, 1) ... 93
Figure 9 Plots of the exchange indices for the sample pre-and post-crisis periods. ... 97
Figure 10 Plots of the exchange percentage returns for the sample pre-and post-crisis periods. ... 98
iv
INDEX OF TABLES
Table 1 SUMMARY OF THE EMPIRICAL LITERATURE ... 16
Table 2 Exchange rate regimes in 5 CEE countries, 2008-2014 ... 23
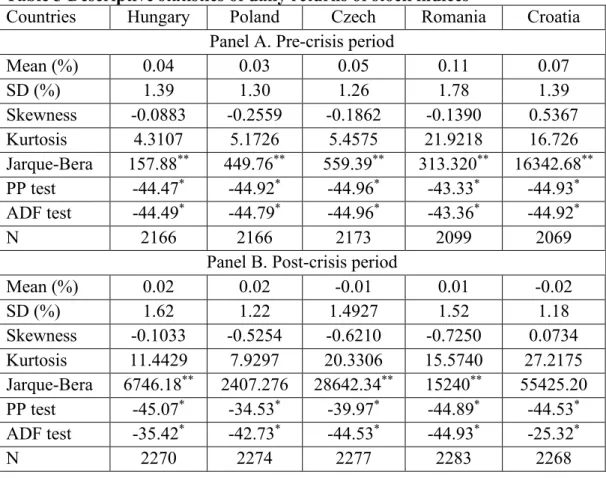
Table 3 Descriptive statistics of daily returns of stock indices ... 36
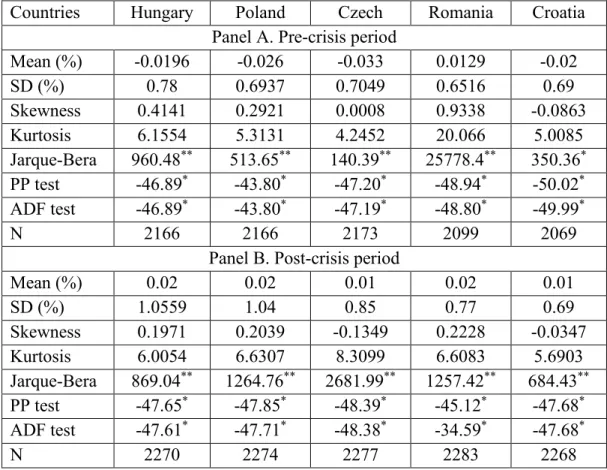
Table 4 Descriptive statistics of daily returns of stock indices ... 37
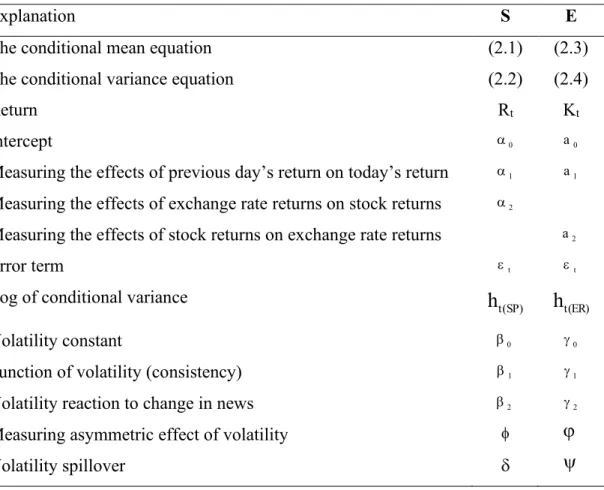
Table 5 Description of Parameters Equations (1)-(4) ... 42
Table 6 ARCH test ... 44
Table 7 Volatility spillover between stock and foreign exchange markets ... 47
Table 8 Description of Parameters Equations (3.1)-(3.4) ... 65
Table 9 Descriptive statistics of daily return of stock indices ... 69
Table 10 Unconditional Correlation Coefficients in both periods ... 71
Table 11 Volatility spillover in the pre-crisis period ... 74
Table 12 Volatility spillover in the post-crisis period ... 75
Table 13 Descriptive statistics of the daily return of exchange rates ... 95
Table 14 Estimated cross correlation matrix of exchange market returns in both periods ... 99
Table 15 Volatility spillover in the pre-crisis period ... 100
Table 16 Volatility spillover in the post-crisis period ... 102
v
ACKNOWLEDGMENTS
First of all, I would like to fully appreciate my supervisor, Barbara Maria Domotor who accompanied me during the study period. With her professional guidance, support and trust, I have completed the tasks in the last few years. I would like to thank her for talks, discussions, hints, and comments on my studies.
I am also indented to Szüle Borbála and Bakucs Zoltán for having read the papers and for providing constructive comments and hints on how to improve the quality of my study as well as journal selections.
I would like to thank the colleagues of the library of Corvinus University of Budapest for providing useful materials as well as a quiet place to study.
I would additional like to thank The Stipendium Hungaricum Scholarship Programme for sponsoring me to complete the PhD. course.
Finally, I am thankful to my wife and daughter that they are always for me.
1
INTRODUCTION
0.1 Background
Contagion is associated with a structural change in the international spillover mechanism. Spillover effects from both the stock markets and foreign exchange rate movements have drawn the attention of researchers, policymakers and other economic agents since the global financial crisis of 2008. It is well known that this crisis has demonstrated market contagion being one of the major consequences of financial crises. Recent economic downturns have often comprised the contagion of stock markets and foreign exchange rates. These co- movements are a direct symptom of a pervasive uncertainty that goes beyond the boundaries of the individual market, including emerging and frontier markets in Europe (Bubák et al. 2011). As Yilmaz (2010) reveals that financial market crises have become a more frequently observed phenomenon, especially in emerging market economies. Moreover, it is believed that volatility transmissions in the CEE stock and foreign exchange markets are not only impacted by its own shock but also by other countries’ financial market.
Volatility spillovers are argued to be more noticeable among countries that operate in the same region because they are characterized with similar cultural and policies implementation as well as closely related in terms of trade policies (Sok-Gee et al. 2010). Additionally, Diebold and Yilmaz (2012) suggest that one way of establishing an early-warn-system is by observing spillovers to create information about upcoming crises. They further added that the investigation of spillover effects can also demonstrate the progress of the ongoing crisis and the impacts of policy interventions on economy recover.
Thus, analysis of volatility transmissions should not only take into consideration spillovers from its own markets but also the spillover effects from neighboring nations. One of the primary complements of this thesis is to analyze and identify different channels of return connectedness and volatility spillovers across five financial markets in CEE countries (Hungary, the Czech Republic, Croatia, Romania and Poland) with empirical applications in the stock and foreign exchange markets in each selected CEE country (chapter II), integration of the
2
stock markets (chapter III), and exchange rate sector (chapter IV). Hence, this thesis further contributes to spillover literature. Several previous scholars have analyzed spillover effects during the periods of economic distress. For instance, the 1987 European market crisis is studied by (see, e.g., Arshanapalli and Doukas, 1993; Koutmos and Booth, 1995; Meric. I and Meric G. 1997), some investigations study the Russian financial crisis such as (see, e.g., Patev et al.
2006; Diebold and Yilmaz, 2009), the 1997 Asian financial crisis (see, e.g., Arshanapalli et al. 1995; Jang and Sul, 2002; Karunanayake et al. 2010). More recently, (Sidek et al. 2011; Srivastava et al. 2015; Bae and Zhang, 2015;
Maghyereh et al. 2015; Jin and An, 2016; Jebran et al. 2017; Bajo-Rubio et al.
2017) investigate stock market integration in the 2007 financial crisis period.
Thoroughly, spillover analysis is functional for policy implications and can be employed in divergent fields of economics and social science. It is obvious that the way of capturing and forecasting spillovers as well as its asymmetry is of great importance. Therefore, accurate examinations allow policymakers to interfere in the economy properly and reduce or overcome deleterious effects.
The main framework that this thesis builds upon is the return and asymmetric volatility spillovers approach of the multivariate Exponential Generalized Autoregressive Conditional heteroskedasticity (EGARCH) model proposed by Nelson (1991), which permits to identify which forces drive the relevant markets and which are driven by those markets. This approach allows us to estimate return and volatility spillovers without the restriction of a specific structure in terms of the contemporaneous correlation, asymmetric spillover effects. Furthermore, based by several diagnostics, Nelson (1991) and Engle and Ng (1993) find that the EGARCH model executes better than other GARCH-type models since the latter tends to underpredict volatility related to negative innovations. In a same vein, Lim and Sek (2013) show that asymmetric EGARCH models can be the better model to forecast and capture the volatility.
The main advantage of the EGARCH model is that there are no parameter restrictions required to guarantee positive variance all the time (Koutmos and Booth 1995). This is significant because some of the coefficients in the conditional variance specification violate the non-negativity assumption (Hamao et al. 1990). Briefly, modelling the multivariate EGARCH model can successfully capture the price and volatility spillovers among financial markets
3
in the selected countries. To measure the accuracy and reliability of the return and volatility spillovers, bivariate EGARCH is introduced in chapter II, multivariate EGARCH is employed in chapter III and chapter IV respectively.
Thus, the second main concentration of this thesis is that the method employed is a multivariate extension of Nelson (1991) univariate EGARCH model.
Modeling the return and spillover effects of the five financial CEE markets simultaneously has several advantages over the univariate approach that has been used so far. First, it removes the two-step procedure, thereby keeping away from problems of estimated regressors. Second, it enhances the efficiency and the power of the tests for cross market spillovers. Third, it is methodologically compatible with the conception that spillovers are significant demonstrations of the influence of worldwide news on any given markets. Specifically, the multivariate EGARCH model allows own market and cross market shocks to utilize an asymmetric effect on the volatility in a given market based on the test of asymmetries.
In addition, the analysis of volatility spillover in the emerging and frontier markets in CEE countries served as the subject of interest for most international portfolio managers as these markets provide further portfolio diversification and offer a higher rate of return to investors because these markets are somewhat risky as compared to the financial markets in the advanced economy (Sok-Gee et al. 2010). According to Koutmos and Booth (1995), portfolio managers can make use of information of the market they involved in transactions as well as information from other stock markets which are relevant to the movement in the domestic markets. Additionally, financial markets in the CEE countries are believed to bring opportunities for international investors since this region is well-known for its political stability. Hence, in-depth analysis of these markets concerning the volatility of its financial markets will shed some lights to portfolio managers in connection with the risk associated with investments in these markets.
Overall, the ultimate goal of this thesis is to extend previous methodologies and findings related to return and volatility spillovers in financial markets and to fill some lacunae in the literature.
0.2 Overview
4
This thesis includes three main topics in the field of spillovers using the multivariate EGARCH model. Put differently, this thesis is making use of a battery of econometrical models described in each chapter to capture return and volatility spillovers. The structure of the thesis is as follows
Chapter I represents the literature overview
Chapter II examines the dynamics of volatility spillover between stock and foreign exchange market: Empirical evidence from Central and Eastern European countries.
Chapter III addresses the question: Does volatility transmission between stock market returns of Central and Eastern European countries vary from normal to turbulent periods?
Chapter IV investigates volatility behavior of the foreign exchange rate and transmission among Central and Eastern European countries
Chapter I briefly reviews several articles that investigate the volatility spillovers among financial markets in the CEE countries.
Chapter II investigates the asymmetric volatility spillover effects between stock and foreign exchange markets using daily data. Obviously, the interlinkage between the two main financial markets had produced loads of papers for a long time. According to Wong (2017), the interrelatedness between stock prices and exchange rates may influence the execution of monetary policy and fiscal policy. Furthermore, a strong connectedness between them would have significant implications for economic policies and international capital budgeting decisions because negative innovations influencing one market may be quickly dispatched to another through contagious effects (Chkili and Nguyen, 2014). Kanas (2000) concludes that the huge increase in interdependency has also increased volatility spillovers between stock and foreign exchange markets. For example, Kanas (2000), Yang and Doong (2004), Aloui (2007), Valls and Chuliá (2014), Mozumder et al. (2015), Segal, Shaliastovich and Yaron (2015), Jebran and Iqbal (2016), Baruník, Kočenda and Vácha (2016) among others analysed the links between stock and foreign exchange returns.
Bivariate EGARCH model is employed to examine the volatility spillovers and co-movement between stock and foreign exchange markets of the five CEE countries. The entire investigation period is subdivided into two sub-periods:
5
the pre-crisis period, from 1 April 2000 to 29 August 2008; and the post-crisis period, from 1 September 2008 to 29 September 2018. The results point to bidirectional volatility spillovers between the stock and foreign exchange markets of Hungary in all periods, and of Poland in the post-crisis period, unidirectional volatility spillovers in Croatia in the pre-crisis period, and from the stock market to the exchange market in the Czech Republic during two periods. In the post-crisis period, the two financial markets show the absence of volatility spillovers in Croatia.
Chapter III focuses on the integration of the CEE stock markets using daily data that also subdivided into pre and post the global financial crisis. The main reasons why to investigate the transmission mechanism of price and volatility spillovers across Budapest, Warsaw, Prague, Bucharest and Zagreb stock markets is threefold. First, the pivotal role of emerging markets which is becoming more interesting for investors and policymakers. Second, Central and Eastern European countries have attempted to increase cooperation and trade among themselves. Third, we modeled the possible returns and asymmetric volatility spillovers among five emerging markets in which previous studies only focused on the dynamic relationship between returns and transmissions.
There have been numerous investigations among stock markets in different countries to identify the transmission mechanism (Jebran et al. 2017; Huo and Ahmed, 2017; Bala and Takimoto, 2017; Ghouse and Khan, 2017; Baumohl et al. 2018; Mensi et al. 2018; Morales Zumaquero and Sosvilla Rivero, 2018;
Caloia et al. 2018; Lau and Sheng, 2018; BenSaida et al. 2018; Tiwari et al.
2018; Ahmed and Huo, 2018; Naresh et al. 2018; Xuan Vinh and Ellis, 2018).
The main aim of this chapter empirically formulates and estimates the volatility spillover by a multivariate EGARCH model of the daily stock markets returns for selected countries. The model is employed to examine the first and second- moment interdependencies among the various markets. The results reveal that the volatility transmission mechanism is asymmetric, bad news in a given market increase volatility in the next market to trade considerably more than positive innovations for the whole period. However, these results exclude the Croatian stock market in the pre-crisis period and the Czech Republic stock market in the post-crisis period. We find evidence of price spillovers of the intraregional linkages among the stock price movements in the five Central and
6
Eastern European countries. For the second moment interactions, the results highlight certain interesting findings that the stock markets are more substantially integrated into a crisis.
Finally, chapter IV focuses on the foreign exchange rate markets in the CEE countries based on the model developed in chapter III. There is a slight difference between the model used in chapter III, we also apply the multivariate EGARCH model but the first moment of return series are used in the mean equation instead of the second moment in chapter III. This measure represents the magnitude of asymmetric shocks and the degree of bilateral interrelatedness because these markets are less volatile than stock returns. Over the past several decades, the majority of Central and Eastern countries running de jure floating exchange rate regimes have smoothly progressed. There are several substantial papers such as (Fidrmuc and Horváth, 2008; Bubak, 2009; Greenwood et al.
2016) who are interested in the analysis of foreign exchange market interdependence and detection of the return and volatility spillovers targeting at helping many market participants make the financial decisions.
This study utilizes the daily US dollar exchange rate data in an attempt to answer the question of the changing nature of volatility spillovers among foreign exchange markets in these nations. The findings indicate that the return spillovers exhibit more significant in the pre-crisis period than in the post-crisis period in the CEE countries. The foreign exchange markets become more independent in a crisis situation. Similarly, the volatility spillover between the foreign exchange markets decreases dramatically and financial markets have not been transmitted during the crisis period. The results also show that Polish and Romania exchange markets influence other markets, especially during the turmoil period. These results raise a question related to the role of market consensus versus information during the period of stress. It would be tested by future researchers using new or more enhanced models to capture the effects and predictions of volatility behavior during the extreme turbulent periods.
Based on the three above topics, we have produced three paper-based thesis namely, “Dynamics of volatility spillover between stock and foreign exchange market: empirical evidence from Eastern European countries”, “Does volatility transmission between stock market returns of Central and Eastern European
7
countries vary from normal to turbulent periods? evidence from EGARCH model?” and “Volatility Behavior of the Foreign Exchange Rate and Transmission among Central and Eastern European Countries: Evidence from EGARCH model”, respectively, which are accepted for publication.
8
LITERATURE OVERVIEW
There are countless studies conducted in exploring integration and spillover effects across financial markets in the finance literature. Most of the researchers made their significant contribution to the existing literature by filling the gap of exploring knowledge about the volatility transmission mechanism of the dynamic linkage between the exchange rates and the stock market in the different countries. In this study, we primarily based on the previous literature in connection with the topic of volatility transmission across countries. In addition, the flow-oriented and stock-oriented models are two original models widely used by the majority of the previous investigations.
1.1 The flow-oriented model
This model based on the idea that the exchange rate is primarily determined by a country’s account balance. The flow-oriented model suggests that a positive relationship between the exchange rate and stock prices. In this model, Dornbusch and Fischer (1980) assumes that changes in the foreign exchange rate can affect international competitiveness and trade balance. Therefore, they affect real income and inputs. The model posits that the causality relationship running from exchange rate to stock prices can be explained as follows: the domestic currency depreciation will make local firms more competitive by making cheaper exports in international trade. The higher exports will lead to the higher wealth of firms by appreciating the domestic firm’s stock prices.
1.2 The stock-oriented model
Branson and Henderson (1985), Frankel (1983) report that the exchange rate is determined by the demand and supply of financial assets such as equities and bonds. This model is classified into monetary models and portfolio balance model. The model suggests that there is a negative relationship between stock prices and exchange rates. It means that stock prices have an impact on exchange rates. Such model reports that investors hold local and foreign assets such as domestic and foreign currencies. According to the portfolio balance
9
model, an increase in domestic assets stock price will result in domestic currency depreciation, so investors tend to buy more domestic assets and sell foreign assets so as to have more local currency in hand for the purpose of purchasing new domestic assets. This mechanism will lead to domestic currency depreciation. The increase in wealth of investors due to increase in domestic assets price stimulate investor’s portfolio decisions. Thus, higher interest will motivate foreign demand for domestic currency in order to buy new domestic assets. This will lead to currency appreciation. The monetary approach postulates the exchange rate as the price of the financial asset. Because the value of a financial asset is determined by the present value of anticipated cash flows, the exchange rate is determined by all the macroeconomic factors affecting the anticipated value
1.3 Volatility and its properties
According to Alexander (2008a), volatility depicts the annualized standard deviation of the returns on investment. To wit, volatility of an asset can be accurately defined as an annualized measure of the dispersion in a stochastic process that is applied to model log returns. Investments or equities can be of various types. Volatility, as a measure of portfolio risk, presents annualized standard deviation of portfolio returns (Alexander, 2008b). Additionally, volatility of a stock price or an exchange rate is a measure of uncertainty of future stock price or exchange rates movements and uncertainty about the returns provided by the stock or exchange rate. Therefore, volatility of a stock price or an exchange rate portrays standard deviation of the return provided by the stock or exchange rate in one year, when return is continuous compounding.
As per (Hull, 2005), the volatility of a stock or an exchange rate is impacted by new information. Investors will revise their opinions about the value of a stock or an exchange rate, based on the innovation, and the price will be able to change and this will cause volatility to change as well. In an economic context which is arbitrage-free, volatility of asset prices is directly connected to the rate of information flow into the market (Ross, 1989). Nevertheless, Hull (2005) documents that volatility is also caused by trading to a great extent. A definition of spillover is established by Engle et al. (1990), markets operate effectively
10
during a day when one market closes, another opens. As a result, information set for current market consists of yesterday’s news, and today’s news from the previously closed market. Allen et al. (2013) report that if one market volatiles resulting in a volatility of other markets or Lee (2013) says that if one market volatiles giving rise to lagged volatility in other market, these situations can be referred to as spillover effects. The terms of volatility spillover and volatility transmission are used interchangeably in the literature (Abbas et al. 2013).
Tsay (2005) reports some essential properties of the volatility of asset returns because it has many financial applications and it has a significant determinant for options trading. Volatility modelling could calculate the value at risk of financial position which is used for risk management and enable asset allocation under a mean-variance framework. Volatility has several characteristics that are commonly found in asset returns, which play a prominent role in the development of the volatility model.
Volatility has a property of clustering, meaning that in a certain period volatility can be very low, and in other periods it can be quite high.
Volatility is observed in clusters that a large shock in one direction tends to be followed by another large shock in the same or opposite direction.
Whether volatility is going to occur or not depends on the types of input data, and it is more common to appear with the daily data than the weekly or monthly data (Alexander 2008a).
Volatility develops continuously, which means that volatility jumps are rare
Volatility does not converge to infinity. It alternates in some ranges which implies that volatility is often stationary.
Property of volatility is the leverage effect. This assumes that volatility reacts differently when there is a substantial price increase, rather than it does when there is a significant drop in asset price.
Alexander (2008a) documents that the assumption of return series is independent and identically distributed for the study period when modelling volatility, which implies that volatility is constant. Also, in discrete time this assumption is a feature of the equally weighted moving average estimates.
1.4 Volatility spillovers
11
Financial integration exists when the price movements of national stock indices or exchange rates are found to exhibit a long-run casual relationship. Therefore, the interdependence among the stock market exists where local share markets will respond similarly to common shock. The market is supposed to be inefficient when there are causal linkages among stock or exchange markets in the same region (Sok and Gee et al. 2010).
The theoretical literature on crises, contagion, and volatility spillover effects is extensive (Engle et al. 2012). From an econometric point of view, various of methodologies was adopted according to the particular interest of correlation across markets. Engle et al. (1990) employ GARCH models where either market activity in one country is present as a predetermined variable in the conditional variance of another country or the full conditional covariances are estimated.
Volatility spillover is often captured in the different sorts of the GARCH-type models.
The concept of volatility spillover of asset returns can be drawn from the seminal work of (Engle et al. 1990). The authors showed the theoretical foundations for own and cross-type spillovers. The heat-wave hypothesis representing own-spillover reveals that present volatility of a market is a function of past volatility of the same market. On the other hand, the meteor- shower hypothesis representing cross-spillover illustrates that the present volatility of a market is a function of both past volatility of the same market and past volatility from other markets. It is widely noted that the meteor-shower definition of spillover encompasses both own and cross aspects.
In the empirical study, it has been proven that there is mixed evidence of own and cross phenomenon, it means that financial indices depict heat wave and meteor shower types of spillover. When markets are integrated, individually, they can get affected by the news and events emanating from each other’s socio- political, economic, legal, environmental, trade, commerce, and market innovation scenarios. It is obvious that markets integrated displays cross-market spillover in more pronounced manner. However, it has also been empirically found that markets that are not fully integrated show cross-market spillover mostly during a financial crisis, a phenomenon which is generally termed as financial contagion.
12
Foster and Nelson (1994) contribute a significant characteristic regarding volatility spillover to literature, that is the salient property of asymmetric.
Volatility transmission also exhibits asymmetry with regards to the kind of news. Bad news seems to have a severe effect on spillover as compared to good news. This asymmetric property of spillover is a prime contributor to the cause of financial contagion.
Two main reasons for studying volatility spillover are: First, it relates to the notion of market efficiency, the own aspect of spillover is a direct result of the level of efficiency in the market. The higher level of spillover indicates the lower level of efficiency. Second, volatility transmission gives information towards the level of market integration, the cross aspect of spillover measures the extent to which markets are integrated. Higher the interdependence among markets, higher will be the cross-market spillover and greater would be chance of contagions occurring in the event of a financial crisis.
It is clear in the context of the literature, the volatility spillover can be divided into three fundamental points: first, a bidirectional volatility spillover among financial markets; second, a unidirectional flow of volatility from one market to another market and vice versa; third, non-persistence of the volatility spillover among them.
1.5 Volatility spillover in the CEE markets
The growing role of emerging financial markets in a real-world economy enhances the international investor to invest in new emerging markets with two main purposes of higher returns and risk diversification. According to Habiba et al. (2019), the degree of integration among various financial markets brings about the potential benefits from international portfolio diversification, meaning that there is no gain from portfolio diversification if the capital markets of various nations are totally integrated. Therefore, volatility transmissions among financial markets are indispensable for global investors because the dynamic linkages of financial prices affect the optimal strategy of investment and diversification.
13
Furthermore, volatility in a variable over a period of time leads to unpredictability, uncertainty and risk, which impacts investor’s wealth and rises the bid ask spread that signifies the significant role of risk management.
A large part of the literature on the recent financial market integration has discussed volatility spillovers focusing on stock indices and currency prices.
Table 1 represents a brief summary of the existing empirical analysis. GARCH- type family approaches have been employed to depict how innovations propagate, whether some connectedness among different markets exist, and how they change, if at all, during a crisis.
1.6 The EGARCH model
The finance literature is rich on the topic of interconnectedness among different financial markets. The aim of this research is to examine the return relationships and asymmetric volatility transmissions among financial markets of emerging countries in the CEE context. We employ the exponential generalized autoregressive conditional heteroskedasticity (EGARCH) model to capture the return linkages and asymmetric volatility spillovers across the CEE markets.
The EGARCH model has an idiosyncratic property, which is able to explore the leverage effect of volatility – leverage effect (negative returns create more variations than positive returns) that makes model asymmetric. EGARCH model allows the variations to respond freely as the time series fall because of the negative innovations than with corresponding rises owing to the positive innovations.
ARCH (AutoRegressive Conditional Heteroscedasticity) models were gently introduced by Engle (1982), GARCH (Genenrealised AutoRegressive Conditional Heteroscedasticity) by Bollerslev (1986) and EGARCH (Exponential Genenrealised AutoRegressive Conditional Heteroscedasticity) by Nelson (1991). These models are extensively employed in various fields of econometrics, especially in financial time series analysis. Nelson (1991) proposed the exponential GARCH model in an attempt to capture the asymmetric impact of innovations on volatility, based on which many empirical studies have appeared (see, for example, Koutmos and Booth 1995; Yang and Doong 2004; Mishra et al. 2007; Bhar and Nikolova, 2009; Sok et al. 2010;
14
Okicic 2014; Jebran et al. 2017; Elyasiani and Mansur, 2017 etc…). Koutmos and Booth (1995) pointed out a multivariate extension of Nelson (1991) univariate EGARCH model to facilitate a simultaneous investigation of the asymmetric impact of good news and bad news on the volatility spillover across markets. In this study, bivariate and multivariate EGARCH models were applied through three primary research questions as mentioned earlier. The specifications of the EGARCH model should be illustrated in each separately part of this thesis or in APENDIX.
The significance of EGARCH model
The model captures asymmetric responses of the time varying variance to shocks and, at the same time, ensures that the variance is always positive. It was developed by Nelson (1991) with the following specification:
p q
2 2 t i t i
t 0 j t j i i
j 1 i 1 t i t i
ln( ) ln( ) 2
where is the asymmetric response parameter or leverage parameter. The sign of is expected to be positive in most empirical cases so that a negative shock increases future volatility or uncertainty while a positive shock eases the effect on future uncertainty. This is in contrast to the standard GARCH model where shocks of the same magnitude, positive or negative, have the same impact on future volatility. In macroeconomic analysis, financial markets and corporate finance, a negative shock usually implies bad news, leading to a more uncertain future. Consequently, for example, shareholders would require a higher expected return to compensate for bearing increased risk in their investment. A statistical asymmetry is, under various circumstances, also a reflection of the real-world asymmetry, arising from the nature, process or organization of economic and business activity, the change in financial leverage is asymmetric to shocks to the share price of a firm.
The procedure for measuring volatility spillover of this study is implemented in the following stages. An initial step we provide descriptive statistics for stock and exchange rate returns to summarize the statistical characteristics of our sample. We then carry out the stationary test including ADF and PP test on each
15
of the concerned variables. Next step, identifying and estimating an autoregressive and moving average (ARMA) model for the mean equation, using the residuals of the mean equation to test for ARCH effect (the significant value of chi-square depicts ARCH effect in the underlying variable). EGARCH model shall be employed on data in which ARCH effect exists. After making sure that there exists ARCH effect, we have specified and estimated the volatility spillover among stock market or foreign exchange rate market or between them. Finally, residual diagnostics have been performed (Tsay, 2005).
16 Table 1 Summary of the empirical literature
Author Variables Period Markets Included Method Results
Shield (1997)
Stock market indices
1991-1995 (daily)
HU, PO Tobit GARCH No asymmetry exists
Scheicher (2001)
Stock market indices
1995-1997 (daily)
HU, PO, CZ MGARCH Interaction in returns both regional and global shocks, but news to innovations to volatility have a primarily regional character
Murinde and Poshakwale (2001)
Stock market indices
1994-2000 (daily)
CR, CZ, HU, PO,
GARCH models ARIMA, BDSL
Explanation by symmetric and asymmetric
Grambovas (2003)
Stock market indices,
Exchange rates,
1994-2000 (weekly)
CZ, HU, GR Cointegration, Granger Causality
Interconnection between exchange rates and stock prices
Kobor and Szekely (2004)
Exchange rates 2001–2003 (daily)
PO, HU, CZ Markov
regime-switching
Cross-correlations and volatility differ
Syllignakis and Kouretas (2006)
Stock market indices
1995-2005 (weekly)
PO, HU, CZ, RO Granger Causality DCC, Markov SWARCH-L
Stock markets are partially integrated
Kocenda and Valachy (2006)
Exchange rates, Interest rates
1993-2005 (daily)
PO, HU, CZ.
TARCH Volatility is greater under a floating exchange rate regime than under a fixed regime
Vizek and Dadic (2006).
Stock market indices
1997-2005 (daily)
PO, HU, CZ, CR
Johansen cointegration
The forces driving financial integration are quite powerful, more substantial movement Fidrmuc and
Horvath (2008)
Exchange rates 1999-2006 (daily)
CZ, HU, PO, RO
GARCH TARCH
Significant asymmetric effects of the volatility of exchange rates in new EU members states Bubak
(2009)
Exchange rates 2002-2008 (daily)
CZ, HU, PO model-free nonparametric measures of ex- post volatility
Daily returns on the EUR/CZK, EUR/HUF and EUR/PLN exchange rates are normally distributed and independent over time
17
Author Variables Period Markets Included Method Results
Harrison et al.
(2010)
Stock market indices
1994-2006 (daily)
CZ, RO, HU, PO Panel data Stationarity for the returns of these indices and identified some common characteristics of these markets taken as a whole
Syllignakis and Kouretas (2011)
Stock market indices
1997–2009 (weekly)
PO, HU, CZ DCC
MGARCH
Increasing in conditional correlations between the US and the German stock returns and the CEE stock returns
Tudor (2011) Stock market indices
2006-2009 (daily)
CZ, HU, PO, RO Granger Causality VAR
Relationships among CEE stock markets are time varying
Barbic and Jurkic (2011)
Stock market indices,
macroeconomic variables
1998-2010 (monthly)
PO, HU, CZ, CR Granger Causality VECM
Established long run relationship between stock market indices and macroeconomic variables
Kizys and Pierdzioch (2011).
Stock market indices
1995-2008 (monthly)
CZ, HU, PO Cointegration State-Space VECM
International long-run linkages varied over time
Gjika and Horvath (2013)
Stock market indices
2001-2011 (daily)
CZ, HU, PO MGARCH
DCC
The correlations among stock markets in Central Europe and between Central Europe vis–à–vis the euro area is strong
Kumar and Kamaiah (2014)
Exchange rates 1994 – 2013 (monthly)
CR, CZ, HU, PO, RO
EGARCH, Lyapunov
Foreign exchange markets exhibit deterministic chaotic behavior
Okicic 2015 Stock market indices
2005-2013 (daily)
CR, CZ, HU, PO, RO
ARIMA and GARCH
The existence of a leverage effect in the selected stock markets
Melik Kamisli et al. (2015)
Stock market indices
2008-2015 (weekly)
CR, CZ, HU, PO, RO
CCC DCC MGARCH
Cross-market correlations are constant
18
Author Variables Period Markets Included Method Results
Hsing (2016)
Exchange rates,
Interest rates, Real GDP
2000-2014 (quarterly)
HU EGARCH The HUF/USD exchange rate has a long-
term equilibrium relationship with these time series variables.
Petrica and Stancu (2017)
Exchange rates 1999-2016 (daily)
RO EGARCH,
TARCH PARCH
The best model to estimate daily returns of EUR/RON exchange rate is EGARCH (2,1)
Giannellis and Papadopoulos (2011)
Exchange rates,
Interest rates, Industrial production indices, National share prices indices
1991-2007 (monthly)
PO, HU, CZ VAR
CCC
GARCH-BEKK
Volatility in Hungarian and Polish forex markets can be influenced by the monetary side of the economy
Forex markets in France, Italy and Spain had been influenced, during the pre-EMU era, by monetary and real shocks
We report only the Central and Eastern European markets relevant for our analysis: Hu (Hungary), PO (Poland), RO (Romania), CR (Croatia), CZ (The Czech Republic). Other markets may have been considered in the corresponding studies but are not mentioned here.
19
1.7 Data
The data set consists of daily closing stock and exchange rate prices for five Eastern European countries, the choice of the sample period was primarily governed by the availability of data. We took daily data covering the period from 1st April 2000 to 29th September 2017. The entire investigation period is subdivided into two sub- periods: Pre-crisis period: 1st April 2000 to 29th August 2008. Post-crisis period: 1st September 2008 to 29th September 2017. The whole period in present study divides into pre and post financial crisis period on the basis of certain justifications. The reason for collecting daily data is to capture more the precise information content of changes in stock prices and exchange rates than doing with weekly or monthly data (Jebran and Iqbal, 2016), and better able to capture the dynamics between variables (Agrawal et al. 2010). The sample five European countries include Hungary, Poland, Czech Republic, Romania and Croatia and their stock indexes are: Budapest Stock Exchange BUX, Warsaw Stock Exchange WIG, Prague Stock Exchange PX, Bucharest Stock Exchange BET and Zagreb Stock Exchange respectively. The national currencies of these countries are Hungarian Forint HUF, Polish Zloty PLN, Czech Koruna CZK, Romanian Leu RON and Croatian Kuna HRK respectively. The exchange rate series are from the European countries are stated in US dollars per local currency (note that value of the dollar). The data for our empirical investigation is obtained from Bloomberg, accounted by the Department of Finance, Corvinus University of Budapest.
The limitation of the current dissertation is that the exchange rate US dollar is used as a case study. In reality, the CEE nations are the periphery of the eurozone, the substantial exchange rate is against the euro and not the US dollar. The common trends of CEE currency exchange rates against the dollar come from the USD/Euro exchange rate. A part of the CEE currency return would be euro return. Therefore, further interesting research would be to examine whether these results hold for the case of the exchange rate Euro. However, the thesis focuses on the volatility spillover among financial markets in CEE countries, so there is a slight difference between the local currencies against Euro and USD.
20
1.8 Market characteristics
Stock market
The CEE countries lag behind the rest of member states in the European region by a large margin in terms of financial depth. On average, the ratio of domestic credit to the private sector as a percentage of GDP in the CEE new member states stood at slightly more than 30 percent in 2003, compared to the EU-15 average of around 120 percent. We were able to observe an improvement in the degree of financial intermediation over the past decade. Strong economic growth, structural reforms in the financial sector and progress in the privatization of banks benefited this process in most countries. In addition, bond and equity markets continue to be relatively small in the member states in CEE, both in absolute terms and in relation to GDP.
Figure 1 GDP, billion currency units Source: World Development Indicators
The equities exchanges of Central and Eastern Europe are relatively small emerging and frontier markets. The largest market among them, the Zagreb Stock Exchange, is comparable in size and market turnover to the smallest Budapest stock exchange.
2008 2009 2010 2011 2012 2013 2014 2015 2016 2017
GDP (in millions of US dollar)
Hungary Czech Republic Poland Romania Croatia
21
The worldwide market downturn since 2000 has influenced CEE exchange in terms of market capitalization and trading volume as it has all other exchanges in the world. The effects, however, are felt much more by CEE exchanges and raises the question of whether these exchanges can be important to CEE economies and particularly in terms of corporate finance in these countries. To assess the current stage of development of CEE securities markets in stocks and exchange markets, we look at these markets from various perspectives and compare them with other West European markets.
Figure 1 gives an overview of the important characteristics of CEE stock markets between 2008 and 2017. The graph shows that CEE stock exchanges are still relatively small. All CEE stock exchanges not only show low market capitalization but also are relatively important to the economy. This can be seen from the relation of market capitalization to GDP. In general, the selected stock markets have a capitalization of only lowest 7 percent (Romania) and largest 42 percent (Croatian) relative to GDP. This means that only a small fraction of the total value of CEE companies is traded at the stock exchanges. There is now a large gap between these still-developing stock markets and the CEE stock markets.
Figure 2 Stock market capitalization as percent of GDP in CEE countries
0 5 10 15 20 25 30 35 40 45
2008 2009 2010 2011 2012 2013 2014 2015 2016 2017
Stock market capitalization (% of GDP)
Axis Title
Hungary Czech Republic Poland Romania Croatia
22 Source: World Development Indicators
Another significant characteristic of stock market is liquidity, which is often measured as the ratio of market turnover to market capitalization (Figure 2). This ratio indicates how often the total value of stocks is turned over on average during a year. A high ratio reveals that the market is relatively liquid. This is particularly important with respect to the usually large orders of institutional investors. The five CEE stock markets have slightly low turnover ratios.
Figure 3 Stock market turnover ratio Source: World Development Indicators Foreign exchange market
The evolution of exchange rates currently illustrates a significant source of concern from both a micro and a macroeconomic perspective. The exchange rate is one of the most synthetic prices in an economy and it is also the expression of a general equilibrium among the market for real goods and services, the currency market and capital market, which has the apparent potential of effecting the general economic equilibrium in any economy. The behaviour of the exchange rate is influenced, at
0.00 20.00 40.00 60.00 80.00 100.00 120.00 140.00
2007 2008 2009 2010 2011 2012 2013 2014 2015 2016
Market turnover (% of capitalization)
Axis Title
Hungary Poland Croatia Romania Czech
23
its turn, by the degree of economic growth, the changes in the general level of prices, the industry structure of the economy, the country’s level of international competitiveness and its degree of trade and financial openness, the political stability and government’s ability to deal with internal crises which would occur. This diversity of determinants that impact directly or indirectly the exchange rate raises the issue of the easiness of managing such a complex and dynamic macroeconomic variable.
Over the past several decades, the number of countries running de jure floating exchange rate regimes has steadily grown. In some influential papers show that there is a discrepancy between de jure and de facto, and countries appear to actively restrict fluctuations in the external value of their national monies.
The diversity in the exchange rate regime choices also reflects different stabilization strategies and the availability of alternative monetary policy frameworks. Achieving price stability still remains the main stabilization task. The exchange rate regimes of the former communist countries in the region are quite diverse, ranging from stabilized arrangement to free floating. This diversity can be explained by the structural diversity of these countries, on one hand, and by the need felt by these countries to better control inflation and exchange rates at the same time. In general, there are some substantial differences for some countries and some years. We observed the volatility of exchange rates and stock indices of these countries currencies against the US dollar over the same time span. (see Figure 4) Table 2 Exchange rate regimes in 5 CEE countries, 2008-2014
2008 2009 2010 2011 2012 2013 2014
Croatia 8 4 6 6 6 6 6
Czech Republic 10 10 10 10 10 8 4
Hungary 9 9 9 9 9 9 9
Poland 10 10 10 10 10 10 10
Romania 9 9 9 9 9 9 9
Notes: 4= Stabilized arrangement; 6=Craw-like arrangement; 7=Managed floating with no pre-determined path for the exchange rate; 8=Other managed arrangement;
9=Floating; 10=Free floating
Source: IMF’s Annual report on exchange arrangement and exchange restrictions
24 (a) Daily foreign exchange prices
2.0 2.4 2.8 3.2 3.6 4.0 4.4
08 09 10 11 12 13 14 15 16 17
Poland
160 180 200 220 240 260 280 300 320
08 09 10 11 12 13 14 15 16 17
Hungary
25 2.0
2.4 2.8 3.2 3.6 4.0 4.4
08 09 10 11 12 13 14 15 16 17
Romania
16 18 20 22 24 26 28
08 09 10 11 12 13 14 15 16 17
Czech
26
4.5 5.0 5.5 6.0 6.5 7.0 7.5
2008 2009 2010 2011 2012 2013 2014 2015 2016 2017
Croatia
(b) Daily stock prices
8,000 12,000 16,000 20,000 24,000 28,000 32,000 36,000 40,000
08 09 10 11 12 13 14 15 16 17
Hungary
27 1,000
2,000 3,000 4,000 5,000 6,000 7,000 8,000 9,000
08 09 10 11 12 13 14 15 16 17
Romania
1,200 1,600 2,000 2,400 2,800 3,200 3,600
08 09 10 11 12 13 14 15 16 17
Croatia
28 600
700 800 900 1,000 1,100 1,200 1,300 1,400 1,500
08 09 10 11 12 13 14 15 16 17
Czech
20,000 30,000 40,000 50,000 60,000 70,000
08 09 10 11 12 13 14 15 16 17
Poland
Figure 4 Foreign exchange and stock prices, 2008-2017
29
THE DYNAMICS OF VOLATILITY SPILLOVER BETWEEN STOCK AND FOREIGN EXCHANGE MARKETS:
EMPIRICAL EVIDENCE FROM CENTRAL AND EAST EUROPEAN COUNTRIES
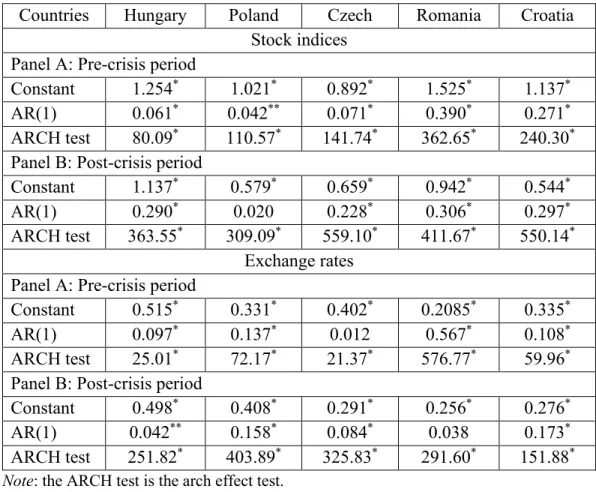
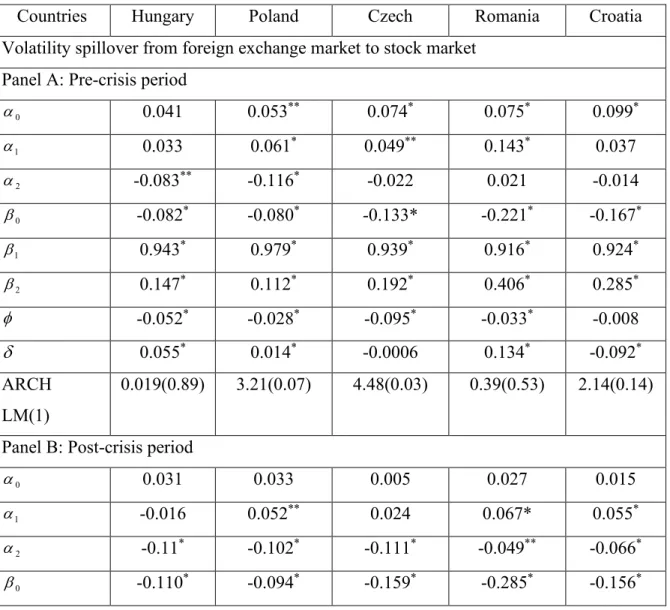
1We use an Exponential Generalised Autoregressive Conditional Heteroskedasticity (EGARCH) model to investigate the asymmetric volatility spillover effects between the stock markets and foreign exchange markets in Hungary, Poland, the Czech Republic, Romania and Croatia for the periods before and after the financial crisis. The study covers the entire period from 1 April 2000 to 29 September 2017.
The results reveal bidirectional volatility spillover between the stock and foreign exchange markets of Hungary in all periods, and of Poland in the post-crisis period, unidirectional volatility spillover in Croatia in the pre-crisis period, and from the stock market to the exchange market in the Czech Republic during two periods. In the post-crisis period, the two financial markets show the absence of volatility spillover in Croatia. Furthermore, empirical results from our analysis provide valuable insights to investors, multinational companies and economic policymakers regarding financial decision-making.
JEL: C15; F31; G15
Keywords: volatility spillover, Central and East European countries, ARCH, GARCH, EGARCH, exchange rate, stock market
1Hung, N.T (2019). Dynamics of volatility spillover between stock and foreign exchange market:
empirical evidence from Central and Eastern European Countries. ECONOMY AND FINANCE:
ENGLISH-LANGUAGE EDITION OF GAZDASÁG ÉS PÉNZÜGY, 6(3), 244-265.