Stressed tadpoles mount more ef fi cient glucocorticoid negative feedback in anthropogenic habitats due to phenotypic plasticity
Veronika Bókony
a,⁎
,1, Nikolett Ujhegyi
a, Kamirán Á. Hamow
b, Jaime Bosch
c,d, Barbora Thumsová
c,d, Judit Vörös
e, Andrea S. Aspbury
f, Caitlin R. Gabor
f,1aLendület Evolutionary Ecology Research Group, Plant Protection Institute, Centre for Agricultural Research, Herman Ottó út 15, 1022 Budapest, Hungary
bPlant Protection Institute, Centre for Agricultural Research, Brunszvik u. 2, 2462 Martonvásár, Hungary
cMuseo Nacional de Ciencias Naturales-CSIC, José Gutiérrez Abascal 2, 28006 Madrid, Spain
dResearch Unit of Biodiversity (CSIC, UO, PA), Gonzalo Gutiérrez Quirós s/n, Oviedo University - Campus Mieres, Edificio de Investigación, 33600 Mieres, Spain
eDepartment of Zoology, Hungarian Natural History Museum, Baross u. 13, 1088 Budapest, Hungary
fDepartment of Biology, Texas State University, 601 University Drive, San Marcos, TX 78666, United States
H I G H L I G H T S
•Endocrineflexibility likely helps organ- isms cope with anthropogenic habitat change.
•We tested if land use, water pollution, and pathogens affect glucocorticoid profiles.
• We sampled tadpoles in agricultural, urban, and natural ponds and in“com- mon garden”.
•Stress response and negative feedback were upregulated in anthropogenic habitats.
•Negative feedback is key to understand- ing how animals adapt to the anthroposphere.
G R A P H I C A L A B S T R A C T
a b s t r a c t a r t i c l e i n f o
Article history:
Received 13 June 2020
Received in revised form 19 August 2020 Accepted 20 August 2020
Available online xxxx Editor: Yolanda Picó
Coping with anthropogenic environmental change is among the greatest challenges faced by wildlife, and endo- crineflexibility is a potentially crucial coping mechanism. Animals may adapt to anthropogenic environments by dampening their glucocorticoid stress response, but empirical tests of this hypothesis have provided mixed evi- dence. An alternative hypothesis is that a non-attenuated stress response and efficient negative feedback are fa- vored in anthropogenic habitats. To test this idea, we non-invasively sampled corticosterone release rates of common toad (Bufo bufo) tadpoles in agricultural, urban, and natural habitats, and quantified their stress re- sponse and negative feedback by a standardized stress-and-recovery protocol. We repeated the same sampling with tadpoles raised from eggs from the same ponds in a common-garden experiment to infer if the differences observed between populations in different habitats were due to individual phenotypic plasticity rather than mi- croevolution or transgenerational effects. We found that, compared to tadpoles in natural ponds, urban tadpoles had higher baseline and stressed corticosterone release rates, and tadpoles in agricultural ponds had similar cor- ticosterone release rates but greater stress-induced change, indicating stronger stress responses in both types of anthropogenic habitats. As predicted, tadpoles in both agricultural and urban ponds showed more efficient neg- ative feedback than did tadpoles in natural ponds. Water pollution levels, as indicated by the concentrations of carbamazepine and corticoid-disrupting compounds in pond water, contributed to elevating the stress response Keywords:
Amphibian stress physiology Human-induced environmental change Carbamazepine
Corticoid-disrupting contaminants Batrachochytrium dendrobatidis Ranavirus
⁎ Corresponding author.
E-mail address:bokony.veronika@atk.hu(V. Bókony).
1These authors contributed equally to this work.
https://doi.org/10.1016/j.scitotenv.2020.141896
0048-9697/© 2020 The Authors. Published by Elsevier B.V. This is an open access article under the CC BY-NC-ND license (http://creativecommons.org/licenses/by-nc-nd/4.0/).
Contents lists available atScienceDirect
Science of the Total Environment
j o u r n a l h o m e p a g e :w w w . e l s e v i e r . c o m / l o c a t e / s c i t o t e n v
regardless of land use. Infection by neitherBatrachochytrium dendrobatidisnorRanaviruswas detected in free- living tadpoles. No habitat-related glucocorticoid differences persisted in the common-garden experiment.
These results suggest that toad tadpoles in anthropogenic habitats increased their glucocorticoidflexibility via phenotypic plasticity. The coupling of stronger stress response and stronger negative feedback in these habitats supports the importance of rapidly“turning on and off”the stress response as a mechanism for coping with an- thropogenic environmental change.
© 2020 The Authors. Published by Elsevier B.V. This is an open access article under the CC BY-NC-ND license (http://
creativecommons.org/licenses/by-nc-nd/4.0/).
1. Introduction
Anthropogenic environmental change exposes wildlife to many kinds of stressors: unpredictable or uncontrollable stimuli that threaten the organism's life or homeostasis. For example, both urban and agricul- tural land use loads the environment with various chemical pollutants, which are accompanied in urban areas by noise, light pollution, and the urban heat island effect (Bókony et al., 2018;Mann et al., 2009;Seress and Liker, 2015). Understanding the phenotypic and genetic adapta- tions by which organisms cope with these challenges is an important area of current research in ecology, evolutionary biology, and conserva- tion (Bonier, 2012;Guindre-Parker, 2018;Liker, 2020).
The glucocorticoid (GC) response to stress in vertebrate animals may play a crucial role in organismal adaptation to anthropogenic environ- ments (Bonier, 2012;Partecke et al., 2006). Glucocorticoids are secreted in response to stressful stimuli by the activation of the hypothalamus- pituitary-adrenal/interrenal (HPA/I) axis (Romero, 2004; Romero et al., 2009;Sapolsky et al., 2000) and mediate a wide variety of physi- ological and behavioral changes that help animals cope with stressors (Sapolsky et al., 2000). However, when a stressor persists and cannot be avoided, GCs can lead to pathological effects that directly impactfit- ness and can ultimately result in death (Romero and Wikelski, 2010;
Wingfield and Sapolsky, 2003). In such situations, dampening of the stress response or“resistance to stress”may be adaptive (Wingfield and Sapolsky, 2003). Researchers have hypothesized that wildlife popu- lations in anthropogenic environments can escape the negative effects of chronic stress by reducing their responsiveness to stressors (Atwell et al., 2012;Partecke et al., 2006). This hypothesis has generated great interest, yielding a large amount of mixed results across species, mostly in birds (Bonier, 2012;Sepp et al., 2018) and in reptiles (French et al., 2018). That is, urban populations in some species show higher stress re- sponse than non-urban conspecifics while other species show the oppo- site or no difference between habitats; the reason for this heterogeneity could not yet be identified by interspecific comparative studies and meta-analyses (Injaian et al., 2020;Murray et al., 2019).
Glucocorticoid negative feedback is a key component of the stress response that needs investigation to understand if and how the modu- lation of the stress response helps organisms cope with anthropogenic habitats (Narayan et al., 2019). The stress response involves suppressive actions on the HPA/I axis which decrease the production of GCs; thus, an efficient negative feedback returns GC levels to their baseline quickly after cessation of the stressor (Sapolsky et al., 2000). According to the reactive scope model of stress, the shorter the duration of the acute stress response, the lower the chances that repeated or prolonged stressors will provoke phenotypic damage; so an efficient negative feed- back may allow for a strong stress response without leading to pathol- ogy (Romero et al., 2009). Negative feedback efficiency varies between individuals and is modulated by environmental conditions (Lattin and Kelly, 2020;Vitousek et al., 2019). Individuals with more efficient nega- tive feedback are less likely to suffer from chronically elevated GC levels (Taff et al., 2018) and are better able to cope with stressors such as star- vation (Romero and Wikelski, 2010), predation risk (Zimmer et al., 2019), or disturbance by noise (Soldatini et al., 2015). Therefore, we hy- pothesize that a non-attenuated stress response coupled with efficient negative feedback may help wildlife adapt to anthropogenic habitats (Narayan et al., 2019;Vitousek et al., 2019;Wingfield, 2013), predicting
faster recovery from acute stress in individuals in these habitats. Such a strategy might be an alternative to a suppressed stress response; thus, the heterogeneity in empiricalfindings might be due to different species relying on different coping strategies. So far, only a single study reported empirical data for evaluating this idea,finding that urban curve-billed thrashers (Toxostoma curvirostre) were more responsive to stress (adre- nocorticotropin hormone, ACTH injection) than conspecifics in a desert population, but negative feedback as measured by a dexamethasone suppression test did not differ between the two habitats (Fokidis and Deviche, 2011).
Another potential reason for heterogeneity in stress responsiveness in relation to anthropogenic environments is that these environments are highly heterogeneous in the ways that they are impacted by human activities. For example, infection by parasites and pathogens can influence GC levels (Gabor et al., 2013;Raouf et al., 2006;Warne et al., 2011) and may vary among habitats with anthropogenic influence (Davis et al., 2020;St-Amour et al., 2008) or independently of it, for ex- ample with elevation (Gabor et al., 2015). Chemical contaminants may further complicate the picture. Due to pollution by wastewater, phar- maceutical discharge, and manure in agricultural areas, natural water bodies often contain GCs and other hormonally active compounds (Gabor et al., 2018;Lange et al., 2002;Macikova et al., 2014). Such water-borne pollutants are taken up by wild animals, especially by those living in aquatic habitats, and may disrupt their endocrine system (Lange et al., 2002;Macikova et al., 2014;Pottinger, 2017). Although an- thropogenic habitats are generally more polluted, endocrine disrupting chemicals occur in natural habitats as well (Bókony et al., 2018). There- fore, while chemical contaminants in general may act as physiological stressors, corticoid-disrupting compounds may have specific effects on the stress response and its negative feedback, which might confound the responses of the HPA/I axis to other anthropogenic stressors. For ex- ample, progesterone, an endogenous hormone that is also used as med- ication, occurs in wastewaters as well as natural water bodies and can affect various components of the GC system, including expression of GC receptors and enzymatic regulation of GC biosynthesis (Macikova et al., 2014). Together it is clear that exploring possible stressors across habitats will provide a greater understanding of the variable responses of organisms to anthropogenic habitats.
Phenotypic differences, such as those observed in stress physiology, may arise between individuals occupying different habitats by various mechanisms. Adaptive changes may come about by two, non- mutually exclusive processes: phenotypic plasticity within individuals, and changes in population composition due to genetic differentiation by natural selection or other trans-generational effects (Donelan et al., 2020) such as epigenetic variation (Taff et al., 2019). For simplicity, we refer to the latter group of processes as“persistent effects”(as op- posed to individual plasticity). The role of plastic and persistent mecha- nisms in phenotypic divergence between populations can be tested with common garden (or transplant) experiments, whereby individuals from different populations are reared in a common environment (Carroll and Fox, 2008; De Villemereuil et al., 2016; DeWitt and Scheiner, 2004;Guindre-Parker, 2018). Such experiments have shown that both individual plasticity and persistent population divergence can contribute to differences in baseline GC levels and stress response between urban and non-urban habitats (Atwell et al., 2012;Ouyang et al., 2019;Partecke et al., 2006). No such study to our knowledge
has additionally assessed the role of plastic versus persistent mecha- nisms in differences of GC negative feedback efficiency between popula- tions living in habitats with different levels of anthropogenic influence.
In this study, we had three main objectives. First, we examined whether the GC stress response and its negative feedback differed be- tween anthropogenic and natural habitats. Second, we investigated whether these differences were associated with pathogenic infections and chemical contaminants. Third, we tested the role of persistent pop- ulation divergence in the different GC profiles observed between habi- tats. To address these questions, we studied tadpoles of the common toad (Bufo bufo), an anuran species that occurs throughout Europe in various habitats. Amphibians have rarely been considered in research of the differences in GCs in relation to anthropogenic land use (Davis et al., 2020;Gabor et al., 2018;Goff et al., 2020;Hopkins and DuRant, 2011; Janin et al., 2011;Orton et al., 2014), despite the fact that human-induced environmental change is among the most likely causes of their global population declines (Mann et al., 2009). Here we tested 1) whether tadpoles living in natural, agricultural, and urban habitats differ in their release rates of corticosterone (the main GC of amphib- ians) in response to a standardized stressor, and after a standard time allowed for recovery (i.e., negative feedback); 2) whether stress re- sponse and negative feedback are altered in habitats with high levels of water pollution, in general, and corticoid disruptors specifically, or high levels of infection by two important groups of anuran pathogens, RanavirusandBatrachochytrium dendrobatidis(Bd); and 3) whether the differences observed in thefield persist when individuals from dif- ferent habitats are raised in a common garden experiment, which would indicate persistent population divergence rather than pheno- typic plasticity as the main mechanism of GC responses to anthropo- genic environments.
2. Methods
All procedures in this study were in accordance with animal ethics guidelines and approved by the Ethics Committee of the Plant Protec- tion Institute, Centre for Agricultural Research. Permit for the study was issued by the Environment Protection and Nature Conservation De- partment of the Pest County Bureau of the Hungarian Government (PE- 06/KTF/8060-3/2018, PE-06/KTF/8060-1/2018, PE/EA/295-7/2018).
2.1. Study sites and sampling in thefield
We selected three ponds per each of three different habitat types in North-central Hungary (Table 1). Three ponds were surrounded by woodlands, with no arablefields or residential areas in a 500-m wide buffer zone around the pond (Table 1, Fig. S1a); these are considered natural habitats for common toads. Three ponds were in agricultural landscapes with 22–48% arable fields and <7% residential areas, whereas another three ponds were in urban landscapes with 29–72%
residential areas and <3% arablefields (Table 1, Fig. S1a); we will refer to these as agricultural and urban habitats, respectively. The per- centage of each land-use type in the 500-m wide buffer zones around the ponds was measured using QGIS as in an earlier study (Bókony et al., 2018). We chose these ponds based on earlier data that indicated common toads breed there in sufficiently large numbers and with sim- ilar seasonal timing (Bókony et al., 2018).
We sampled common toad tadpoles at each of the nine ponds be- tween 9 and 20 May 2019, in the early phase of larval development, be- fore marked differentiation of toes. We estimated that the majority (90%) of sampled tadpoles were between developmental stages 28–31 (Gosner, 1960), and had spent at least 5 weeks in their habitat since spawning. Each pond was sampled on a different day between 0930 and 1430 h; date and time of sampling were unbiased by habitat type.
We used a non-invasive method of water-borne hormone sampling to take a baseline, stressed, and recovery sample from each tadpole. This method provides an integrated measure of corticosterone which is
repeatable within individuals, correlates with plasma levels, and re- sponds to ACTH challenge (Forsburg et al., 2019;Gabor et al., 2016, 2013;Narayan et al., 2019); the post-stress rate of recovery of GC levels provides a measure of natural negative feedback (Lattin and Kelly, 2020). Upon sampling, we quickly collected 18 tadpoles from the pond with a dip net, and placed each tadpole in a clean plastic insert (a perforated cup, to facilitate removal of tadpoles from beakers) in a 250 ml glass beaker containing 100 ml spring water. The animals were left undisturbed for 1 h to measure“baseline”corticosterone release rates, after which we moved them (with the perforated insert) into an- other beaker of 100 ml spring water. Over the next hour, the tadpoles were agitated by gently shaking their beakers for 1 min every 3 min (Forsburg et al., 2019) to measure“stressed”corticosterone release rates, then moved into a third beaker with 100 ml spring water and left undisturbed again for an hour to measure“recovery”corticosterone release rates. The three water-borne hormone samples of each animal, and a 100-ml sample of pond water for measuring the background levels of corticosterone (Gabor et al., 2018), werefiltered in thefield using coffeefilters (equivalent to grade 4filter paper) immediately after collection, stored on ice in the dark for 3–5 h while being transported into the lab, and placed in−20 °C before we measured cor- ticosterone shortly thereafter. Throughout hormone sampling we wore non-powdered nitrile gloves and we cleaned the beakers and inserts with 96% ethanol and rinsed them with reverse-osmosisfiltered water before each use. After sampling, we transported the tadpoles to the lab in individual capped containers, measured their body mass (±0.1 mg), euthanized them by cooling-then-freezing (Shine et al., 2019), and preserved each animal in 1 ml 70% ethanol.
During hormone sampling, we measured water temperature, pH, conductivity, total dissolved solids, and salinity in the pond at the loca- tion where we collected the tadpoles, using a portable electrochemistry meter (Consort C 6020 T; Consort Ltd., Turnhout, Belgium). Using test strips (WaterWorks 480009), we tested for nitrite and nitrate in the pond water (detection limits: 0.495 mg/l for nitrite, 2.2 mg/l for nitrate).
Before leaving the pond, we took a 1-l sample of pond water in an amber PETflask for measuring the concentrations of polluting chemicals; this sample was kept in the dark and on ice during transportation, and then stored at−80 °C until analysis.
2.2. Common garden experiment
On 12 March 2019, we set up 54 mesocosms by placing 45-l plastic tubs (56 × 39 × 28 cm) in an open outdoor area andfilling them with 40 l tap water. Two days later we added 0.5 l pond water and 40 g dried beech (Fagus sylvatica) leaves to each tub to set up a self- sustaining ecosystem that provided nutrients and refuge for tadpoles.
We repeated the pond-water inoculation two weeks later to ensure a sufficiently large population of phytoplankton and zooplankton. To pre- vent colonization by predators, we covered the tubs with mosquito net lids, and we removed all mosquito larvae from the pond water before inoculation.
Between 3 and 5 April, we collected common toad eggs from four freshly spawned egg strings (ca. 30 eggs per egg string) from each of the nine ponds, and transported them to our laboratory, where they were raised until developmental stage 25 (Gosner, 1960). Each family was kept in a separate plastic box (19 × 30 × 15 cm) in 2 l reconstituted soft water (48 mg NaHCO3, 30 mg CaSO4× 2 H2O, 61 mg MgSO4× 7 H2O, 2 mg KCl added to 1 l reverse-osmosisfiltered, UV-sterilized tap water). Lab temperature was 19 °C and we maintained a light-dark cycle that mimicked the natural photoperiod. On 13 April, we haphaz- ardly selected 9 tadpoles from each family, mixed together the 36 tad- poles that originated from the same pond, and randomly distributed them among 6 mesocosms for each pond, resulting in 6 tadpoles per mesocosm and a total number of 324 tadpoles in 54 mesocosms. Pond of origin was allocated to the mesocosms in a randomized block design.
Between 6 and 8 May, we took water-borne hormone samples from the tadpoles in the mesocosms using the same protocol as we applied in thefield. At this time, the captive-reared tadpoles were in similar devel- opmental stages as the free-living tadpoles were at hormone sampling.
We sampled 3 tadpoles from each tub (18 tadpoles in total per pond of origin), totaling 162 tadpoles; 54 per day. Sampling took place between 0900 and 1330 h each day. The order of sampling of the tubs followed a randomized block design such that two tubs per pond were sampled each day, and both date and time of day were balanced among the three habitat types. After sampling, we measured the body mass (±
0.1 mg) of each tadpole and released them back to their tubs; after com- pletion of the experiment, tadpoles were transported back to their ponds of origin. The water-borne hormone samples werefiltered after removing the tadpoles and stored at −20 °C until measuring corticosterone.
2.3. Measuring corticosterone
We extracted corticosterone from the water samples following an established protocol (Gabor et al., 2016). Briefly, we extracted hor- mones from the water samples using C18 solid phase extraction (SPE) columns (SepPak Vac3 cc/500 mg; Waters, Inc., Milford, MA, USA) primed with 100% HPLC-grade methanol (4 ml) and distilled water (4 ml). We then froze the columns and transported them from Hungary to Texas. Once defrosted, we eluted columns with 4 ml methanol into borosilicate vials, followed by evaporation with nitrogen gas. After dry- ing, we re-suspended the residue in a total volume of 500μl consisting of 5% ethanol (95% lab grade) and 95% enzyme-immunoassay (EIA) buffer (Cayman Chemicals Inc., Ann Arbor, MI, USA).
We measured corticosterone concentration in duplicates for all sam- ples using Corticosterone EIA kits (№501320, Cayman Chemical Com- pany, Inc.; assay has a range of 8.2–5000 pg/ml and a sensitivity (80%
B/B0) of approximately 30 pg/ml). Sample absorbance was read on a spectrophotometer plate reader at 405 nm (BioTek 800XS). Inter-plate variation was 14.3% for thefield data (13 plates; range: 0.07–17.7%) and 9.28% for mesocosms (9 plates; range: 0.31–8.08%).
Both in thefield and in the mesocosms, we sampled 162 tadpoles (18 per pond) to ensure adequate sample size allowing for accidental loss of samples due to spillage, problems during extracting through SPE or at the plating stage. Because of the high cost of SPE columns and EIA kits, we aimed to analyze 16 tadpoles per pond in thefield and 12 tadpoles per pond in the mesocosms (we expected lower vari- ance in the common garden experiment than in thefield). However, ourfinal sample sizes were somewhat lower (Table 2) due to sample loss during sample processing and measurement.
2.4. Detecting pathogen infections
All free-living tadpoles included in the analyses of corticosterone re- lease rates were tested forBd, and 30% were tested forRanavirus(for sample sizes, seeTable 2). Mouthparts and tail-clips of tadpoles were excised using sterile scalpels and preserved in 70% ethanol. Both tissue sections of the same animal were extracted together in the MNCN- CSIC lab (Madrid, Spain) by using the DNeasy Blood and Tissue Kit (Qiagen, Hilden, Germany), following the manufacturer's protocol.
Then, two independent quantitative PCRs, one forBdand one for Ranaviruswere performed followingBoyle et al. (2004)andLeung et al. (2017), respectively, on a MyGo Pro qPCR machine. Negative con- trols and standards with known concentrations ofBdandRanavirus were used in each plate. A sample was considered positive when its in- fection load was equal to or higher than 0.1 genomic equivalents of zoo- spores forBdor 3 virions forRanavirus(the smaller standards we used), and the amplification curve presented a robust sigmoidal shape.
2.5. Measuring water pollutants
In the 1-l pond water samples we measured the concentration of 23 endocrine disrupting compounds that can affect glucocorticoid signal- ing pathways (see Table S1 for full list of compounds), including steroid hormones and pharmaceutical drugs that get into natural water bodies via wastewater and agricultural runoff (Lange et al., 2002;Macikova et al., 2014). Additionally, we measured the concentration of carbamaz- epine which is considered a general marker for wastewater pollution (Nakada et al., 2008;Tran et al., 2014). For all compounds, we applied a newly developed UPLC-UniSpray™MS/MS analysis as follows.
Samples were collected into brown polyethylene terephthalate (PET) bottles atfield sites then transferred to the laboratory where they were frozen and stored at−80 °C until preparation. Following thawing 40 ml of water wasfiltered through 0.22μm PTFE syringefilters into 50 ml centrifuge tubes. Afterwards 5 ml of methanol including the internal standard (carbamazepine-d10;final concentration: 5 ng/L) with/without spiking standards in two levels (final concentrations: 5 and 25 ng/l) was added to reach thefinal volume of 45 ml. After vortexing, solid phase extraction was applied with SampliQ (C18; 3 ml; 500 mg) cartridges (Agilent Technologies; Santa Clara, California, USA). Cartridges were conditionedfirst with 6 ml methanol, then with 3 ml of 10 v/v% methanol in water. After conditioning samples were loaded; when necessary slight vacuum was applied. Washing of car- tridges was done with 3 ml of 10 v/v% methanol in water, while elution was done with 3 ml of methanol. Eluates were evaporated to dryness at 50 °C in a vacuum centrifuge. Samples were dissolved in two steps,first in 0.2 ml methanol followed by adding 0.2 ml water, and then they were Table 1
The studied ponds' geographical coordinates, habitat type (N: natural, A: agricultural, U: urban), proportion of each major type of land-use cover in a 500-m wide belt around the pond, and concentration of pollutants detected in the pond water at the time of tadpole sampling (CARB: carbamazepine, TEST: testosterone, PROG: progesterone, HCOR: hydrocortisone or cortisol, FLUO:fluocinolone acetonide; values that are below but close to the limit of quantification and well above the limit of detection are marked with asterisk).
Pond
Geographical coordinates (latitude, longitude)
Percentage of land-use cover (%)
Habitat type
Concentration (ng/l) of pollutants Forest Pasture Arable
field
Residential area
Road Industrial area
CARB TEST PROG HCOR FLUO
Apátkút 47.77444, 18.98624 88.8 8 0 0.7 1.8 0.8 N 0.860 0.219 <0.2 <1 <2
Bajdázó 47.903382, 18.978482 97.0 2.2 0 0 2.4 0 N <0.2 <0.2 <0.2 0.646 1.573⁎
Szarvas-tó 47.881829, 18.942020 97.3 0 0 0 1.5 1.2 N <0.2 <0.2 <0.2 <1 <2
Határrét 47.646376, 18.909233 28.4 13.7 48.4 7 2.6 0 A 175.667 <0.2 <0.2 <1 <2
Juliannamajor 47.551195, 18.926707 63.5 9.6 21.6 2 1.5 1.8 A 0.175⁎ 0.355 0.266 <1 1.657⁎
Perőcsény 47.986458, 18.841379 49.8 14.1 34.6 0 1.4 0 A 2.090 <0.2 <0.2 <1 <2
Nagykovácsi 47.576402, 18.868515 47.6 15.6 2.5 28.7 3.9 1.8 U 0.541 0.250 2.343 <1 <2
Pesthidegkút 47.569349, 18.954981 15.6 0 1.3 72.4 7.7 3.1 U 0.483 <0.2 <0.2 <1 <2
Pilisszentiván 47.606498, 18.909010 28.2 0 0 45.5 7.6 17.3 U 13.633 <0.2 0.323 <1 <2
vortexed andfiltered through 0.22μm PTFE syringefilters. Final sample concentration ratio was 100×.
Samples were injected into an Acquity I-class UPLC system con- nected to a Xevo TQ-XS Mass spectrometer (Waters; Milford, MA, USA) equipped with a BEH C18column (100 × 2.1 mm; 1.7μm; Waters).
Injection volume was 5μl and the autosampler temperature was set to 8
°C. Eluent“A”was H2O, while eluent“B”was methanol containing 0.1 v/
v% formic acid. The column was kept at 40 °C. Gradient elution at 0.3 ml/min was set as follows: 0 min 50% B, 0–8 min up to 64% B, 8–11 min up to 84% B, 11–12 min to 100% B, 12–15 min hold 100% B, 15–15.5 min return to 50% B, andfinally 15.5–18 min equilibration with 50% B.
For 17-alpha-ethinylestradiol and 17-beta-estradiol, a different gra- dient setup with a shorter BEH C18column (50 × 2.1 mm; 1.7μm; Wa- ters) was used: eluent“A”was H2O with 0.05 v/v% ammonia and eluent
“B”was methanol. Injection volume was 10μl, and gradient elution at 0.5 ml/min was as follows: 0 min 30% B, 0–8 min up to 50% B, 8–8.25 min up to 95% B, 8.25–9 hold 95% B, 9–10 min equilibration at 30% B.
All solvents and chromatographic reagents were UPLC-MS grade and purchased from VWR International (Radnor, Pennsylvania, USA), while water (18.2 MΩ·cm) was obtained with a Milli-Q system (Merck-Millipore, Burlington, MA, USA).
Compounds of interest were infused into the mass spectrometer and optimized for MRM experiments with a classic ESI source, while for measurements a UniSpray™ion source was applied. Optimized MRM transitions are summarized in Table S2. Argon (5.0 purity) was used as collision gas with 0.15 ml/min in the collision cell and nitrogen was used as source gas. UniSpray™source settings were as follows for both positive and negative modes: capillary voltage 2.5 kV; desolvation temperature 550 °C; desolvation gasflow 1000 L/h; cone gasflow 300 l/
h; nebulizer pressure 6.5 bar. Data processing was carried out with MassLynx version 4.2 in TargetLynx software (Waters). For quantifica- tion, external calibration was used in the linear dynamic range of 0.05 ng/ml–10 ng/mL (0.5–100 ng/l) where R2was at least 0.998 (linear with 1/x weighting) for all components. Recovery tests were conducted at 5 and 25 ng/l levels for both chromatographic methods, as summa- rized in Table S2. Reference material purchased, purity and solvents used for stock solutions are listed in Table S3.
2.6. Statistical analyses
We quantified corticosterone release rates as the amount of water- borne corticosterone measured over 1 h, divided by tadpole body mass (pg/g/h), and we used its 10-base logarithm in our statistical anal- yses. We did not correct for developmental stage because body mass is correlated with developmental stage in young tadpoles, and corticoste- rone levels do not differ across Gosner stages 25–40 (Glennemeier and Denver, 2002). We used the R computing environment (v. 3.6.3) for all statistical analyses (R Core Team, 2020). First, we used a linear mixed-
effects model (LMM;‘lme’function in package‘nlme’) to test if tadpoles in thefield and in the mesocosms showed stress response (i.e. signifi- cant difference between baseline and stressed corticosterone release rates) and negative feedback (i.e. significant difference between stressed and recovery corticosterone release rates). We used the three consecutive samples of each individual as repeated measures, and we tested thefixed effects of venue (field or mesocosms), sample (baseline, stressed, and recovery corticosterone release rate), and their interac- tion. Individual identity was included as a random factor. We calculated a type-2 analysis-of-deviance table to test the main effects of venue and sample, and their interaction, using the‘Anova’function in package‘car’. We extracted the model's estimated marginal means and compared pairwise the three categories of sample separately for the two venues, and corrected the significance level with the false discovery rate (FDR) method, using the‘emmeans’package.
Second, we tested if baseline, stressed, and recovery corticosterone release rates, and the magnitude of stress response and negative feed- back differed among the three habitat types (natural, agricultural, and urban) separately in the two venues. We used two variables to quantify the magnitude of stress response: the absolute stressed levels of cortico- sterone release rates, and the relative change of corticosterone release rate in response to stress (stress-induced change: 100 × (stressed− baseline) / baseline). Similarly, we quantified negative feedback as the relative change from stressed to recovery levels as: 100 × (stressed− recovery) / stressed (Lattin and Kelly, 2020). Because the values of stress-induced change were strongly right-skewed whereas the values of negative feedback were strongly left-skewed, we applied power transformations (power ¼ for the former and power 4 for the latter) to ensure that the residuals conform to the assumptions of normality and homoscedasticity. Because both variables had negative values, for each variable the |minimum value−1| was added to all values before power transformation.
For each of thefive dependent variables (baseline, stressed, and re- covery corticosterone release rates, stress-induced change, and negative feedback), we used the‘geeglm’function in the‘geepack’package to build two generalized estimation equations (GEE) models: one for the field data and one for the mesocosms. GEE is a population-averaging method that can handle the correlation structure of our data (i.e. tad- poles from the same pond are not independent, but the pond effect is nested within the habitat effect) appropriately and without penalizing power (Zuur et al., 2009). We analyzed the venues separately because the correlation structure as well as the relevantfixed effects differed be- tween venues. In thefield, pond identity was a significant random effect (Table S4), and the relevantfixed effects included the actual levels of pollution and date as a numeric covariate. In the mesocosms, tub iden- tity was a significant random effect whereas pond of origin was not (Table S4), and date had only 3 different values so it could not be used as a numeric covariate; we did not consider the pollution levels (mea- sured in the ponds one month after taking the eggs into the common Table 2
Sample sizes: number of tadpoles with usable corticosterone data in thefield/in the common garden experiment; and the number of free-living tadpoles tested forBatrachochytrium dendrobatidis(Bd)/Ranavirus(Rv).
Pond Baseline Stressed Recovery Stress-induced change Negative feedback Bd/Rv
Corticosterone release rate
Apátkút 16/13 16/13 16/12 16/13 16/12 16/8
Bajdázó 17/13 17/13 17/13 17/13 17/13 17/4
Szarvas-tó 16/14 15/13 16/12 15/13 15/12 16/5
Határrét 16/14 16/13 16/14 16/13 16/13 15/6
Juliannamajor 16/12 16/12 16/12 16/12 16/12 16/5
Perőcsény 16/13 14/14 16/13 13/13 13/13 16/4
Nagykovácsi 16/14 17/13 15/13 16/13 15/12 17/4
Pesthidegkút 16/14 16/15 16/13 16/13 16/13 15/5
Pilisszentiván 15/13 15/12 15/12 15/12 15/12 16/3
Total 144/120 142/118 143/114 140/115 139/112 144/44
garden) as predictor for the tadpoles in the mesocosms. Therefore, in the GEE models of thefield data, we tested the followingfixed effects:
habitat type, date (number of days since 1st May), time of day (number of hours since 0800 h), carbamazepine concentration, and total concen- tration of corticoid-disrupting chemicals; the latter two variables were transformed as log10(x + 0.1) to ensure normal distribution and homo- scedasticity of model residuals. There was no multi-collinearity be- tween the predictors included in the models (variance inflation factor:
VIF < 1.7); we did not include water-temperature and water-quality variables because of their multi-collinearity with the other predictors (VIF > 2.2). The random factor in these models was pond identity. In the GEE models of the mesocosms data, we tested thefixed effects of habitat type, date (as a 3-category factor), and time of day; the random factor was tub identity. All numeric predictors were mean-centered.
3. Results
Ponds in anthropogenic habitats tended to have higher water tem- perature, pH, conductivity, total dissolved solids, and salinity values compared to natural ponds (Figs. S1b, S2). We detected carbamazepine in all anthropogenic ponds and in one natural pond (Table 1). Out of the studied 23 corticoid disruptors, we detected 4 in at least one pond (Table 1); the number of chemicals detected per pond was unrelated to habitat type (Fisher's exact test:P> 0.999). Corticosterone concen- trations in pond water were higher in agricultural than in urban ponds, but did not differ systematically between natural and anthropo- genic ponds (Fig. S3). The concentrations of nitrite or nitrate were below detection limit in all ponds. None of the free-living tadpoles tested positively for eitherBdorRanavirus.
Corticosterone release rates were significantly affected by venue (LMM:χ2= 1168.9, df = 1,P< 0.001), sample (χ2= 197.6, df = 2,P
< 0.001), and their interaction (χ2= 156.4, df = 2,P< 0.001). Tadpoles mounted a significant stress response (stressed levels were significantly higher than baseline levels) and then showed significant negative feed- back (recovery levels were significantly lower than stressed levels) both in thefield and in mesocosms (Table 3,Fig. 1). The recovery levels were significantly higher than the baseline levels in the mesocosms but did not differ significantly from baseline in thefield (Table 3,Fig. 1).
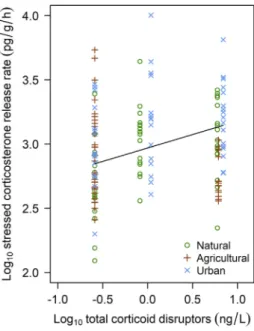
In the free-living tadpoles, we found several differences between natural and anthropogenic habitats (Table 4,Fig. 1). Tadpoles in urban ponds had higher baseline and stressed corticosterone release rates than tadpoles in natural ponds; their stress-induced change did not dif- fer significantly (Table 4,Figs. 1, S4). In contrast, tadpoles in agricultural ponds had similar corticosterone release rates but greater stress- induced change compared to tadpoles in natural ponds (Table 4, Figs. 1, S4). Tadpoles in both urban and agricultural ponds exhibited stronger negative feedback, their corticosterone release rates returning to similar recovery levels, compared to tadpoles in natural ponds (Table 4,Figs. 1, S4). Furthermore, tadpoles in ponds with higher con- centrations of corticoid disruptors had higher stressed and recovery cor- ticosterone release rates and greater stress-induced change (Table 4, Figs. 2–3), and the rate of stress-induced change increased with carba- mazepine concentration (Table 4,Fig. 3).
In the common garden experiment, tadpoles had lower corticoste- rone release rates but greater stress-induced change compared to free-living tadpoles (Table S5,Fig. 1). The habitat type of their origin had no significant effect on any of the studied hormonal variables (Table 5,Fig. 1). This lack of habitat effect is not attributable to power is- sues, because power estimation showed that our data had good power for detecting the same differences in the mesocosms as we did in the field (99%, 90%, and 87% power for baseline, stressed, and recovery levels, respectively). In both venues, most of the studied hormone vari- ables varied significantly with date and time of day (Tables 4–5).
4. Discussion
As anthropogenic environmental change continues, there is a grow- ing need to understand how organisms cope with such changes. We ex- plored the glucocorticoid profiles of larval common toads across three habitat types and used a common garden experiment to explore the role of persistent population divergence in these responses. In the free-living tadpoles, we found differences in the rates of both the stress response and its negative feedback associated with land use and water pollution, whereas none of these differences persisted in the common garden.
In accordance with our prediction, our study suggests stronger neg- ative feedback in the HPI axis of common toad tadpoles in anthropo- genic habitats than in tadpoles living in natural habitats. Over the 1 h recovery period after the agitation test, tadpoles in both urban and agri- cultural ponds showed greater downregulation of corticosterone re- lease rates relative to their stressed rates, indicating that their negative feedback had greater scope (magnitude) and/or faster speed Table 3
Pairwise comparisons (c: linear contrasts, estimated from linear mixed model) of corticoste- rone release rates (log10pg/g/h) between samples in each venue.P-values were corrected with the FDR method; df = 509.
Venue Contrast c ± SE t P
Field Stressed–baseline 0.091 ± 0.029 3.13 0.003
Stressed–recovery 0.104 ± 0.029 3.60 0.001
Recovery–baseline −0.014 ± 0.029 −0.47 0.636 Mesocosms Stressed–baseline 0.54 ± 0.032 16.96 <0.001
Stressed–recovery 0.073 ± 0.032 2.26 0.024
Recovery–baseline 0.467 ± 0.032 14.59 <0.001
Fig. 1.Corticosterone release rates of tadpoles in thefield (“free”;filled symbols) and in the common garden experiment (“captive”; empty symbols) by habitat type of their pond of origin. Error bars represent means and standard errors as predicted by the models inTables 4–5; the slopes of the lines connecting the error bars illustrate the rates of stress-induced change (baseline to stressed) and negative feedback (stressed to recovery). Asterisks and crosses stand for significant differences in thefield between natural ponds and either agricultural or urban ponds for corticosterone release rates (asterisks above the error bars:⁎P< 0.05) or for the rates of stress-induced change and negative feedback (crosses above the lines connecting error bars:†P< 0.05,††P< 0.01).
(Taff and Vitousek, 2016) compared to tadpoles in natural habitats. This finding aligns with recent suggestions that the GC negative feedback is an important determinant of the capacity to cope with stress and thus should be favored in populations facing frequent stressors (Narayan et al., 2019;Vitousek et al., 2019;Wingfield, 2013). Although we have no data to assess if the stronger negative feedback is adaptive in anthro- pogenic habitats, empirical evidence suggests that more efficient nega- tive feedback hasfitness benefits under stressful conditions (Romero and Wikelski, 2010;Zimmer et al., 2019). As high GC levels can be det- rimental to early-life growth and development in amphibians (Crespi et al., 2013), the ability to quickly shut down the stress response after the stressor ceased should protect the tadpoles from chronic GC eleva- tion and its pathological consequences (Romero et al., 2009;
Wingfield, 2013).
This protective effect of strong negative feedback may explain why we, and several previous studies on other species (Bonier, 2012;Sepp et al., 2018), did notfind attenuated stress responses in anthropogenic habitats. Although reduced stress responsiveness may also protect the organism from phenotypic damage and the“wear and tear”effect of re- peated stress responses (Romero et al., 2009), a weak stress response may be insufficient for adequately dealing with stressful stimuli (Vitousek et al., 2019). A strong stress response may be especially adap- tive when the likelihood of unpredictable stressors is high (Romero, 2002), because stress-induced GCs have preparative actions that pre- pare the organism for a“better”response to a subsequent stressor (Sapolsky et al., 2000), and may increase the threshold of severity nec- essary for the subsequent stimuli to become stressors (Vera et al., 2017).
Thus, instead of dampening the GC stress response, the ability to quickly
“turn it on and off”may be the best strategy in stressful environments (Vitousek et al., 2019). Supporting this idea, birds mounting a strong stress response coupled with strong negative feedback are less likely to abandon incubation upon stress (Zimmer et al., 2019) and can breed in disturbed locations (Soldatini et al., 2015). Our tadpole study aligns with thesefindings, because we found higher stressed corticoste- rone release rates in urban ponds and proportionally greater stress- induced increase in agricultural than in natural ponds. Currently, it is not clear whether the stressed levels of GC or their stress-induced in- crease better predict the transcriptomic, phenotypic, andfitness effects of stress (Vitousek et al., 2018). All else being equal, a higher absolute GC concentration has stronger effects (Romero, 2004), suggesting that urban but not agricultural tadpoles responded more to agitation than tadpoles in natural ponds did. However, all else is rarely equal: the ef- fects of GCs depend on other components of the HPA/I axis, including the abundance of GC receptors, corticosteroid binding globulins, and en- zymes that metabolize GCs (Breuner et al., 2003;Lattin and Kelly, 2020).
For example, long-term elevation of baseline GCs can be accompanied by decreased receptor production and thus diminished biological effects at a given GC concentration (Romero, 2004). Therefore, the increase from baseline to acute stressed GC levels might better express the strength of the stress response when organisms differ in their baseline levels (Vitousek et al., 2018). This scenario, in contrast, suggests that ag- ricultural but not urban tadpoles responded more to agitation than tad- poles in natural ponds did. Because urban but not agricultural tadpoles had higher baseline levels than tadpoles in natural ponds, our results Table 4
Coefficients (b) of GEE models for corticosterone release rates (CORT; log10pg/g/h), their stress-induced change, and negative feedback in thefield.
Dependent variable Model coefficientsa b± SE Wald χ2
P
Baseline CORT Natural habitat 2.771 ± 0.098 806.57 <0.001 Agricultural–natural 0.001 ± 0.089 <0.01 0.996 Urban–natural 0.217 ± 0.085 6.55 0.011
Carbamazepine −0.032 ±
0.036
0.82 0.366 Corticoid disruptors 0.052 ± 0.083 0.40 0.530 Date (days from May
1)
−0.015 ± 0.014
1.22 0.269 Time of day 0.180 ± 0.040 20.16 <0.001 Stressed CORT Natural habitat 2.906 ± 0.107 744.12 <0.001 Agricultural–natural 0.067 ± 0.099 0.45 0.502 Urban–natural 0.230 ± 0.092 6.18 0.013 Carbamazepine 0.005 ± 0.034 0.02 0.880 Corticoid disruptors 0.209 ± 0.077 7.38 0.007 Date (days from May
1)
−0.043 ± 0.013
11.38 0.001 Time of day 0.221 ± 0.039 31.24 <0.001 Recovery CORT Natural habitat 2.919 ± 0.097 901.27 <0.001 Agricultural–natural 0.019 ± 0.083 0.05 0.821 Urban–natural 0.129 ± 0.085 2.30 0.129
Carbamazepine −0.038 ±
0.023
2.77 0.096 Corticoid disruptors 0.199 ± 0.050 15.82 <0.001 Date (days from May
1)
−0.053 ± 0.008
46.49 <0.001 Time of day 0.158 ± 0.026 35.97 <0.001 Stress-induced
changeb
Natural habitat 0.110 ± 0.027 16.26 <0.001 Agricultural–natural 0.106 ± 0.035 8.98 0.003 Urban–natural 0.032 ± 0.025 1.61 0.204 Carbamazepine 0.030 ± 0.012 6.84 0.009 Corticoid disruptors 0.143 ± 0.015 93.90 <0.001 Date (days from May
1)
−0.029 ± 0.003
103.18 <0.001
Time of day 0.051 ± 0.018 7.84 0.005
Negative feedbackc Natural habitat −0.018 ± 0.038
0.24 0.626 Agricultural–natural 0.066 ± 0.034 3.88 0.049 Urban–natural 0.103 ± 0.034 9.25 0.002 Carbamazepine 0.034 ± 0.022 2.45 0.118 Corticoid disruptors −0.010 ±
0.053
0.04 0.843 Date (days from May
1)
0.010 ± 0.008 1.40 0.236
Time of day 0.080 ± 0.027 8.68 0.003
aIn each model, thefirst coefficient is the estimated mean for the natural habitat, whereas the second and third coefficients are the mean differences of agricultural and ur- ban habitats, respectively, from the natural habitat. The remaining coefficients give the es- timated change in the dependent variable in response to a unit increase in the predictor variable.
b Stress-induced change in CORT was calculated as 100 × (stressed−baseline) / baseline CORT, and transformed to power ¼ after adding the |minimum value−1|.
c Negative feedback was calculated as 100 × (stressed−recovery) / stressed CORT, and transformed to power 4 after adding the |minimum value−1|.
Fig. 2.Stressed corticosterone release rates of free-living tadpoles in relation to the concentration of corticoid disruptors in pond water. The line wasfitted from the GEE model inTable 4.
on stressed levels and stress-induced change may altogether suggest stronger stress response in both types of anthropogenic habitats. We propose that stronger negative feedback allows for stronger stress re- sponses in such habitats, offering an alternative (and potentially more advantageous) strategy for minimizing the time spent at high GC levels;
and we suggest that this may be a widespread reason for notfinding a dampened stress response in urban animals.
We also observed higher baseline corticosterone release rates of tad- poles in urban ponds than in the tadpoles in the other habitat types. El- evated baseline GC levels are often interpreted as a sign of chronic stress; however, chronic stress can either increase or decrease or have no effect on baseline GC levels (Dickens and Romero, 2013). Pathogenic infections may also elevate GC levels (Gabor et al., 2015, 2013;Raouf et al., 2006;Warne et al., 2011), but we detected neitherRanavirus norBd in our tadpoles even though both are present in Hungary (Vörös et al., 2020, 2018). Alternatively, higher baseline levels may be adaptive in several, mutually non-exclusive ways. Baseline GCs have permissive effects that allow the organism to perform better under stress (Sapolsky et al., 2000), thus temporal variation in baseline GC levels has been proposed to serve as preparation for periods of high po- tential exposure to adverse conditions (Romero, 2002). Similarly, spa- tial variation in the likelihood of exposure to stressful stimuli may explain the difference we observed between tadpole populations. Fur- thermore, because GC levels are upregulated during times of increased energetic demands (Romero, 2002), it is possible that urban tadpoles need a higher baseline for maintaining a higher metabolic rate. For ex- ample, urban ponds are often more polluted (Bókony et al., 2018), which may favor higher detoxification rates, thereby increasing energy demands. In our present study, concentrations of a general wastewater marker, carbamazepine were relatively high in urban ponds, although they were also high in two agricultural ponds where baseline corticoste- rone release rates were not elevated, and we found no correlation be- tween baseline corticosterone release rates of tadpoles and carbamazepine concentrations across our ponds. However, urban ponds had higher conductivity, total dissolved solids, and salinity, sug- gesting contamination by other toxicants such as de-icing salts, which can increase baseline corticosterone levels in amphibians (Chambers, 2011;Goff et al., 2020;Hall et al., 2017). Furthermore, higher metabolic rates may also result from the urban heat island effect which makes urban ponds warmer than rural ponds (Brans et al., 2018).
We found no close relationship between anthropogenic land use and carbamazepine concentrations, and the total amount of corticoid- disrupting compounds varied independently of both land use and car- bamazepine (reflecting overall pollution) levels. In turn, each of these three aspects of anthropogenic environmental change had some effects on the tadpoles' corticosterone profiles. The concentrations of both car- bamazepine and corticoid disruptors were positively correlated with the stress-induced change, and more corticoid disruptors in pond water were accompanied by higher stressed corticosterone release rates in tadpoles. These results suggest that various chemical contami- nants may contribute to altered GC physiology even in habitats where land use does not indicate strong anthropogenic influence, supporting previousfindings that even non-anthropogenic ponds can be contami- nated by various endocrine disruptors (Bókony et al., 2018). Further- more, we did notfind increased prevalence of two major amphibian pathogens in anthropogenic ponds, despite that both pathogens are presumed to be vectored in association with human activities (St- Amour et al., 2008) and are found throughout Hungary (Vörös et al., 2020, 2018). These results highlight that the stressors faced by wild an- imals may vary in complex ways across gradients of anthropogenic en- vironmental change.
Our common garden experiment showed that the differences ob- served in free-living tadpoles' corticosterone profiles did not persist when the animals were raised in captivity in uncontaminated water, suggesting that individual phenotypic plasticity was responsible for the differences in thefield, rather than persistent divergence between populations. Thisfinding contrasts the results of two previous studies on birds, which suggested that evolutionary divergence or other transgenerational (e.g., maternal or epigenetic) effects were responsible for generating differences in GC stress response between urban and non-urban populations (Atwell et al., 2012;Partecke et al., 2006), al- though a third avian study found that phenotypic plasticity played a more important role in generating such differences in baseline GC levels (Ouyang et al., 2019). Our present results parallel thefindings of an ear- lier study (conducted with partly the same tadpole populations), which showed higher chemical defense in toads at urban and agricultural sites that did not persist in a common garden experiment (Bókony et al., 2019). A potential explanation for this apparent importance of pheno- typic plasticity is that anthropogenic environments may exert complex selection forces on tadpole physiology because of spatio-temporal Fig. 3.Stress-induced change of corticosterone release rates in free-living tadpoles in relation to the concentrations of corticoid disruptors and carbamazepine in pond water. Error bars represent means and standard errors as predicted by the model inTable 4. Stress-induced change in corticosterone release rates was calculated as 100 × (stressed−baseline) / baseline.
Both axes are shown on transformed scale, as used in the analyses (Y¼, log10X).
heterogeneity in the frequency and type of stressors, which should then favor the evolution and maintenance of phenotypic plasticity (Bradshaw and Hardwick, 1989;Moran, 1992;Sultan and Spencer, 2002). Alternatively, evolutionary adaptation may be constrained by low heritability, although the latter seems unlikely for GCs which are heritable in various species (Guindre-Parker, 2018).
An alternative explanation for our results may be genotype-by- environment interaction (G × E). Specifically, it is possible that the GC differences between free-living populations were due to genetic differ- ences that were expressed in the wild but did not get expressed in the captive environment. Although we cannot rule out this possibility, G × E is a less parsimonious explanation for ourfindings than phenotypic plasticity alone, because G × E requires not one, but two, processes: ge- netic differentiation between populations (explaining ourfield results) and phenotypic plasticity (explaining the lack of phenotypic differences in the common garden). While there is empirical evidence that genetic differences may be“hidden”by differences in phenotypic plasticity, in- creased phenotypic variability due to latent genetic variability often
becomes expressed when the organisms are taken out from the envi- ronment to which they have adapted (DeWitt and Scheiner, 2004).
This pattern is the opposite of what we found, since the GC differences between populations diminished, rather than increased, in the common garden. Nevertheless, further study is needed to explicitly test the role of G × E, by performing the common-garden experiment in several dif- ferent environments.
Taken together, our study demonstrated marked differences be- tween natural and anthropogenic habitats in the GC stress physiology of toad tadpoles, which were related partly to land use and partly to chemical pollution. Both urban and agricultural populations showed stronger negative feedback, and by some measures also stronger stress response, compared to populations in natural habitats, supporting the idea that dynamic regulation of the GC stress response is an important component of stress coping capacity that is favored in anthropogenic environments (Narayan et al., 2019;Vitousek et al., 2019). Our common garden experiment demonstrates that the differences observed be- tween populations are unlikely to have resulted from microevolution or transgenerational effects. Altogether, our results suggest that toad tadpoles upregulate their GC negative feedback efficiency, a major com- ponent of endocrineflexibility, by phenotypic plasticity in response to stressors in anthropogenic environments. To understand the conse- quences of these changes, more research will be needed to elucidate how the scope and speed of endocrineflexibility at multiple levels of GC regulation (Guindre-Parker, 2018;Lattin and Kelly, 2020;Taff and Vitousek, 2016;Vitousek et al., 2019) affect individualfitness and pop- ulation viability in our human-modified world.
Funding
The study was supported by a Fulbright Research Grant to CRG, and by the NRDI Fund of the National Research, Development and Innova- tion Office of Hungary (grants "OTKA"-115402 and 2019-2.1.11-TÉT- 2019-00026 to VB). GINOP-2.3.3-15-2016-00018 supported the UPLC- MS/MS analysis. None of the funding sources had any influence on the study design, collection, analysis, and interpretation of data, writing of the paper, or decision to submit it for publication.
CRediT authorship contribution statement
Veronika Bókony:Conceptualization, Methodology, Investigation, Formal analysis, Visualization, Writing - original draft, Supervision, Funding acquisition.Nikolett Ujhegyi:Investigation, Writing - review
& editing.Kamirán Á. Hamow: Investigation, Writing - review &
editing.Jaime Bosch:Investigation, Writing - review & editing.Barbora Thumsová:Investigation, Writing - review & editing.Judit Vörös:In- vestigation, Writing - review & editing.Andrea S. Aspbury:Conceptual- ization, Methodology, Investigation, Writing - review & editing.Caitlin R. Gabor:Conceptualization, Methodology, Investigation, Supervision, Visualization, Funding acquisition, Writing - review & editing.
Declaration of competing interest
The authors declare that they have no known competingfinancial interests or personal relationships that could have appeared to influ- ence the work reported in this paper.
Acknowledgements
We thank Attila Hettyey, János Ujszegi, Márk Szederkényi, Dóra Holly, Bálint Üveges for helpful advice and technical assistance, Annika Gabor, Elek Aspbury-Gabor, Zoltán Gál and Bálint Üveges for help with hormone sampling, Zoltán Tóth for the electrochemistry meter, Ágnes Móricz for the vacuum pump for hormone extractions, Alex Guzman for help with hormone extractions, and Mihály Dernovics for help and advice in sample preparation for UPLC-MS/MS.
Table 5
Coefficients (b) of GEE models for corticosterone release rates (CORT; log10pg/g/h), their stress-induced change, and negative feedback in the common garden experiment.
Dependent variable Model coefficientsa b± SE Waldχ2 P Baseline CORT Natural habitat, May
6
0.952 ± 0.041 530.12 <0.001 Agricultural–natural 0.044 ± 0.069 0.40 0.530 Urban–natural 0.054 ± 0.066 0.67 0.410 Date (May 7–May 6) 1.086 ± 0.115 88.71 <0.001 Date (May 8–May 6) 1.061 ± 0.140 57.70 <0.001 Time of day 0.569 ± 0.128 19.78 <0.001 Stressed CORT Natural habitat, May
6
1.651 ± 0.059 777.69 <0.001 Agricultural–natural 0.076 ± 0.062 1.49 0.223 Urban–natural 0.053 ± 0.058 0.83 0.361 Date (May 7–May 6) 0.593 ± 0.106 31.57 <0.001 Date (May 8–May 6) 0.529 ± 0.105 25.22 <0.001
Time of day 0.275 ± 0.109 6.35 0.012
Recovery CORT Natural habitat, May 6
1.482 ± 0.041 1317.94 <0.001 Agricultural–natural −0.013 ±
0.058
0.05 0.817 Urban–natural 0.036 ± 0.052 0.48 0.486 Date (May 7–May 6) 0.601 ± 0.127 22.33 <0.001 Date (May 8–May 6) 0.831 ± 0.131 40.05 <0.001
Time of day 0.223 ± 0.107 4.40 0.036
Stress-induced changeb
Natural habitat, May 6
0.698 ± 0.073 91.60 <0.001 Agricultural–natural 0.046 ± 0.093 0.24 0.624 Urban–natural 0.001 ± 0.084 <0.01 0.993 Date (May 7–May 6) −0.522 ±
0.146
12.79 <0.001 Date (May 8–May 6) −0.545 ±
0.185
8.71 0.003
Time of day −0.322 ±
0.156
4.28 0.039 Negative feedbackc Natural habitat, May
6
0.182 ± 0.055 11.10 0.001 Agricultural–natural 0.059 ± 0.071 0.69 0.407 Urban–natural 0.028 ± 0.060 0.23 0.634 Date (May 7–May 6) 0.044 ± 0.113 0.15 0.695 Date (May 8–May 6) −0.262 ±
0.115
5.16 0.023
Time of day 0.115 ± 0.119 0.93 0.336
aIn each model, thefirst coefficient is the estimated mean for tadpoles from the natural habitat on May 6, whereas the second and third coefficients are the mean differences of tadpoles from agricultural and urban habitats, respectively, from the natural habitat. Sim- ilarly, coefficients for date are the differences between May 6 and later days. Coefficients for time of day give the estimated change in the dependent variable in response to an hour increase in time.
b Stress-induced change in CORT was calculated as 100 × (stressed−baseline) / baseline CORT, and transformed to power ¼ after adding the |minimum value−1|.
c Negative feedback was calculated as 100 × (stressed−recovery) / stressed CORT, and transformed to power 4 after adding the |minimum value−1|.