Forest Fire Risk Assessment Model Using Remote Sensing and GIS Techniques in Northwest Algeria
Abdelkader BENGUERAI*– Khéloufi BENABDELI – Abdelkader HARIZIA Faculty of Nature Sciences and Life, Laboratories for Geo-Environment and Spatial Development (LGESD),
University of Mascara, Mascara, Algeria
Abstract – Algeria loses more than 20,000 hectares of forest to fire every year. The losses are costly both in terms of life and property damage, which weighs heavily on the environment and the local economy. Geomatics can complement the conventional methods used in fire hazard prevention and management. The objective of our study is to use the geographic information system (GIS) and the Remote Sensing (RS) technology to develop the fire risk assessment map of the forest massif of Zelamta located in Southeast Mascara province (Northwest Algeria). The methodology employed was an empirical model involving three parameters that can control fire behaviour: geomorphology, vegetal cover combustibility, and human activity. The obtained results can help in the decision-making process as well as provide cartographic support for forest fire prevention and management.
mapping / fire risk model / Zelamta forest / Algeria
Kivonat – Erdőtűz kockázat becslése távérzékelési és GIS technikák segítségével északnyugat Algériában. Minden évben több mint 20.000 hektár erdő pusztul el Algériában. A tüzek jelentős személyi-, környezeti-, anyagi- és gazdasági károkat okozhatnak. A geométerek kiegészítő eszközök lehetnek a tűzveszély megelőzésében és kezelésében alkalmazott hagyományos módszerekkel.
Célunk, hogy a Földrajzi Információs Rendszert (GIS) és a távérzékelést használjuk egy Zelamta erdei tűzveszélytérkép kifejlesztésére, amely délkeleti Mascara tartományban található Algériában. Az alkalmazott módszertan egy empirikus modell, amely három paramétert tartalmaz, amelyek szabályozzák a tűz viselkedését: a talaj topo-morfológiáját, a növényvédő anyag éghetőségét és az emberi tevékenységet. A kapott eredmények értékes kartográfiai támogatást jelentenek az erdőtüzek kezelésében és megelőzésében, valamint a döntéshozatalban.
térképezés / tűzkockázati modell / Zelamta erdő / Algéria
1 INTRODUCTION
Forest fires have a strong impact in Mediterranean basin countries where the annual fire- affected area exceeds 700,000 hectares. On average, Mediterranean basin countries experience 60,000 forest fires annually, with some countries experiencing over 20,000 per year within their own borders. Though many forest fires can be attributed to the combination of dry weather conditions and other natural factors such as lightning. Humans remain the principal cause of most forest fires in the Mediterranean basin, be it unintentionally through
* Corresponding author: abdelkader.benguerai@univ-mascara.dz; DZA-29000 MASCARA, B.P 305, Algeria
negligence (cooking fires, campfires, cigarette butts) or intentionally through purposeful acts of arson. Regardless of cause, the forest fires destroyed annually up to 700,000 hectares of forests in Mediterranean countries (C.R.S.T.R.A 2009).
According to the Algerian Directorate General of Forests (DGF), in 2017, forest fires burnt 13,414 hectares, of which 37.24% are forests; 31.41%, are matorral shrub land; and 31.35% are brushwood. Between June 1 and October 5, 2017, 2803 fires were registered. This highlights the importance of forest fire mapping, which contributes to the development and updating of risk prevention plans and is also an essential link for post-crisis management. On the other hand, forest fire mapping allows for the spatial location of the disaster area. Forest fire mapping also facilitates the analysis of the various factors involved in the fire process, and contributing to understanding of the fire behaviour. Whatever means against forest fires are employed, there is no doubt that the damage these fires cause is usually quite significant by the time the fire is declared. This is why prevention remains the only effective way to fight this phenomenon. The variety of factors that control the risk of forest fires means that prevention by traditional means is still insufficient. This is concretized through interactive cartography and with modern and rapid means such as GIS and Remote Sensing.
The objective of this study is to evaluate the susceptibility of the areas exposed to fire risk through a model that spatially integrates multi-source data. Spatial variability mapping of the main factors in forest fire risk allows for a characterization based on a thematic analysis through the modelling of the physical and human parameters.
Forests fires are common in Algeria. During period spanning 50 years, from 1962 to 2012, an average of 1,415 fires were reported per year. These fires burned about 30,000 hectares annually (DGF 2012), leading to a total loss of around 1,693,443 hectares.
This figure might not seem significant at first, but it is quite alarming when it is compared to the total forest area of Algeria, which is only four million hectares (Berrichi et al. 2013). The forest area destroyed annually by past fires is 35,000 ha (1961 to 2001). Financial losses related to the sole commercial value of wood (and cork), control operations, and vegetation restoration are estimated at 26–31 million dollars a year (DGF 2007).
2 MATERIALS AND METHODS
2.1 Location of study area
The study area is located in northwest Algeria, forty kilometres southeast of Mascara town (Figure 1); the state forest is about 2 km from the town of Zelamta. The exact coordinates of the study area are 0.532° east longitude and 35.278° north latitude.
The study area is in the plateau of Tagremaret on the northern slope of the Saida (province) mountains and extends over an area of 8,719 ha (Table 1).The dominant species here is Tetraclinis articulata, which dominates by more than an 8/10 ratio. In the 1960s, the good quality trees grown here provided up to 3,000 tons of firewood through receptacle operations. The soil is a browned rendzine type with a calcareous crust and a sandy silt texture. The study area is in a forestry formation belonging to the Barbary red cedar matorrals; its average floristic composition is as follows:
• Holm oak (Quercus rotundifolia Lam.) with a recovery rate of 30%
• Barbary thuja (Tetraclinis articulata (Vahl) Mast.) with a recovery rate of 25%
• Narrow-leaved mock privet (Phillyrea angustifolia L.) with a recovery rate of 15%
• Mastic pistachio (Pistacia lentiscus L.) with a recovery rate of 10%
The area exudes typical Mediterranean climatic factors; it is semi-arid with an average annual rainfall of 350 mm and a dry period spanning six months from May to October.
Figure 1. Localization of the study area
2.2 Land use in the study area
The land use/cover in the study area contains agriculture, forest, rangeland, and urban agglomerations (Table 1). The land use emphasizes the impact of highly flammable litter, which is the origin of many fires. When fire begins in the litter, it is often difficult to detect.
Fire consumes the litter slowly before spreading to the herbaceous layer, which is of greater flammability. Wind can also spread fire over large areas, thereby increasing the overall fire risk.
Table 1. Land cover/land use areas in hectares
Land cover Area (ha) Percent
Agriculture 9930.07 41.49
Rangeland 5210.88 21.77
Agglomeration 71.45 0.30
Matorrals 5578 23.31
Forest 3141 13.13
Figure 2. Occupation and land use mapping of the study area
The forest stand characteristics such as structure, existence of vertical or horizontal discontinuities, vegetation cover density, and species composition may have an effect on a forest stand’s sensitivity to fire. The intensity, frequency, and size of forest fires are related to the physical (climatic factors) and vegetal environment. The creation and spread of fires are dependent on the combination of different natural conditions and human activity (Zaoui 2013).
The material used in the present work is composed of MapInfo 7.0 and ENVI 4.3 software, vector and Raster-based ASTER (Advanced Space-borne Thermal Emission)- GDEM (Global Digital Elevation Model); the data are posted on a 1 arc-second (approximately 30–m at the equator) grid and referenced to the 1984 World Geodetic System (WGS84)/ 1996 Earth Gravitational Model (EGM96). This paper analyses also the utility of the vegetation index (NDVI) for mapping the land cover characteristics over the study area.
The set of cards made were imported in "grid" format to be classified according to the codes assigned to each card by the MapInfo Vertical module equipped with a calculator allowing for the application of the model formulas used by crossing the obtained maps.
Forest fire risk assessment has been the subject of several research papers (Dagorne ‒ Castex 1992, Mariel 1995) and several indices of fire risk have been established.
The index that interests us in the present work is designed by (Dagorne et al. 1994) for Mediterranean forests. The choice of this model is justified by the significant combustibility of the vegetation found in the Mediterranean basin and the intersection of this vegetation with the topographical parameters. The possibility of accessing information, which enables it to be evaluated and taken into consideration, was another justification factor.
The index is given by the following formula:
= 5 + 2 + 3 (1)
Where:
RI: Risk index;
CI: Combustibility index;
MI: Topomorphological index;
HI: Land-use index.
Based on the principle of the weighted sum, this index is designed as a model assigning each parameter a weighting coefficient based on its influence on fire spread. Risk indices are calculated by mathematical models that set, as input data, the parameters influencing fires and different weights (Siachalou et al. 2009).
The parameters selected in this study were the moisture of the vegetation type, the slope, the aspect of the anaglyph, and the distance from roads and settlements
(Chuvieco ‒ Congalton 1989, Jaiswal et al. 2002, Erten et al. 2002).
2.3 The Combustibility Index (CI)
The combustibility index CI was calculated from the formula developed by (Alexandrian 1982). It is expressed in the following form:
= 39 + 0.23 ( 1 + 2 − 7.18) (2)
BV represents the bio-volume of the plant formation obtained by adding the percentages of recovery of each biological strata; E1 and E2 are the caloric intensity scores (between 1 and 9) of the both dominant high (E1) and low (E2) ligneous plant species. The bio-volume intervenes differently according to the value of the sum (E1 + E2). If this sum is less than 7.18 (low fuel or low calorific species per unit of low bio-volume), the index remains below 40 (Missoumi et al. 2002). If this is not the case, it will be all the higher as bio-volume is
important (Cemagref 1989). In order to have a flammability rating for each plant species, two elements are needed: the average time of ignition and the frequency of ignition; the notes of calorie intensity of the main dominant species of Mediterranean vegetation established by Cemagref from which (E1 and E2) were extracted with the exception of (Tetraclinis articulata), which has been likened to the (Juniperus oxycedrus), the closest species.
(E1 = 5 for Quercus rotundifolia, E2 = 7 for Tetraclinis articulata, E2 = 5 for Phillyrea angustifolia and E2 = 4 for Pistacia lentiscus) of the Zelamta State Forest.
2.4 The Topomorphology Index (MI)
Three morphological parameters are involved in the topomorphological model: elevation, slope, and aspect data. These were extracted from SRTM DEM, which were determined by remote sensing satellites such as Shuttle Radar Topography Mission with Digital Elevation Models. At the end of the 2014 year, the United States government released the public availability of enhanced global SRTM topographic data will greatly benefit international. This 1-arc second global digital elevation model has a spatial resolution of about 30 meters. It covers most of the world with an absolute vertical height accuracy of less than 16 m.
The combined effect of these three parameters is expressed by the following equation:
= 3 + ( ) (3) Where:
p is the slope (coded between 1 and 4) (Table 3);
m: represents the morphology of the area (coded 1 to 4) (Table 5) and e: exposure (coded 0 to 3) (Table 4).
The results of combining and weighting of various topomorphological parameters are listed in Table 6.
2.4.1 Slope (p)
Slope is a parameter that influences the fire spread rate (Weise et al. 1997). Fire moves more quickly up aslope and less quickly down a slope (Kushla et al. 1997). Also, the fire spread rate may rise on steeper slopes due to flames being angled closer to the ground surface, and the process of heat convection can be enhanced by wind effects due to fire behaviour (Whelan 1995, Neary et al. 1999, Adab et al. 2012).
2.4.2 Morphological topography index (m)
Topography plays an important and leading role in the behaviour of forest fires by influencing the morphology and speed of fire spread. In general, topographic influences vary depending on slope inclination, exposure, and elevation of the soil. Unlike atmospheric agents, topography is a constant factor from which it is possible to determine and especially predict the influence of fire spread.
2.4.3 Aspect (e)
Aspect is correlated with the amount of solar energy and the surrounding area receives the radiations. Vegetation is typically drier and less dense on south-facing slopes than on north- facing ones (Anderson 1982, Prasad et al. 2008). Drier fuels are more exposed to ignition risk.
In addition, easterly aspects get more ultraviolet and direct sunlight earlier in the day than westerly aspects do. Consequently, easterly aspects become drier faster (Anderson 1982, Prasad et al. 2008). In this study, elevation, slope, and aspect elements were obtained from ASTER-GDEM data, which were determined by remote sensing.
2.5 Distance from road and settlement networks
Anthropogenic factors are important variables that influence fire occurrences, as represented by some elements such as proximity to roads and settlements. It is recognized that human activities are a basic factor affecting fire occurrences (Adab et al. 2012). The more intense the human activities, the more fire risk increases. Distance to roads and road density are potentially important parameters because roads allow people to go into the forested and grassland areas and cause ignitions (Adab et al. 2012). Also, forested and grassland areas near settlements are more prone to fire ignition because accidental fires can be caused by residents inside the forest (Jaiswal et al. 2005).
3 RESULTS AND DISCUSSION
3.1 Map of the combustibility index (CI)
The combustibility index (CI) map was extracted from the vegetation map, the NDVI map, and the combustibility of each species. Vegetation density, or relative biomass, is considered a significant factor in the spread of forest fires.
On the other hand, calculating the Normalized Difference Vegetation Index (NDVI) determines that it was similar to that established by Cemagref (1989) with the exception of the Barbary thuja (Tetraclinis articulata), which has been assimilated into the Juniperus oxycedrus, which is the closest species (Missoumi et al. 2002).
The combustibility index values are coded in four classes reflecting, as best as possible, the fuel distribution in the Zelamta massif in relation to the combustibility of each species.
The results of this treatment are illustrated by the combustibility index map (Figure 3) and summarized in Table 2.
Figure 3. Map of combustibility index of Zelamta forest
Table 2. Combustibility classes of the study area (CI)
Combustibility classes Risk zones Note Area ha %
CI< 40 No combustibility 1 77.8 0.33
40 ≤ CI< 50 Moderate combustibility 2 13060 54.57
50 ≤ CI< 60 High combustibility 3 10040 41.95
60 ≤ CI Extreme combustibility 4 753.6 3.15
Vegetation is characterized by its combustibility, which represents its ability to spread fire by burning. It therefore reflects its way of burning, releasing more or less significant amounts of heat. Combustibility depends on the structure and dominant species of the forest.
It is correlated with the amount of fuel biomass associated with the fuel structure and its composition. More than 41% of the study area present a high combustibility index and only 3.15% has a very high combustibility index (Table 2, Figure 3), while the high and very high combustibility index are concentrated in the forest. This can be explained by the dominance of thermophilic species such as Pistacia lentiscus, thermophilous conifers such as Tetratclinis articulata, and sclerophyllous species such as Quercus rotundifolia. These species are very susceptible to fire and can increase the spread risk.
3.2 Topomorphology index (MI) 3.2.1 Slope map
Slope modifies the relative flame inclination with respect to the ground during an upward propagation and the efficiency of heat transfers by radiation and convection; ascending fires burn more quickly on steep slopes.
On the other hand, a descending foresees its speed considerably slowed down. Four slope classes were selected based on their incidence, frequency of occurrence, and spatial distribution (Figure 4, Table 3).
Figure 4. Slope map of the study area
Table 3. Grading of slope
Grade Slope Classes Area
Slope
ha %
1 P ≤ 15% 17139.13 71.62 Low slope with no impact on the spread 2 15 < P ≤ 30% 5393 22.54 Moderate slope causing a moderate
acceleration of the fire front
3 30 < P ≤ 60% 1378 5.76 High slope, significant acceleration of the fire front
4 P > 60% 21.27 0.09 Slope with very high risk of turbulence, jumping fire, conflagration
The slope map shows a strong to very steep slope within the forest, whereas the low to very low slope class is found in crops and rangelands.
3.2.2 Aspect map
The aspect reflects slope situation with respect to prevailing winds and sunshine. Indeed, it also plays an indirect role on fire progression. On slopes exposed to winds, spread differs from those in downwind exposures. In general, the southern and eastern slopes have the most favourable conditions for fire (Table 4).
Table 4. Exposure Classes
Orientation Code Area
ha %
North 0 5245 21.91
West 1 4933.4 20.62
South 2 6475 27.06
East 3 7278 30.41
Four main classes of aspect were selected, with each exhibition corresponding to a quarter of 45° centred on the average value of this exhibition. These classes are determined with respect to the four cardinal points with values expressed in degrees with the north as their origin (Table 4).
Figure 5. Aspect map of the study area
The aspect map shows only 30.41% of areas with easterly exposures and 27.06% with southerly exposures, but the adverse exposures are in the east. Sunshine and prevailing winds (west and north) account for less than 43% of the total area study.
3.2.3 Topomorphological map (m)
The position in the slope or the topomorphology “m” weights the intensity of the fire according to the position on the relief. The topomorphology was selected according to the classes of slopes derived from the Digital Elevation Model (DEM).
Table 5. Classes of the topomorphology "m"
More than 92% of the studied area comprises mountains and high foothills, while less than 8% are constituted by plains and foothills.
Figure 6. Topomorphological map of the study area
Topographic variables that affect fire behaviour include elevation and aspect, which affect moisture gradients, and topographic features like narrow valleys or steep slopes, which influence fire spread. Topography also affects vegetation distribution and productivity because it impacts energy and water balances and, therefore, precipitation, runoff, temperature, wind, and solar radiation (Alexandre et al. 2015). The forest is crossed by a continuous chain of mountains, which favours the spread of fires and hinders human intervention.
Morphology classes Grade Morphology of study area Area
ha %
P ≤ 3% 1 Plain (No fire jumps) 1732.25 7.24
3 < P ≤ 12.5% 2 Lower piedmont (Less fire jumps) 13752 57.46 12.5 < P ≤ 25% 3 High Piedmont (more fire jump) 6076.5 25.39 P > 25% 4 Steep (Jumps fire accentuated) 2370.65 9.91
3.2.4 Map of the Topomorphological Index (MI)
The topomorphological index is obtained from the superposition of the slope map, the exposure map, and the topomorphology. All of these are integrated with the formula (3) of the topomorphological index in the GIS. The results obtained correspond to the four topomorphological classes, which are summarized in Table 6 according to their importance.
Table 6. Classes of the topomorphological index
MI Code Signification Area
ha %
MI < 9 1 Unfavourable 18116 75.70
9 < MI < 14 2 Moderately favourable 3283 13.72
14 < MI < 19 3 Favourable 2249.15 9.40
MI > 19 4 Very favourable 283.25 1.18
75.70% of the study area is unfavourable to fire intensification and is far from the forest.
The moderately favourable conditions for fire risk amount to 13.72%. On the other hand areas, constituted by forest formations, with high (9.40%) and very high values (1.18%) of MI (Table 6, Figure 7) are very susceptible to fires.
Figure 7. Map of the Topomorphological Index
3.3 Human Occupation Index (HI)
The HI is compiled according to the formula adopted in the two indices, neighbourhoods, and human occupations. It is assimilated by buffer surfaces of 100 m, and by other roads and roadways according to the degree of traffic, and around homes located within or on the edge of the forest. The human occupation index reflects small areas where the risk of forest fires begins; this situation is due to the low human densities and the low density of the road network implanted in the forest.
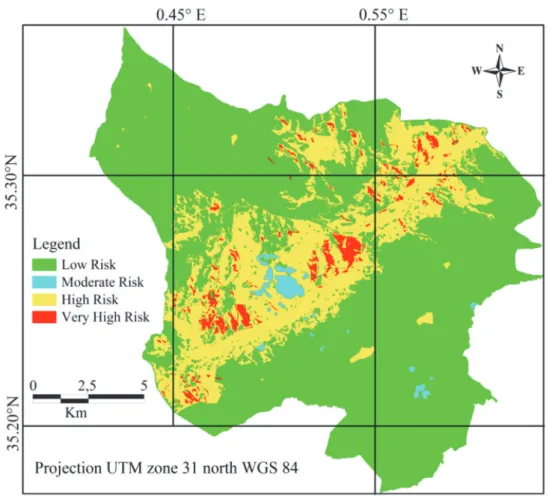
3.4 Fire Risk Index Map (RI)
The calculation of the fire risk index is the result applying the formula (1) cited above to the intersection between layers of the combustibility index, the layer of the topomorphological index, and the index of human activity:
Table 7. Classes of the Fire Risk Index (RI)
Fire risk classes Signification Area (ha) Percent of area study
RI < 6 Low Risk 16718 69.86
6 < RI < 9 Moderate Risk 251.4 1.05
9 < RI < 12 High Risk 6391 26.71
RI > 12 Very High Risk 571 2.39
The forest cover spans 8,719 hectares (36.44%) of the study area (Table 1); the high and very high risk represents successively 26.71% and 2.39%, which generally characterizes the forest (Table 7, Figure 8).This is explained by the topomorphological conditions unfavourable to fire outbreaks (steep slopes, exposure to the south and east).In addition, the forest is dominated by a high combustibility index, which maximizes the risk of fires. This requires silvicultural work and the creation of an opening to pastures according to periods by respecting the standards of the pastoral charge per livestock unit.
This conclusion is confirmed by exploiting the statistical data of fires from 1985 to 2006;
we recorded a total burned area of 779,872 ha from 32,354 fires. The average area per household is 24.10 ha (Arafa 2008).
Figure 8. Map of the Fire Risk Index
3.5 Validation of forest fire risk model
Results validation was performed through field trips, Fire Service documents, and interviews with the forest conservation managers. In this context, it should be noted that no information card for past fires was available.
The main fires to which our study area has been submitted are presented in a form. These sheets provide information on the characteristics that make it possible to understand the natural conditions of combustion and fire propagation. They also provide information regarding damage, intensity, and fire surface.
4 CONCLUSION
Forest fires have been serious menace in Northern Algeria. During the period from 1985 to 2010, 42,555 fires affecting a forest area of 910,640 hectares were reported. The fires are concentrated mostly in August (Meddour et al. 2013). The results obtained in the present research are based on modelling using Geographic Information Systems in fire risk mapping, which is increasingly used for the study of natural and socio-economic phenomena. This tool is essential and complementary to decision making and is operational in fire risk management.
The fire risk map made as part of this study can help forest managers and forest agencies easily locate high risk fire zones and can also help these authorities take preventive policies to limit the loss of human life, natural resources, and property. Forest fire risk prevention policies should be oriented toward land use planning and urban planning from a sustainable development perspective.
REFERENCES
ADAB, H. − KANNIAH, K. D. − SOLAIMANI, K. (2012): Modelling forest fire risk in the Northeast of Iran using remote sensing and GIS techniques. Springer Science+Business Media. Nat Hasards 65: 1723‒1743. https://doi.org/10.1007/s11069-012-0450-8
ALEXANDRIAN, D. (1982) : Estimation de l’inflammabilité et de la combustibilité de la végétation.
[Estimation of flammability and combustibility vegetation.] Newsletter of Cemagref n 228.
(in French)
ALEXANDRE, P.M.− STEWART, S.I.− MOCKRIN, M.H.−KEULER, N.S. SYPHARD, A. D. −BAR- MASSADA, A. − MURRAY, K.C.− RADELOFF, V. C. (2015): The relative impacts of vegetation, topography and spatial arrangement on building loss to wildfires in case studies of california and colorado. springer science, pp 415‒430. https://doi.org/10.1007/s10980-015-0257-6
ANDERSON, H. (1982): Aids to determining fuel models for estimating fire behavior. Usda forest service, mt. baker–snoqualmie national forest, mount lake terrance, WA, USA.
ARAFA, A.M.T.(2008) : Les incendies de forêt en Algérie : Stratégies de prévention et plans de gestion. [Forest fires in Algeria: Prevention strategies and management plans.] Memory of magister in ecology and environment, mentouri university of cosntantine (Algeria), 115 p.
https://bu.umc.edu.dz/theses/biologie/ARF5120.pdf
BERRICHI, M. − BENABDELI, K. − LETREUCH, B.N. − HADDOUCHE, M. (2013): Feux de forêts en Algérie : entre points de vue des écoliers et politique de la prévention. [Forest fires in Algeria:
points of view of school children and political prevention], p. 32. (in French). Mediterránea. serie de estudios biológicos, 24: pp132‒159. https://doi.org/10.14198/MDTRRA2013.24.05
CEMAGREF (1989). Guide technique du forestier méditerranéen français, chapitre IV : protection des forêts contre les incendies. [Technical Guide of the French Mediterranean Forester, Chapter IV:
Protection of forests against fire.] Forestry Technical Division, Aix-en-Provence, France, 61 p.
(in French)
C.R.S.T.R.A (2009): Center of scientific and technical research in arid regions, Algeria. Atelier international de formation sur les risques majeurs et les catastrophes naturelles. Stratégies de prévention et de protection [International training workshop on major hazards and natural disasters. strategy of prevention and protection], 310 p. (in French)
CHUVIECO,E.−CONGALTON,R.G. (1989): Application of remote sensing and geographic information systems to forest fire hazard mapping. Rem. Sens. Environ. 29: 147‒159.
https://doi.org/10.1007/s11069-012-0450-8
DAGORNE,A.−DUCHÉ,Y.−CASTEX,J.M. −OTTAVI,J.Y.−DALLIER,D.−DE COSTER, A. (1994):
Protection des forêts contre les incendies et système d’information géographique: Application à la commune d’Auribeau sur Siagne (Alpes Maritimes). [Forest fire protection and geographic information system: application to the municipality of Auribeau Siagne.]Revue forêt méditerranéenne, XV, 2: 153‒158. (in French)
DAGORNE,A.−CASTEX, J.M. (1992). Gestion des espaces forestiers et sub-forestiers en zones rouges.
L’exemple de Saint-Césaire sur Siagne [Management of forest and sub-forest areas in red zones.
The example of Saint-Césaire on Siagne.] (Alpes Maritimes, France), Finisterra, Vol. 27, (53‒54):
141-166. (in French)
DGF (2007): Directorate General for Forests. Politique forestière nationale et stratégie d’aménagement et de développement durable des ressources forestières et alfatières. [National forest policy and management strategy and sustainable development of forest resources], p. 32. (in French).
ERTEN, E. − KURGUN, V. − MUSAOGLU, N. (2002): Forest fire risk zone mapping from satellite imagery and GIS case study. International J. Appl. Earth Obs. Geoinf., 4: 1‒10.
JAISWAL,R.K. −MUKHERJEE,S.−RAJU, K.D.−SAXENA, R. (2002): Forest fire risk zone mapping from satellite imagery and GIS. J. Appl. Earth Obs. Geoinf. 4 (1): 1‒10.
https://doi.org/10.1016/S0303-2434(02)00006-5
JAISWAL,RK.−KRISHNAMURTHY,J.−MUKHERJEE, S. (2005): Regional study for mapping the natural resources prospect and problem zones using remote sensing and GIS. GeocartoInt 20 (3): 21‒31.
KUSHLA, J.D.−RIPPLE,W.J. (1997): The role of terrain in a fire mosaic of a temperate coniferous forest. For. Ecol. Manag., 95 (2): 97–107. https://doi.org/10.1016/S0378-1127(97)82929-5
MARIELL, A. (1995) : Cartographie du niveau de risque d’incendie : exemple du massif des Maures [Mapping the level of fire risk: example of the Maures massif, Cemagref report.]. (in French) MEDDOUR,O.S.−LOVREGLIO,R.−MEDDOUR,R.−LEONE,V.−DERRIDJ,A. (2013): Fire and people
in three rural communities in kabylia (Algeria). Open J. For., 30‒40, http://doi.org/10.4236/ojf.2013.31006
MISSOUMI, A. −MEDERBAL, K. − BENABDELI, K. (2002) : Apport des Systèmes d’informations géographiques dans la prévention et la lutte contre les incendies de forêts. Exemple de la forêt domaniale de Kounteidat, Algérie. [Contribution of geographic information systems in the prevention and fight against forest fires. example of the kounteidat state forest.] Revue forêt méditerranéenne t. XXIII, 1: 11‒22. (in French)
NEARY,DG−KLOPATEK,C.C−DEBANO,L.F−FFOLLIOTT, P.F. (1999): Fire effects on belowground sustainability: a review and synthesis. For. Ecol. Manag. 122: 51‒71.
https://doi.org/10.1016/S0378-1127(99)00032-8
PRASAD,V.K.−BADARINATH,K.V.S.−EATURU, A. (2008): Biophysical and anthropogenic controls of forest fires in the Deccan plateau. Ind. J. Environ. Manag. 86 (1):1‒13.
SIACHALOU, S.− DOXANI, G. −TSAKIRI-STRATI, M.(2009): Integrating remote sensing processing and gis to fire risk zone mapping: a case study for the seih-sou forest of Thessalonik. International Cartography Conference (ICC) 2009, Santiago, Chile, 11/2009. RefW-27-18481.
WEISE, D.R. − BIGING, G.S. (1997): A qualitative comparison of fire spread models incorporating wind and slope effects. For. Sci. 43 (2): 170‒180.
WHELAN,R.J. (1995): The ecology of fire. Cambridge University Press, Cambridge
ZAOUI, M. (2013) : Gestion des risques de feu dans la forêt de M’sila Wilaya d’Oran. [Fire risk management in the M’sila forest of Oran city]. Master of science in forestry, ecosystem management and conservation option. Abou-bakrbelkaïd university of Tlemcen, 177 p.
(in French)