Investigation the reason of affected Hybrid Corn in Agricultural Fields by Using Multi-Temporal Sentinel-2
Images in Mezőhegyes, South-Eastern Hungary
Khilola Amankulova1 – Nizom Farmonov2 – András Gudmann3 – Krisztián Bónus4 – László Mucsi5
1 PhD student, Doctoral School of Geosciences, Department of Geoinformatics, Physical and Environmental Geography, University of Szeged, amankulova.khilola@stud.u-szeged.hu
2 PhD student, Doctoral School of Geosciences, Department of Geoinformatics, Physical and Environmental Geography, University of Szeged, farmonov.nizom@stud.u-szeged.hu
3 PhD student, Doctoral School of Geosciences, Department of Geoinformatics, Physical and Environmental Geography, University of Szeged, gudmandras@geo.u-szeged.hu
4 Director of Precision farming and Commidity Plant Division, Nemzeti Ménesbirtok és Tangazdaság Zrt., Mezőhegyes, bonus.krisztian@mezohegyesbirtok.hu
5 Professor (Associate), Department of Geoinformatics, Physical and Environmental Geography, University of Szeged, mucsi@geo.u-szeged.hu
Introduction
Land-use/cover research has attracted a great deal of focus over the last decades, is currently one of the main research areas. However, studying and evaluating the reasonableness of misclassification pixels on classified thematic maps remains scarce. Free optical satellite remotely sensed datasets play a key role to produce high- resolution maps and vegetation monitoring (Dobrinić et al. 2021). Although, it is challenging to create a map with multiple classes which are almost similar spectrally in complex land cover areas.
Currently, a significant number of studies using Sentinel 1 (S-1), and Sentinel 2 (S-2) satellite images in agricultural research are widely used by scientists (Immitzer et al. 2016). Sentinel 2 is a multispectral instrument part of the Copernicus Programme developed by the European Space Agency (ESA) has a high revisit time of 10 days at the equator with one satellite and 5 days with 2 satellites under
Abstract: The main objective of this work was to study the reason for low accuracy and misclassified pixels in hybrid corn crop parcels. In this study, we employed Sentinel-2 (S-2) data and Fraction of Absorbed Photosynthetically Active Radiation (fAPAR) acquired between the beginning of April and September 2020, on Mezőhegyes town in south-eastern Hungary. A different set of spectral indices (SI) and fAPAR were applied as inputs to Random Forest (RF) and Support Vector Machine (SVM) algorithms to generate crop map. The research showed that despite the high overall accuracy (OA) classified map, there are might be an error or low pixel resolution on it which can be the result of the temporal, spatial, temporal characteristics and a condition in crop plants. We have found the cause of misclassification are due to overirrigation and high precipitation rate during the growing stage of hybrid corn. Moreover, almost 99% of affected hybrid corn areas are identified when the multi-temporal spectral bands (SB) and spectral indices (SI), in combination with fAPAR datasets were added.
cloud-free conditions will capture Earth surface changes. Nevertheless, there is a big challenge with the application of optical remotely sensed images is cloudy and rainy weather which might be limiting the acquisition period and can affect image quality as well (Eberhardt et al. 2016). Several studies have indicated that multi-temporal satellite images promote crop type mapping over the various climate and different cropping systems (Gudmann et al. 2020).
Several classification methods have been used to generate crop mapping by the remote sensing community, however, Random Forest (RF) and Support Vector Machine (SVM) are the two most mainly employed machine learning algorithms for mapping purposes (Su – Huang 2009; Ghimire et al. 2012). The main goal of this paper is to investigate classification error and the potential of multi-temporal S-2 (optical), spectral indices (NDVI and MSAVI2) multi-temporal satellite imagery and fAPAR composite derived from Sentinel-2 instrument and their combinations for automatically mapping agricultural areas in Mezőhegyes, Békés county, Hungary.
Materials and Methods Study Area
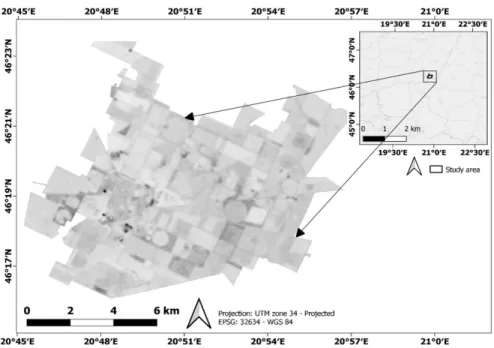
Stud Farm of Mezőhegyes is located in Mezőhegyes town, Békés and Csongrád- Csanád counties, Hungary next to the Romanian border between coordinates of latitude 46° 19' N and longitude 20° 49' E (Figure 1). The total area of town is 155.44 km² and its population is about 4945 people.
Figure 1. Location of the study area and overview of the study area (Sentinel-2 imagery;
band: B2, acquisition date: 28th June 2020)
Its area is characterized by different kinds of chernozem soil. The meadow chernozem and the lowland chernozem with lime content provide an excellent basis for the field growing of plants.
Field Data Collection and Validation data
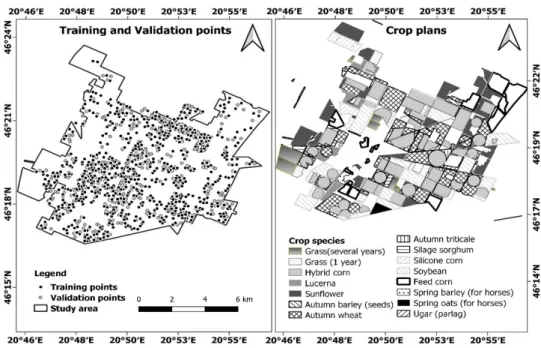
In Stud Farm Mezőhegyes, certain crops are cultivated at the starting of May to early June and harvested in mid-September according to information provided by Mezőhegyes company. Field measurements were performed from 15 to 20 June in 2020 and data was collected with special agronomists in the farmland. Meanwhile, we used the official spatial crop plan map for 2020 which is in digital format (Figure 2). During the field campaign, we identified affected crops like hybrid corn since this crop was considered our main research target.
We found affected hybrid corn when we compared field information, time- series analysis of very high-resolution Google Earth images and RGB False colour composite from Sentinel 2 satellite imagery which was captured in April and June (Figure 3). There was a dry season lack of precipitation during the Spring. Therefore, hybrid corn parcels were irrigated during the dry season. But when summertime came rain was relatively high 190.6 mm from 21 May until 28 June over the agricultural lands according to information by Operational Water Scarcity Assessment and Forecasting System in Hungary (http://aszalymonitoring.vizugy.hu) and Stud Farm Mezőhegyes.
Yearly precipitation is 550–600 mm and more than 30% of yearly precipitation fall during this period. Weather conditions and overirrigation harmed crops. For
Figure 2. Official crop plans and spatial distribution of training and validation points
instance, hybrid corn in major parcels was affected, rare, unhealthy corns and most of them even died because of these problems. Additionally, we selected training points and validation points manually according to a field survey with a combination of Sentinel 2, crop plan map and time-series analysis of geo-referenced Google earth images based on ground truth. Main Land Use/Land Cover classes including hybrid corn, sunflower, autumn wheat, soybean, feed corn (for horses), silicone corn trees, grasslands, barley, lucerne, silage sorghum, build-up areas, water bodies are identified.
Hybrid corn separated two classes including healthy and affected for further classification. Then, feed corn (for horses), silicone corn, grasslands, barley, lucerne, silage sorghum, build-up areas and water reclassified into others classes. These sample data are chosen manually for each land cover class and 70% of them are used for image classification as reference data, and remains are considered (30%) as validation points (Figure 2).
Sentinel-2 Data and Pre-processing
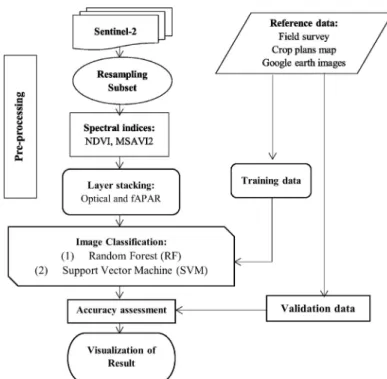
An indication of the overall methodological workflow employed for this research is in the flow chart (Figure 4). In this study, we downloaded and pre- processed six Sentinel 2 images with 13 spectral bands at high spatial resolution (i.e., four bands at 10 m, six bands at 20 m and three bands at 60 m spatial resolution.
under cloud-free tiles from open access hub which is a free and open-source website Figure 3. Affected hybrid corn (a) as a result of the irrigation, acquisition date:
17th April 2020 and (b) Affected hybrid corn after high precipitation, acquisition date: 09th July 2020: Time series analysis of high-resolution Google Earth images.
(c) Affected hybrid corn from Sentinel 2 False-color composite: acquisition date:
28th June 2020
(https://scihub.copernicus.eu). The images were resampled and the subset from different spatial resolutions into 10 m to preserve the pixels’ original values using the nearest neighbour interpolation method (Ettehadi Osgouei et al. 2019) in Sentinel Applications Platform (SNAP) version 8.0.
We extracted two spectral indices from Sentinel 2 images using Sentinel-2 Toolboxes. The Normalized Difference Vegetation Index (NDVI) was developed by Rouse et al., and the optical vegetation index used to quantify vegetation greenness is useful in understanding vegetation density is mostly used in remote sensing society The modified soil-adjusted vegetation index, version two (MSAVI2) minimizes the effect of bare soil when monitored vegetation is at the starting of the crops growing stage and useful estimator of phenology (Borgogno-Mondino et al. 2020). Finally, the fraction of Absorbed Photosynthetically Active Radiation (fAPAR) product with a 10 m spatial resolution, improves monitoring of vegetation productivity generated from Sentinel-2.
Figure 4. An indication of the overall methodological workflow employed for this research
Spectral Indices Formula
Normalized Difference Vegetation Index Modified Soil-Adjusted Vegetation Index, version 2 (MSAVI2)
Table 1. Equation of spectral indices
Classification scheme Dataset integration
We observed the result of spectral bands and indices and fAPAR datasets used on the classification. The optical spectral indices were calculated for each image.
These datasets were used alone or in combination with fAPAR. For example, 13 the spectral bands for S-2 and two spectral indices and fAPAR. Therefore, three datasets sets were utilized in this article, these are as follows below:
1. Spectral indices only (SI-fAPAR);
2. Spectral bands only (SB);
3. Spectral indices only and spectral bands only (SI-fAPAR-SB);
Classification Methods
In this study, the two most popular classification techniques The RF and SVM algorithms which are supervised classification methods were employed to map over agricultural fields during the summer of 2020.
The RF algorithm is an ensemble model which means that it uses the results from many different models to calculate a response (Varga et al. 2021). This method is most commonly used in the remote sensing community because of its high accuracy in its classification (Belgiu – Drăguţ 2016). According to RF classification, the total area of hybrid corn is 2633,28 ha. Almost 10% of the total area is considered as affected hybrid corn which is 225,54 ha. We used The EnMAP-Box is free and open source plug-in for QGIS to visualize and process remote sensing raster data (van der Linden et al. 2015).
The SVM is a machine learning algorithm that produces suitable separating hyperplanes by maximizing the border between land cover classes (Su – Huang 2009). However, in this study, we used radial basis function (RFB) kernels which are most commonly used in recent years (Cortes – Vapnik 1995). We used the same software EnMAP-Box for SVM classification.
Accuracy assessment
After the classification process, it is important to assess the accuracy of land cover classification to identify map errors. An accuracy assessment was done for each classification scheme with the calculation of an error matrix (Congalton – Green 2019). The overall accuracy (OA), producer’s accuracy (PA), user’s accuracy (UA), and Cohen’s kappa coeffcient of agreement (κ) were computed using the confusion matrices.
Results and Analysis SVM and RF Results
Table 2 demonstrated the averaged producer’s accuracy (PA) and user’s accuracy (UA) per class category, kappa and overall accuracy (OA) of SI, SB, and
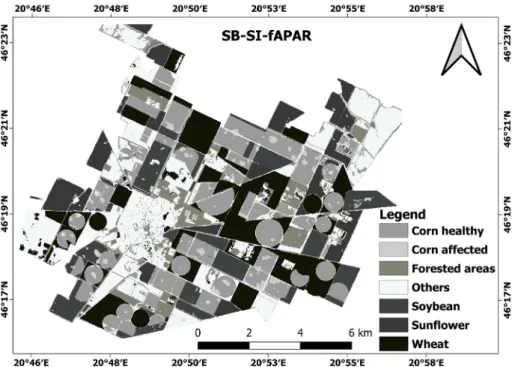
SI-SB-fAPAR which were obtained from both RF and SVM classification. According to the accuracy assessment, OA of the SB and SB-SI-fAPAR datasets values showed the highest accuracy from 97.8% to 98.7% to find affected corns for both RF and SVM classification methods. Furthermore, based on the input image lists, SVM and RF had not the highest differences between SB, SI and SB-SI-fAPAR.
With the RF classification, Integration of SB-SI and fAPAR showed a slight improvement compared with SI-fAPAR feature datasets. Figure 5 demonstrates RF generated classification map by utilizing SB-SI-fAPAR datasets from Sentinel 2 images.
For SVM classification, differences for all classification schemes percentage of overall accuracy were not big. However, a bit of an increase in the ratio of overall accuracy when SB and SB-SI-fAPAR were added to the classification and reported 95.96% and 96.37%. Figure 6 presents SVM generated map by using SB-SI-fAPAR datasets from S-2A (optical) images.
Conclusions
The research evaluated the integration of multi-temporal S-2 images, spectral indices and fAPAR acquired in the maize growing season, which could detect affected corns from healthy corns by employing two robust RF and SVM machine learning algorithms in Mezőhegyes, South-Eastern Hungary. We identified affected hybrid corn which was caused by overwatering in Spring during the dry season and an extremely high precipitation rate in July. This information is crucial and lacks in our study area. Thereby, overall crop yield decreased to 10% as a result of these
RF SVM
SB [%] SI [%] SB-SI- fAPAR
[%] SB [%] SI [%] SB-SI- fAPAR
[%]
PA UA PA UA PA UA PA UA PA UA PA UA
Corn Healthy 97.6 97.6 95.6 97.6 97.6 97.6 97.4 94.9 97.8 94.1 97.6 95.1 Corn Affected 97.8 97.8 97.8 93.28 98.68 96.55 98.24 99.55 96.48 95.63 98.68 99.56 Forested areas 100 100 100 97.06 100 100 98.79 100 100 98.8 98.79 100
Others 94.5 88.79 82.12 88.02 86.59 96.27 83.8 91.46 82.12 83.52 86.59 92.26 Soybean 100 96.88 94.5 92.79 94.5 88.03 94.5 93.64 92.66 92.66 94.5 92.79 Sunflower 97.8 97.27 96.77 84.51 100 96.88 95.16 96.72 85.48 98.15 95.16 96.72 Wheat 87.71 92.9 96.15 96.69 98.35 96.76 98.9 94.74 98.35 97.81 98.35 97.28
OA 96.65 94.28 96.72 95.96 94.14 96.37
Kappa 0.96 0.93 0.96 95.05 0.93 0.96
Table 2. Land cover classes overall accuracy (OA) with producer’s accuracy (PA), user’s accuracy (UA) and kappa obtained using RF and SVM
Figure 6. Classification by SVM, generated using combined Spectral bands, spectral indices and fAPAR
Figure 5. Classification by RF, generated using combined Spectral bands, spectral indices and fAPAR
issues. Our result demonstrated that the highest OA of classification was obtained by RF using SB and SB-SI-fAPAR datasets. This approach achieved OA 97.35%
(kappa 0.93) and 96.72% (kappa 0.93) respectively. However, SB-SI-fAPAR datasets showed a great AO rate for both SVM and RF classification to identify affected crops.
Our research results showed that it is possible to identify affected corns and map crop fields based entirely on free and open-source satellite imagery at relative small agricultural fields since it is time-saving and cost-effective.
Acknowledgement
This research was supported by National Scientific Research Funds (Hungary) in support of the ongoing research, ‘Time series analysis of land cover dynamics using medium - and high-resolution satellite images’ (NKFIH 124648K), at the Department of Geoinformatics, Physical and Environmental Geography), University of Szeged, Szeged, Hungary.
References
Abubakar, G.A. – Wang, K. – Shahtahamssebi, A. – Xue, X. – Belete, M. – Gudo, A.J.A.
– Mohamed Shuka, K.A. – Gan, M. (2020): Mapping Maize Fields by Using Multi- Temporal Sentinel-1A and Sentinel-2A Images in Makarfi, Northern Nigeria, Africa.
Sustainability, 12, 2539.
Belgiu, M. – Drăguţ, L. (2016): Random forest in remote sensing: A review of applications and future directions. ISPRS J. Photogramm. Remote Sens., 114, pp. 24–31.
Borgogno-Mondino, E. – de Palma, L. – Novello, V. (2020): Investigating Sentinel 2 Multispectral Imagery Efficiency in Describing Spectral Response of Vineyards Covered with Plastic Sheets. Agronomy, 10, 1909.
Congalton, R.G. – Green, K. (2019): Assessing the Accuracy of Remotely Sensed Data:
Principles and Practices, Third Edition, 3rd ed. CRC Press.
Cortes, C. – Vapnik, V. (1995): Support-vector networks. Mach. Learn., 20, pp. 273–297.
Dobrinić, D. – Gašparović, M. – Medak, D. (2021): Sentinel-1 and 2 Time-Series for Vegetation Mapping Using Random Forest Classification: A Case Study of Northern Croatia. Remote Sens., 13, 2321.
Eberhardt, I. – Schultz, B. – Rizzi, R. – Sanches, I. – Formaggio, A. – Atzberger, C. – Mello, M. – Immitzer, M. – Trabaquini, K. – Foschiera, W. – José Barreto Luiz, A. (2016): Cloud Cover Assessment for Operational Crop Monitoring Systems in Tropical Areas. Remote Sens., 8, 219.
Ettehadi Osgouei, P. – Kaya, S. – Sertel, E. – Alganci, U. (2019): Separating Built-Up Areas from Bare Land in Mediterranean Cities Using Sentinel-2A Imagery. Remote Sens., 11, 345.
Ghimire, B. – Rogan, J. – Galiano, V.R. – Panday, P. – Neeti, N. (2012): An Evaluation of Bagging, Boosting, and Random Forests for Land-Cover Classification in Cape Cod, Massachusetts, USA. GIScience Remote Sens., 49, pp. 623–643.
Gudmann, A. – Csikós, N. – Szilassi, P. – Mucsi, L. (2020): Improvement in Satellite Image- Based Land Cover Classification with Landscape Metrics. Remote Sens., 12, 3580.
Immitzer, M. – Vuolo, F. – Atzberger, C. (2016): First Experience with Sentinel-2 Data for Crop and Tree Species Classifications in Central Europe. Remote Sens., 8, 166.
Su, L. – Huang, Y. (2009) Support Vector Machine (SVM) Classification: Comparison of Linkage Techniques Using a Clustering-Based Method for Training Data Selection.
GIScience Remote Sens., 46, pp. 411–423.
van der Linden, S. – Rabe, A. – Held, M. – Jakimow, B. – Leitão, P. – Okujeni, A. – Schwieder, M. – Suess, S. – Hostert, P. (2015): The EnMAP-Box—A Toolbox and Application Programming Interface for EnMAP Data Processing. Remote Sens., 7, pp.
11249–11266.
Varga, O.G. – Kovács, Z. – Bekő, L. – Burai, P. – Csatáriné Szabó, Z. – Holb, I. – Ninsawat, S. – Szabó, S. (2021): Validation of Visually Interpreted Corine Land Cover Classes with Spectral Values of Satellite Images and Machine Learning. Remote Sens., 13, 857.