agronomy
Article
Soil Nutrient Dynamics and Nitrogen Fixation Rate Changes over Plant Growth in Temperate Soil
Ágota Horel , Györgyi Gelybó* , Imre Potyó, Klára Pokovai and Zsófia Bakacsi
Institute of Soil Sciences and Agricultural Chemistry, Centre for Agricultural Research, Hungarian Academy of Sciences, Herman O. St. 15, 1022 Budapest, Hungary; horel.agota@agrar.mta.hu (Á.H.);
potyo.imre@agrar.mta.hu (I.P.); pokovai.klara@agrar.mta.hu (K.P.); bakacsi.zsofia@agrar.mta.hu (Z.B.)
* Correspondence: gelybo.gyorgyi@agrar.mta.hu; Tel.: +36-1-212-2265
Received: 1 March 2019; Accepted: 3 April 2019; Published: 6 April 2019
Abstract:Research on the use of soil enhancer materials such as biochar from soil chemical perspective still provide differing results; therefore, investigations focusing on soil-biochar-plant interactions are still necessary to constrain our understanding of complex biochar effects. The present study investigated the changes in biological nitrogen fixation rates (BNF) and overall nutrient dynamics (NO3−, NH4+, total N, K2O, and P2O5) during the growth ofCapsicum annuum (pepper) in pot experiments amended with biochar made of paper fiber sludge and grain husk. Four treatments were studied with 0, 0.5%, 2.5%, and 5.0% (by weight) added biochar (BC) amount to temperate silt loam soil. Peppers were planted at 2–4 leave stages and grown for the duration of 12.5 weeks. Our results showed that total nitrogen had relatively small changes in all treatments over time compared to the dynamic changes observed in the case of inorganic nutrients. NO3−-N and NH4+-N abundances presented a continuous decrease during the course of the study after an initial increase. The pepper plant facilitated the BNF rates to triple in the control soils, while plants were in the growing phase (weeks 1–6), which further increased an additional 61% by harvesting (week 12). A high amount of biochar addition suppressed potential BNF rates of the investigated soil, indicating its potentially negative effects on soil indigenous microbial communities if added in excess. We also found a plateau in plant biomass production that after reaching an optimal (2.5%) biochar amendment in the soils, and excess biochar addition did not result in significant changes in the soils’ pH to achieve better nutrient (potassium, nitrogen, phosphorous) use or crop growth.
Keywords:biochar; biological nitrogen fixation; plant growth; silt loam; pepper
1. Introduction
Soil enhancer materials (e.g., fertilizer addition to nutrient deficient soils) have been a long used practice to help plant development and growth. The use of other types of soil enhancers, such as biochar in current agricultural management, is gaining popularity, especially in geographical areas where biochar addition to degraded soils can improve soil characteristics and consequently result in higher crop or fruit yields [1,2]. While adding fertilizer to cultivated soils is a long-used general process in agriculture, the added inorganic nutrients become part of the nitrogen cycle, thus modifying its natural intensity [3]. The microbial communities, however, have different responses to the fertilizer and biochar presence in soil [4–6], and less is known about the effects of biochar on nitrogen cycle components.
Charcoal and biochar amendments to soils can cause varying ranges of chemical, hydrological [7,8], and soil microbial responses [9–11]. In other words, changes in soil chemical and physical properties subsequently influence its biological functioning, also affecting nitrifying communities [12,13].
Many studies on biochar addition to soils also investigated its influence on nutrient losses through soil columns [14,15], as nitrogen and/or phosphorus can sorb onto biochar, and, consequently, biochar
Agronomy2019,9, 179; doi:10.3390/agronomy9040179 www.mdpi.com/journal/agronomy
Agronomy2019,9, 179 2 of 14
has the ability to retain N fertilizers and release them via the cation exchange process [16]. However, the biochar ability of sorption can diminish over time [17]. Moreover, the different biochar manufacturing processes and soil types used in experiments had different effects on the rate of nutrient mobility [18].
Nitrogen fixing bacteria can convert nitrogen gas to ammonia using nitrogenase enzymes [19].
Biological N2fixation (BNF) is a very vital nitrogen cycling step, as N2fixing bacteria can fix as much as 90×1012 g nitrogen per year from the atmosphere in agricultural lands, making it available to plants [20]. The approach of studies on the influence of biochar addition to agricultural soils and its effects on BNF rates differ in literature. While many research focus on symbiotic BNF response to biochar added soils due to its more pronounced N2fixing potentials compared to non-symbiotic bacterial effect [5,21], the free living N2fixing bacterial responses to the addition of soil enhancer materials are less investigated [22,23].
The effects of these soil enhancer materials on soil physical, chemical, and biological parameters under diverse environmental conditions need to be further investigated and studied to minimize any unforeseen negative effect to occur, as well as to determine economically the best application rate of the enhancer that a specific soil should receive. Therefore, the aims of the present study were to investigate (i) response of plant growth to biochar addition; temporal changes in (ii) soil nitrogen, phosphorous, and potassium amounts; and (iii) potential nitrogen fixation changes at different plant growing and maturing stages as influenced by nutrient enriched, commercially available grain husk and paper sludge-based biochar addition at differing concentrations.
2. Materials and Methods
2.1. Soil Collection and Site Characterization
Soil samples were collected from a silt loam (Luvisol, WRB) [24] and freshly tilled arable soil at an area of long-term (>10 years) agricultural use (46.92936◦N, 17.67033◦E, 225.86 m a. s. l., temperate climate zone). The samples were collected from the upper 28 cm soil layer on 5 June 2016, and they were mixed thoroughly to obtain a homogenized soil sample with uniform properties, prior to using in the experiment.
Pepper plants (Capsicum annuum) were grown from seeds (sowed late February) and planted into pots (sized as follows: 14 cm height and 18 cm in diameter, 2 kg dry soil per pot) after reaching the two to four leaf stage to minimize plant growth differences prior to receiving the different treatments. The experimental setup allowed plants to grow under quasi-natural conditions, as pots were placed outside to receive natural radiation temperature and moisture effects. Rain-fed pots were irrigated occasionally as necessary in the lack of natural precipitation to avoid severe drought stress on plants [25]. Plant growth stages were determined based on weekly observations of number of plant leaves, flowers, and fruits in different development stages for each plant. Plant-based biomass measurements were also conducted at the different plant phenological growth stages, i.e., at W3, W6, W10, and W12. Biomass was measured separately for leaves and stems, which were oven dried at 40 ◦C for 48 h or until the weights became steady. Measurements correspond to total mass per plant.
Fertilizer (N:P:K of 20:20:20 in a concentration equal to 400 mg kg−1soil, manufacturer Elixir Zorka, Serbia) was added to the soil in W3 (30 June 2016; prior to the regular weekly soil analysis) of the experiment to eliminate nutrient deficiencies and also to better investigate temporal changes in nutrient usage over time for the different treatments. The rate of nitrogen added was based on information found in literature [26,27].
2.2. Biochar Making Process
For the experiment, we bought commercially available biochar, which has a European Biochar Certificate (EBC), indicating similar physical and chemical characteristics for different batches;
although biochar from a single batch was used in the present study. According to the manufacturer (SonnenErde GmbH, Austria), the biochar was made from paper fiber sludge and grain husks from
Agronomy2019,9, 179 3 of 14
spelt (wheat; 1:1 w/w) using Pyreg-reactor technology at 600 ◦C using slow pyrolysis technique with a residence time of 20 min [28]. The chemical properties of the biochar used in the study were the following: pH = 10.3±0.0, total organic carbon (TOC) = 47.3%, total N = 1.0±0.1%, and NH+4-N = 1.9±0.1 mg kg−1.
2.3. Experimental Setup
A soil type of silt loam was used in the experiment. Four treatments were established including one control (0%) and three biochar amended treatments receiving 0.5%, 2.5%, and 5.0% biochar (by weight; further referred to as C, BC0.5, BC2.5, and BC5.0, respectively). Control treatments received no biochar addition, only plants. Treatments were prepared in 7 replicates each with two plants per pot (with a total of 14 replicates per treatment) at the beginning of the experiment. The total duration of the experiment was 86 days. Selected pots were disassembled during week 3 (W3), 6 (W6), 10 (W10), and 12 (W12) to study the temporal evolution of soil chemical characteristics, with special interest to soil nutrients (total N, NO3−, NH4+, K2O, P2O5) and changes in potential BNF rates. The selection of the pots was based on plant development to represent the average plant development in the population.
Inorganic nutrients were determined using standard wet chemical techniques. Week 0 (W0) data represents all four treatments starting parameters prior to biochar additions.
2.4. Physical and Chemical Characteristics of the Soil
Basic soil physical characteristics were determined prior to the experiment [6,25]. Soil volumetric water contents (SWC) were measured by oven drying soil samples (24 h; 105◦C) of a known volume (10 cm3). Grain size distribution was determined using the sieve-pipette method—Hungarian patent number MSZ-08-0205-78. Soil TOC contents were measured using the Tyurin method [29], and the total nitrogen was determined using the modified Kjeldahl method (ISO 11261:1995). Concentrations are reported as mg kg−1dry weight soil.
2.5. Potential N2Fixing Bacterial Activities and GC-FID Measurements
Potential nitrogen (N2) fixation was measured as ethylene (C2H4) production from acetylene (C2H2) reduction [6,30]. From the homogenized soil, 10 g dry weight soil was added to triplicate 25 mL serum vials. Afterward, we amended the vials with 4 mL of glucose solution (50 g L−1) dissolved in DI water. Serum vials then were capped and placed in an incubator for 24 h at 25◦C to increase the number of heterotroph nitrogen fixing bacteria in the soil. All samples received 10%v/vof C2H2, which was added to the headspace, and were then incubated for an additional one hour. Along with the treatment samples, we prepared additional control samples without the addition of C2H2. Samples without C2H2were used to develop a baseline for natural ethylene production in the investigated soil samples, and we deducted this amount from our measured concentrations. After the 1 h incubation, samples were measured for ethylene production. Production of C2H4from the reduction of C2H2
(ARA) as a substrate analog of N2was measured using a FISONS 8000 gas chromatograph with flame ionization detection (GC-FID). Production rates of C2H4were also converted to potential N2fixation rates using a C2H2–N2reduction ratio of 3:1 [31,32]. All rates and fluxes pertaining to nitrogen species are expressed on a nitrogen atom basis.
The GC-FID oven temperature was held constant at 80◦C, while the detector temperature was held at 100◦C during measurements. The carrier gas was nitrogen with a constant flow of 30 mL min−1(170 kPa). The GC column Porapak N (80−100 mesh) was 2–3 m in length with a 2.1 mm internal diameter and a 3.2 mm outer diameter. Samples (125µL) were manually injected into the GC-FID. The make-up gas was hydrogen (50 kPa) and synthetic air (100 kPa). Ethylene standards (10 mg kg−1) were used to quantify measurements and to qualify instrument reliability after being in use for a longer period.
Agronomy2019,9, 179 4 of 14
2.6. Statistical Analyses
A single factor ANOVA (analysis of variance) application was used to analyze the data using the software package R (Version 2.15.2). Tukey’s HSD (honestly significant difference) test was used to further analyze significant interactions within groups. Statistical significance of the data sets was determined atp< 0.05 andp< 0.01. Error is reported as standard deviation.
3. Results
3.1. Physical and Chemical Characteristics of the Soil and Biochar Used
The soil consisted mainly of silt (56.0%), with 23.9% of sand and 20.2% of clay. The soil had 26.5%
(±3.7) volumetric water content at the time of sample collection and prior to the experimental setup.
The site of the soil collection has a long term agricultural use as a vineyard, which was abolished and tilled in 2016. Soil CaCO3content at the beginning of the experiment was 10.4±0.3% and stayed similar throughout the study.
The addition of biochar was supposed to and did change certain physical and chemical characteristics of the soil. Initial soil pH at W0 (prior to experiment setup) was 7.97±0.04. With the addition of highly alkaline biochar, overall soil pH increases were expected. However, some minor decreases in soil pH were observed during the first three weeks of the study (e.g., 1.2% and 2.8% for the control and BC0.5, respectively) as indicated by the first measurement at W3 in all treatments. At later weeks, slow and significant increases were noted for control and BC2.5 treatments (p< 0.016; Figure1), indicating the influences of changing environmental conditions, such as rainwater or irrigation, and evapotranspiration conditions, rather than biochar additions itself.
Agronomy 2019, 8, x FOR PEER REVIEW 4 of 14
2.6. Statistical Analyses
A single factor ANOVA (analysis of variance) application was used to analyze the data using the software package R (Version 2.15.2). Tukey’s HSD (honestly significant difference) test was used to further analyze significant interactions within groups. Statistical significance of the data sets was determined at p < 0.05 and p < 0.01. Error is reported as standard deviation.
3. Results
3.1. Physical and Chemical Characteristics of the Soil and Biochar Used
The soil consisted mainly of silt (56.0%), with 23.9% of sand and 20.2% of clay. The soil had 26.5%
(±3.7) volumetric water content at the time of sample collection and prior to the experimental setup.
The site of the soil collection has a long term agricultural use as a vineyard, which was abolished and tilled in 2016. Soil CaCO3 content at the beginning of the experiment was 10.4 ± 0.3% and stayed similar throughout the study.
The addition of biochar was supposed to and did change certain physical and chemical characteristics of the soil. Initial soil pH at W0 (prior to experiment setup) was 7.97 ± 0.04. With the addition of highly alkaline biochar, overall soil pH increases were expected. However, some minor decreases in soil pH were observed during the first three weeks of the study (e.g., 1.2% and 2.8% for the control and BC0.5, respectively) as indicated by the first measurement at W3 in all treatments. At later weeks, slow and significant increases were noted for control and BC2.5 treatments (p < 0.016;
Figure 1), indicating the influences of changing environmental conditions, such as rainwater or irrigation, and evapotranspiration conditions, rather than biochar additions itself.
Figure 1. Soil pH changes over time during the study. Error bars represent standard deviations (n = 3).
3.2. Plant Growth and Stress Response
The data of the Capsicum annuum plant growth and developments are shown in Figures 2 and 3, based on observations of leaf numbers weekly and measurements biomass at the different growth stages.
Plant leaf numbers showed no significant differences among treatments in any stage of the development. Plant development took place in a similar way in all treatments as indicated by temporal changes in leaf numbers. When comparing leaf number at different growth stages, we found significant increase during W1–W3 (plant development), which continued from W4 to W6 (flowering), reaching its final maximum by the end of W6, when plant maturity stage started and no further significant change was detected (Figure 2). Plant flowering started to develop around W2, when 1–3 flowers per plants were observed. By W3, more than 50% of the plants were flowering with an average of 1.14 to 1.64 flowers per plant (BC0.5 and BC2.5, respectively; data not shown). In the
Figure 1.Soil pH changes over time during the study. Error bars represent standard deviations (n= 3).
3.2. Plant Growth and Stress Response
The data of the Capsicum annuum plant growth and developments are shown in Figures2 and3, based on observations of leaf numbers weekly and measurements biomass at the different growth stages.
Agronomy2019,9, 179 5 of 14
Agronomy 2019, 8, x FOR PEER REVIEW 5 of 14
flowering stage (starting from W3), major differences between treatments were not observed except in W5, where 24.9% (p > 0.05) more flowers were counted in BC5.0 compared to control treatment, indicating primary positive effects of biochar on plant growth. Fruit development phase was reached around W6 of the study, when flower numbers showed no significant differences among treatments (p > 0.05). By W10, all plants were in the full fruit development phase. Even though there were up to 18 flowers per plant during the plants’ growing stage, only 4–5 full fruit developments per plant were observed at the end of the W12 in the present study, which also represents the harvest time.
Figure 2. Overview of plant growth based on average leaf numbers (±SD) over time (n = 8 to 14).
Statistically significant differences (p < 0.05) between growth phases are indicated by different letters;
n.s. means treatments within growth phases are not significant.
Plant biomass varied similarly in all treatments, but some small differences attributed to biochar addition could be detected. Based on temporal changes of stem biomass values, regardless of treatment, all stages were significantly different (p < 0.033) from each other (Figure 3a), indicating a continuous plant development. The apparent decrease in stem biomass by W12 can be an artifact due to the difference in sample number, as, at the end of the experiment, all remaining plants were analyzed instead of using the usual sample size (8 vs 2 plants per treatment, respectively). Looking at plant parts separately as stem and leaf, we can conclude that the growths of leaves and, consequently their biomass values, showed similar tendencies to that of stems (Figure 3), although both leaf biomass and leaf numbers reached their maxima earlier (W6), the compared stems in all treatments and remained approximately constant afterwards. Maximal stem biomass occurred in W10 in all treatments, when BC2.5 presented the highest stem biomass among treatments; however, the difference among treatments was not statistically significant (Figure 3b). Plant leaf mass showed significant differences from the other growth stages’ values only at W3 (p < 0.001; Figure 3b) in the early stage of plant development, i.e., at W6 BC0.5, while at W10 measurements BC2.5 treatments produced the highest leaf and stem dry weight mass per plant (Figure 3).
Figure 2. Overview of plant growth based on average leaf numbers (±SD) over time (n= 8 to 14).
Statistically significant differences (p< 0.05) between growth phases are indicated by different letters;
n.s. means treatments within growth phases are not significant.
Agronomy 2019, 8, x FOR PEER REVIEW 5 of 14
flowering stage (starting from W3), major differences between treatments were not observed except in W5, where 24.9% (p > 0.05) more flowers were counted in BC5.0 compared to control treatment, indicating primary positive effects of biochar on plant growth. Fruit development phase was reached around W6 of the study, when flower numbers showed no significant differences among treatments (p > 0.05). By W10, all plants were in the full fruit development phase. Even though there were up to 18 flowers per plant during the plants’ growing stage, only 4–5 full fruit developments per plant were observed at the end of the W12 in the present study, which also represents the harvest time.
Figure 2. Overview of plant growth based on average leaf numbers (±SD) over time (n = 8 to 14).
Statistically significant differences (p < 0.05) between growth phases are indicated by different letters;
n.s. means treatments within growth phases are not significant.
Plant biomass varied similarly in all treatments, but some small differences attributed to biochar addition could be detected. Based on temporal changes of stem biomass values, regardless of treatment, all stages were significantly different (p < 0.033) from each other (Figure 3a), indicating a continuous plant development. The apparent decrease in stem biomass by W12 can be an artifact due to the difference in sample number, as, at the end of the experiment, all remaining plants were analyzed instead of using the usual sample size (8 vs 2 plants per treatment, respectively). Looking at plant parts separately as stem and leaf, we can conclude that the growths of leaves and, consequently their biomass values, showed similar tendencies to that of stems (Figure 3), although both leaf biomass and leaf numbers reached their maxima earlier (W6), the compared stems in all treatments and remained approximately constant afterwards. Maximal stem biomass occurred in W10 in all treatments, when BC2.5 presented the highest stem biomass among treatments; however, the difference among treatments was not statistically significant (Figure 3b). Plant leaf mass showed significant differences from the other growth stages’ values only at W3 (p < 0.001; Figure 3b) in the early stage of plant development, i.e., at W6 BC0.5, while at W10 measurements BC2.5 treatments produced the highest leaf and stem dry weight mass per plant (Figure 3).
Agronomy 2019, 8, x FOR PEER REVIEW 6 of 14
Figure 3. Plant biomass values based on Capsicum annuum (a) stems and (b) leaves collected at the different phenological phases. Measurements are on a dry mass basis per plant. Capital letters represent statistical differences of p < 0.05 among growth stages. n = 3 to 12, ±SD.
3.3. Nutrient Availability Over Time
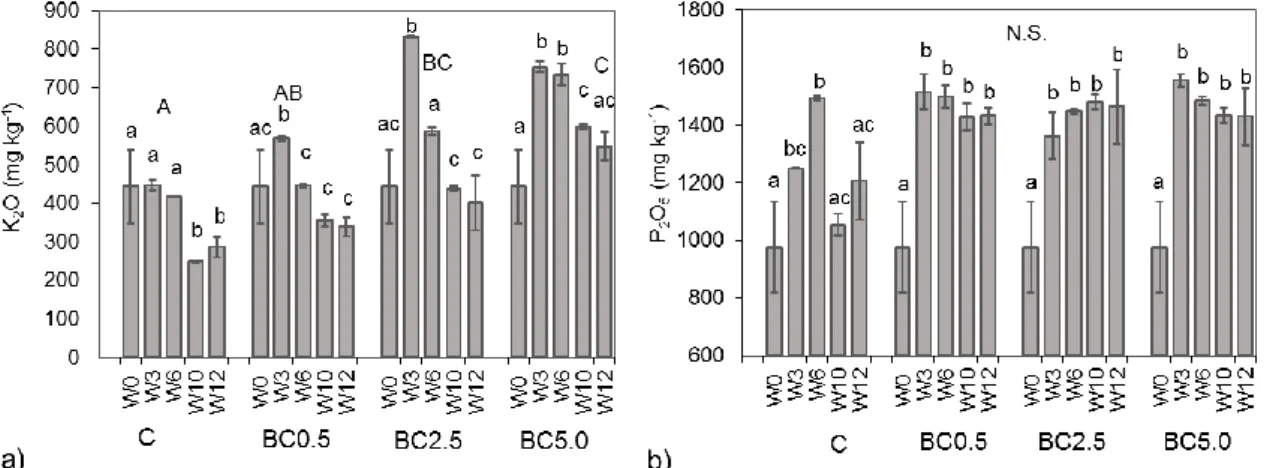
The added biochar contained large amounts of potassium (K) and phosphorus (P) (13570.3 ± 59.1 mg kg−1 as K2O and 5031.1 ± 32.6 mg kg−1 as P2O5, respectively), which resulted in noteworthy differences in their concentrations among control treatment and biochar amended soils, especially in the case of potassium (Figure 4).
Figure 4. Temporal changes of soil (a) K2O and (b) P2O5 concentrations during the study. Error bars represent standard deviations of three replicates per treatment. Statistically significant differences (p
< 0.05) are indicated by different letters, while N.S. signifies not significant differences between treatments.
Following the initial increase as a consequence of the added biochar’s K content, the potassium concentrations in the experiment were decreasing over time in all treatments, most notably in the BC2.5 amended soils (>51.8% reduction by the end of the experiment (W12); Figure 4a). The BC0.5 and BC5.0 treatments showed similar overall K reduction rates (35.7% and 27.3%, respectively), indicating that most K decreases were driven by plant growth rates and uptake, and its availability was not limiting. Overall, changes in K contents between treatments resulted in significant differences among treatments in some cases, such as between control (C) and BC2.5, or between BC5.0 and both control (C) and BC0.5 (Figure 4a).
By analyzing the change in phosphorus concentrations, we observed no significant temporal trend. After a significant initial increase following experiment setup, we observed up to 8% P reduction over the last 9 weeks of the study in the case of BC0.5 and BC5.0—though no statistically significant temporal change was detected (Figure 4b). The additional P from biochar was most likely not the main source of P supply, as the freely available P from fertilizer amended irrigation water
Figure 3.Plant biomass values based onCapsicum annuum(a) stems and (b) leaves collected at the different phenological phases. Measurements are on a dry mass basis per plant. Capital letters represent statistical differences ofp< 0.05 among growth stages.n= 3 to 12,±SD.
Plant leaf numbers showed no significant differences among treatments in any stage of the development. Plant development took place in a similar way in all treatments as indicated by temporal changes in leaf numbers. When comparing leaf number at different growth stages, we found significant increase during W1–W3 (plant development), which continued from W4 to W6 (flowering), reaching
Agronomy2019,9, 179 6 of 14
its final maximum by the end of W6, when plant maturity stage started and no further significant change was detected (Figure2). Plant flowering started to develop around W2, when 1–3 flowers per plants were observed. By W3, more than 50% of the plants were flowering with an average of 1.14 to 1.64 flowers per plant (BC0.5 and BC2.5, respectively; data not shown). In the flowering stage (starting from W3), major differences between treatments were not observed except in W5, where 24.9%
(p> 0.05) more flowers were counted in BC5.0 compared to control treatment, indicating primary positive effects of biochar on plant growth. Fruit development phase was reached around W6 of the study, when flower numbers showed no significant differences among treatments (p> 0.05). By W10, all plants were in the full fruit development phase. Even though there were up to 18 flowers per plant during the plants’ growing stage, only 4–5 full fruit developments per plant were observed at the end of the W12 in the present study, which also represents the harvest time.
Plant biomass varied similarly in all treatments, but some small differences attributed to biochar addition could be detected. Based on temporal changes of stem biomass values, regardless of treatment, all stages were significantly different (p< 0.033) from each other (Figure3a), indicating a continuous plant development. The apparent decrease in stem biomass by W12 can be an artifact due to the difference in sample number, as, at the end of the experiment, all remaining plants were analyzed instead of using the usual sample size (8 vs. 2 plants per treatment, respectively). Looking at plant parts separately as stem and leaf, we can conclude that the growths of leaves and, consequently their biomass values, showed similar tendencies to that of stems (Figure3), although both leaf biomass and leaf numbers reached their maxima earlier (W6), the compared stems in all treatments and remained approximately constant afterwards. Maximal stem biomass occurred in W10 in all treatments, when BC2.5 presented the highest stem biomass among treatments; however, the difference among treatments was not statistically significant (Figure3b). Plant leaf mass showed significant differences from the other growth stages’ values only at W3 (p< 0.001; Figure3b) in the early stage of plant development, i.e., at W6 BC0.5, while at W10 measurements BC2.5 treatments produced the highest leaf and stem dry weight mass per plant (Figure3).
3.3. Nutrient Availability Over Time
The added biochar contained large amounts of potassium (K) and phosphorus (P) (13570.3±59.1 mg kg−1as K2O and 5031.1±32.6 mg kg−1as P2O5, respectively), which resulted in noteworthy differences in their concentrations among control treatment and biochar amended soils, especially in the case of potassium (Figure4).
Agronomy 2019, 8, x FOR PEER REVIEW 6 of 14
Figure 3. Plant biomass values based on Capsicum annuum (a) stems and (b) leaves collected at the different phenological phases. Measurements are on a dry mass basis per plant. Capital letters represent statistical differences of p < 0.05 among growth stages. n = 3 to 12, ±SD.
3.3. Nutrient Availability Over Time
The added biochar contained large amounts of potassium (K) and phosphorus (P) (13570.3 ± 59.1 mg kg−1 as K2O and 5031.1 ± 32.6 mg kg−1 as P2O5, respectively), which resulted in noteworthy differences in their concentrations among control treatment and biochar amended soils, especially in the case of potassium (Figure 4).
Figure 4. Temporal changes of soil (a) K2O and (b) P2O5 concentrations during the study. Error bars represent standard deviations of three replicates per treatment. Statistically significant differences (p
< 0.05) are indicated by different letters, while N.S. signifies not significant differences between treatments.
Following the initial increase as a consequence of the added biochar’s K content, the potassium concentrations in the experiment were decreasing over time in all treatments, most notably in the BC2.5 amended soils (>51.8% reduction by the end of the experiment (W12); Figure 4a). The BC0.5 and BC5.0 treatments showed similar overall K reduction rates (35.7% and 27.3%, respectively), indicating that most K decreases were driven by plant growth rates and uptake, and its availability was not limiting. Overall, changes in K contents between treatments resulted in significant differences among treatments in some cases, such as between control (C) and BC2.5, or between BC5.0 and both control (C) and BC0.5 (Figure 4a).
By analyzing the change in phosphorus concentrations, we observed no significant temporal trend. After a significant initial increase following experiment setup, we observed up to 8% P reduction over the last 9 weeks of the study in the case of BC0.5 and BC5.0—though no statistically significant temporal change was detected (Figure 4b). The additional P from biochar was most likely not the main source of P supply, as the freely available P from fertilizer amended irrigation water
Figure 4. Temporal changes of soil (a) K2O and (b) P2O5 concentrations during the study.
Error bars represent standard deviations of three replicates per treatment. Statistically significant differences (p< 0.05) are indicated by different letters, while N.S. signifies not significant differences between treatments.
Agronomy2019,9, 179 7 of 14
Following the initial increase as a consequence of the added biochar’s K content, the potassium concentrations in the experiment were decreasing over time in all treatments, most notably in the BC2.5 amended soils (>51.8% reduction by the end of the experiment (W12); Figure4a). The BC0.5 and BC5.0 treatments showed similar overall K reduction rates (35.7% and 27.3%, respectively), indicating that most K decreases were driven by plant growth rates and uptake, and its availability was not limiting. Overall, changes in K contents between treatments resulted in significant differences among treatments in some cases, such as between control (C) and BC2.5, or between BC5.0 and both control (C) and BC0.5 (Figure4a).
By analyzing the change in phosphorus concentrations, we observed no significant temporal trend. After a significant initial increase following experiment setup, we observed up to 8% P reduction over the last 9 weeks of the study in the case of BC0.5 and BC5.0—though no statistically significant temporal change was detected (Figure4b). The additional P from biochar was most likely not the main source of P supply, as the freely available P from fertilizer amended irrigation water could be more easily accessible for the plants. Samples collected during the start of fruit development (W10) of the study for control treatments showed lower values in most nutrient concentrations compared to other weeks’ data (Figure4b). Statistically, however, we did not find differences between treatments during the course of the study.
During the first three weeks, while the plants were still in the growing phase, the total nitrogen amounts in the soil were relatively similar among treatments (Figure5a). The highest amount of total nitrogen was measured in the BC5.0 treatment at later weeks in the study (Figure5a); however, the added biochar contained approximately 1% total nitrogen, resulting in an approximately 500 mg additional nitrogen per kg soil in the case of BC5.0. During W3 sampling times, we separated all larger biochar pieces and analyzed the soil only; therefore, the total N concentration did not include most of the added biochar. Overall, no significant difference was detected either among treatments or among sampling times, except in the case of the highest biochar dose (BC5.0). However, some minor variations were still detectable. The total nitrogen concentration showed a 3.6% and 2.3% increase after W6 of the experiment for BC2.5 and BC5.0, respectively.
Significant temporal variation was observed in the amount of extractable inorganic nitrogen forms in the soil. Following an initial increase from the setup of the experiment to W6, the amount of NH4+-N was continuously and gradually decreasing in the study, leading to a similar temporal evolution in all treatments. By the end of the experiment, ammonium-N concentration reached the same value within statistical significance in all treatments, i.e., contained less than 5.0 mg kg−1(dry weight soil) NH4+-N (Figure5c). A significant temporal evolution was observed in nitrate content of the soil as well throughout the duration of the experiment. When samples were examined after introduction to freshly added NPK fertilizer (W3), we observed approximately a magnitude higher soil NO3−-N concentrations compared to later weeks in all treatments (Figure5d). In all treatments, although to a lesser degree in control soils, soil NO3−-N after W3 sharply decreased and then remained approximately constant over time (Figure5). Due to high temporal variances in NO3−-N and NH4+-N contents, the differences between treatments were not significant (Figure5c,d).
Agronomy2019,9, 179 8 of 14
Agronomy 2019, 8, x FOR PEER REVIEW 8 of 14
Figure 5. Soil nitrogen as (a) total N, (b) C:N ratio, (c) NH4+-N, and (d) NO3−-N, changes over the course of study. Error bars represent standard deviations between three replicates per treatment.
Statistically significant differences (p < 0.05) are indicated by different letters, while N.S. denotes not significant differences between treatments.
3.4. Effects of biochar on BNF rates
Control soil had 6.2 nmol g−1 hr−1 ARA, which also indicates typical potential N2 fixation rates in agricultural soils [33]. The BNF potentials significantly increased over time for both control (2.9 and 4.7 times higher for W6 and W12, respectively, Table 1) and BC0.5 treated soils (3.4 and 5.4 times higher rates for W6 and W12, respectively; Figure 6, Table 1). Remarkably, the higher rate of biochar additions somewhat suppressed BNF potentials at later weeks in the experiment, where the average BC5.0 data at W6 was very similar to control soils’ at the beginning of the experiment (Figure 6).
Figure 5.Soil nitrogen as (a) total N, (b) C:N ratio, (c) NH4+-N, and (d) NO3−-N, changes over the course of study. Error bars represent standard deviations between three replicates per treatment.
Statistically significant differences (p< 0.05) are indicated by different letters, while N.S. denotes not significant differences between treatments.
3.4. Effects of biochar on BNF Rates
Control soil had 6.2 nmol g−1hr−1ARA, which also indicates typical potential N2fixation rates in agricultural soils [33]. The BNF potentials significantly increased over time for both control (2.9 and 4.7 times higher for W6 and W12, respectively, Table1) and BC0.5 treated soils (3.4 and 5.4 times higher rates for W6 and W12, respectively; Figure6, Table1). Remarkably, the higher rate of biochar additions somewhat suppressed BNF potentials at later weeks in the experiment, where the average BC5.0 data at W6 was very similar to control soils’ at the beginning of the experiment (Figure6).
Agronomy2019,9, 179 9 of 14
Table 1.Statistical data of potential biological N2fixation (BNF) rates between treatments and times.
Single factor ANOVA (analysis of variance), where * representsp< 0.05, **p< 0.01, and ***p< 0.001.
All data not presented in the table had no significant differences (p> 0.1), numbers after W represents the number of weeks the experiment was carried out at the time of sample collection.
Treatment Types and Times Mean Difference 95% Confidence Interval
padj Lower Bound Upper Bound
CW0-CW6 11.93 −1.27 25.14 0.095
CW0-CW12 23.07 9.86 36.27 <0.001 ***
CW0-BC0.5W6 15.18 1.97 28.38 0.017 *
CW0-BC0.5W12 28.07 14.87 41.28 <0.001 ***
CW6-BC0.5W12 16.14 2.94 29.34 0.010 *
CW6-BC5.0W6 −12.16 −25.37 1.04 0.085
CW12-BC5.0W12 −18.90 −32.11 −5.70 0.002 **
CW12-BC2.5W6 −16.31 −29.51 −3.10 0.009 **
CW12-BC2.5W12 −20.22 −33.42 −7.01 0.001 **
CW12-BC5.0W6 −23.30 −36.50 −10.09 <0.001 ***
BC0.5W6-BC0.5W12 12.90 −0.31 26.10 0.059
BC0.5W6-BC2.5W12 −12.33 −25.53 0.88 0.078
BC0.5W6-BC5.0W6 −15.41 −28.61 −2.20 0.015 *
BC0.5W12-BC0.5W6 −21.31 −34.52 −8.11 <0.001 ***
BC0.5W12-BC2.5W12 −25.22 −38.43 −12.02 <0.001 ***
BC0.5W12-BC5.0W6 −28.3 −41.51 −15.10 <0.001 ***
BC0.5W12-BC5.0W12 23.91 10.70 37.11 <0.001 ***
Agronomy 2019, 8, x FOR PEER REVIEW 9 of 14
Figure 6. Effects of different amount of biochar addition to soils on N2 fixing potentials based on acetylene reduction. Statistically significant differences (p < 0.05) are indicated by different letters. n = 3, ±SD.
Table 1. Statistical data of potential biological N2 fixation (BNF) rates between treatments and times.
Single factor ANOVA (analysis of variance), where * represents p < 0.05, ** p < 0.01, and *** p < 0.001.
All data not presented in the table had no significant differences (p > 0.1), numbers after W represents the number of weeks the experiment was carried out at the time of sample collection.
Treatment Types and Times Mean Difference
95% Confidence Interval
p adj Lower Bound Upper Bound
CW0-CW6 11.93 –1.27 25.14 0.095
CW0-CW12 23.07 9.86 36.27 <0.001 ***
CW0-BC0.5W6 15.18 1.97 28.38 0.017 *
CW0-BC0.5W12 28.07 14.87 41.28 <0.001 ***
CW6-BC0.5W12 16.14 2.94 29.34 0.010 *
CW6-BC5.0W6 –12.16 –25.37 1.04 0.085
CW12-BC5.0W12 –18.90 –32.11 –5.70 0.002 **
CW12-BC2.5W6 –16.31 –29.51 –3.10 0.009 **
CW12-BC2.5W12 –20.22 –33.42 –7.01 0.001 **
CW12-BC5.0W6 –23.30 –36.50 –10.09 <0.001 ***
BC0.5W6-BC0.5W12 12.90 –0.31 26.10 0.059
BC0.5W6-BC2.5W12 –12.33 –25.53 0.88 0.078
BC0.5W6-BC5.0W6 –15.41 –28.61 –2.20 0.015 *
BC0.5W12-BC0.5W6 –21.31 –34.52 –8.11 <0.001 ***
BC0.5W12-BC2.5W12 –25.22 –38.43 –12.02 <0.001 ***
BC0.5W12-BC5.0W6 –28.3 –41.51 –15.10 <0.001 ***
BC0.5W12-BC5.0W12 23.91 10.70 37.11 <0.001 ***
4. Discussions
4.1. Effects of Biochar Addition on Plant Growth
Due to heat and water stress, the plants started to drop both flowers and small, undeveloped peppers during the study; however, the responses in excess drought or moisture conditions were similar in all treatments, regardless of biochar addition differences. As plants in all treatments showed similar responses to environmental stress conditions, the derived geochemical changes can be attributed solely to BC treatment effect and not to plants’ response to environmental conditions.
Figure 6. Effects of different amount of biochar addition to soils on N2 fixing potentials based on acetylene reduction. Statistically significant differences (p< 0.05) are indicated by different letters.n= 3,±SD.
4. Discussions
4.1. Effects of Biochar Addition on Plant Growth
Due to heat and water stress, the plants started to drop both flowers and small, undeveloped peppers during the study; however, the responses in excess drought or moisture conditions were similar in all treatments, regardless of biochar addition differences. As plants in all treatments showed similar responses to environmental stress conditions, the derived geochemical changes can be attributed solely to BC treatment effect and not to plants’ response to environmental conditions.
During the present study, we found that excess biochar addition, such as between BC2.5 and BC5.0, did not result in significant differences in plant development (p> 0.05). Average leaf number data did not show significant differences between control and even higher rates of biochar (BC2.5 and
Agronomy2019,9, 179 10 of 14
BC5.0) added soils during plant growing phase (p> 0.152). Plants in BC2.5 produced the highest stem biomass at the end of the experiment, but, overall, no significant difference was detected in either plant biomass or leaf number as a result of biochar treatment. Plant growth enhanced by biochar amendment can reach a maximum, where more biochar addition might not result in higher biomass or fruit yield or even can cause a decrease in its values [34]. Substantial improvements in the case of green pepper yield and quality with the addition of biochar to soils can be found [35]. However, minimal effects of biochar amendment on plant growth and yield can also be observed, e.g., similar results were found by Gravel et al. [36] when growth of sweet pepper were investigated, the results of which are in agreement with the present experiment. The largest plant biomass increase occurred during the first three to six weeks of the study, after which the leaf biomass growth became stationary, but stem biomass were still increasing up to the end of W10. These results are in agreement with general pepper plant growth time [37], indicating that treatment types, especially biochar addition, can help accelerating plant growth but might not ensure major differences in biomass and yield results on a long-run.
4.2. Effects of Biochar Addition on Soil Characteristics
Biochar addition influenced soil chemical properties. Both total nitrogen and the C:N ratio modified as a result of biochar addition compared to control soil. Temporal changes in inorganic nitrogen can be a result of leaching and nitrogen uptake by plants [38]. In the present study we observed only minor changes in total nitrogen concentrations; however, the total amount of nitrogen present in the soil could also be influenced, e.g., by atmospheric wet and dry deposition.
Biochar addition to silt loam soil influenced soil chemical and biological characteristics. Increases in soil pH levels were observed while also modifying the use of inorganic nitrogen (both NH4+-N after W6 and NO3−-N after W3) from the soil in all treatments similarly compared to the control.
An increase in soil pH values was expected, as many studies found similar results [39]. After an initial decrease, which could be an artifact due to removal of visible biochar particles form the soil sample, a significant increase was observed in all treatments, which lasted till the end of the experiment.
Several studies detected reduction and sorption of PO43−-P, NO3−-N, and NH4+-N in biochar amended soils [16,40], especially supplementing with fertilizer [41]. Hale et al. [16] found that biochar can release PO43−-P and weakly exchange NH4+-N, while no significant sorption or release of NO3−-N were found. While the present experiment showed a sudden decrease in NO3−-N values over time after an initial increase, Song et al. [13] found a fast increase in NO3−-N concurrent with a rapid drop in NH4+-N, indicating the influence of biochar on soil nitrifier and ammonia oxidizer microbial communities. At W3 of the study, we also observed magnitude higher NO3−-N values (Figure5d);
however, this increase most likely resulted from the fertilizer addition few days prior to soil sample collections. The added biochar did not have extractable NO3−-N present; therefore, all changes in NO3−-N concentrations were assumed to be resulting from added nutrients through the mineralization and nitrification processes. In the current study, we observed gradually decreasing NH4+-N over time, which was comparable to other studies investigating nitrogen cycling influenced by biochar amendment [23].
Even though the biochar used in the present experiment had large amounts of N, P, and K components, the already available and added commercial NPK fertilizer was most likely the main nutrient source for the plants. A slower usage of nutrients, on the other hand, can be achieved as a result of biochar additions [42].
4.3. Effects of Biochar Addition on Potential BNF Rates
Biochar addition can significantly influence the net nitrification and nitrogen mineralization potentials of the soils [43,44], which was likely the case in the present study. The biochar used in the experiment was investigated in a separate study, which found a continuous increase in net nitrification potentials with increasing biochar rates of up to 15% at 30 ◦C [44], emphasizing the influence of
Agronomy2019,9, 179 11 of 14
biochar amount on indigenous microbial communities. We found that low rate of biochar addition did not significantly influence the soils’ BNF rates; however, at higher biochar additions, the rates were suppressed. In the case of BC2.5, we observed some decreases in BNF rates over time, while all other treatments showed increases. The treatments showed that during W6 control treatments had the highest ARA potentials, while BC5.0 showed the lowest. During W12, BC0.5 treatment had the highest BNF rates, while BC2.5 and BC5.0 showed similarly low BNF values (Figure6). These findings are in contrary with many recent studies, where enhanced N2fixation values were observed after biochar application to soils [5]. For example, Quilliam et al. [45] investigated N2fixation rates after three years of biochar application to temperate agricultural soils and observed increased nitrogenase activities. However, the type and rate of biochar can influence microbial responses; as manure or crop residue-based biochar can promote more microbial abundance compared to wood-based biochars [46], which is the case in the present experiment.
Fertilizer addition can influence BNF rates, as found by Cusack et al. [47], where negative influence was detected. The pH ranges of soils can affect N2fixing rates, such that acidic conditions can constrain nitrogenase activities [48]; at closer to neutral pH values, the N2fixation might be more optimal [49].
In the present experiment, the soil pH values were all above neutral. Therefore, soil acidity should not be of concern. Based on our data, we did not find clear connections between BNF rates and pH changes over time.
5. Conclusions
The active research on the use of soil enhancer materials (e.g., biochar) from soil chemical perspective still provide varying results. Therefore, investigations focusing on soil-biochar-plant interactions are still necessary to constrain our understanding of complex biochar effects. The present study showed that biochar addition to silt loam soil can accelerate the decrease of total inorganic nitrogen amount of NH4+-N and NO3−-N. Soil K concentrations also slowly decreased during plant growth; however, overall nutrient conditions stayed optimal through the plant development till harvest.
Some of these parameters were affected by the characteristics of the applied biochar. Biochar addition to silt loam soil resulted in different degrees of benefits, as we found that 5.0% biochar addition resulted in similar outcomes as observed in BC2.5%, where plant growth and fruiting phases were comparably favorable. The BNF rates of the different treatments showed that biochar addition can suppress free living N2fixing microbial activities, while a low rate showed no substantial differences compared to controls. Therefore, we found that excess biochar addition might not result in significantly improved soil chemical parameters to achieve better fruit production on a short-term.
Author Contributions:Conceptualization,Á.H.; methodology,Á.H.; formal analysis,Á.H. and I.P.; resources, Z.B. and K.P.; writing—Original draft preparation, Á.H. G.G.; writing—Review and editing, G.G.; project administration,Á.H.; funding acquisition,Á.H.
Funding:This research was funded by the Hungarian National Research Fund, project number NKFI/OTKA PD−116157. The APC was funded by the Hungarian National Research Fund, project number NKFI/OTKA PD−116157.
Acknowledgments: The authors would like to thank Daniel and Tamas Csehovics for their help during data collection and experimental setup. This paper was supported by the János Bolyai Research Scholarship of the Hungarian Academy of Sciences.
Conflicts of Interest:The authors declare no conflict of interest. The funders had no role in the design of the study; in the collection, analyses, or interpretation of data; in the writing of the manuscript, or in the decision to publish the results.
Agronomy2019,9, 179 12 of 14
References
1. Graber, E.R.; Meller Harel, Y.; Kolton, M.; Cytryn, E.; Silber, A.; Rav David, D.; Tsechansky, L.; Borenshtein, M.;
Elad, Y. Biochar impact on development and productivity of pepper and tomato grown in fertigated soilless media.Plant Soil2010,337, 481–496. [CrossRef]
2. Jeffery, S.; Verheijen, F.G.A.; van der Velde, M.; Bastos, A.C. A quantitative review of the effects of biochar application to soils on crop productivity using meta-analysis.Agric. Ecosyst. Environ.2011,144, 175–187.
[CrossRef]
3. Vitousek, P.M.; Aber, J.D.; Howarth, R.W.; Likens, G.E.; Matson, P.A.; Schindler, D.W.; Schlesinger, W.H.;
Tilman, D.G. Human alteration of the global nitrogen cycle: Sources and consequences.Ecol. Appl.1997,7, 737–750. [CrossRef]
4. Lehmann, J.; Rillig, M.C.; Thies, J.; Masiello, A.; Hockaday, W.C.; Crowley, D. Biochar effects on soil biota—A review.Soil Biol. Biochem.2011,43, 1812–1836. [CrossRef]
5. Rondon, M.A.; Lehmann, J.; Ramírez, J.; Hurtado, M. Biological nitrogen fixation by common beans (Phaseolus vulgarisL.) increases with bio-char additions.Biol. Fertil. Soils2007,43, 699–708. [CrossRef]
6. Horel, A.; Potyó, I.; Szili-Kovács, T.; Molnár, S. Potential nitrogen fixation changes under different land uses as influenced by seasons and biochar amendments.Arab. J. Geosci.2018,11, 559. [CrossRef]
7. Sun, F.; Lu, S. Biochars improve aggregate stability, water retention, and pore-space properties of clayey soil.
J. Plant Nutr. Soil Sci.2014,177, 26–33. [CrossRef]
8. Novak, J.M.; Lima, I.; Xing, B.; Gaskin, J.W.; Steiner, C.; Das, K.C.; Ahmedna, M.; Rehrah, D.; Watts, D.W.;
Busscher, W.J.; et al. Characterization of designer biochar produced at different temperatures and their effects on a loamy sand.Ann. Environ. Sci.2009,3, 195–206.
9. Anderson, C.R.; Condron, L.M.; Clough, T.J.; Fiers, M.; Stewart, A.; Hill, R.A.; Sherlock, R.R. Biochar induced soil microbial community change: Implications for biogeochemical cycling of carbon, nitrogen and phosphorus.Pedobiologia2011,54, 309–320. [CrossRef]
10. Horel, A.; Schiewer, S. Impact of VOC removal by activated carbon on biodegradation rates of diesel, syntroleum and biodiesel in contaminated sand.Sci. Total Environ.2016,573, 106–114. [CrossRef] [PubMed]
11. Gao, L.; Wang, R.; Shen, G.; Zhang, J.; Meng, G.; Zhang, J. Effects of biochar on nutrients and the microbial community structure of tobacco-planting soils.J. Soil Sci. Plant Nutr.2017,17, 884–896. [CrossRef]
12. Horel, A.; Bernard, R.; Mortazavi, B. Impact of crude oil exposure on nitrogen cycling in a previously impactedJuncus roemerianussalt marsh in the northern Gulf of Mexico.Environ. Sci. Pollut. Res.2014,21, 6982–6993. [CrossRef] [PubMed]
13. Song, Y.; Zhang, X.; Ma, B.; Chang, S.X.; Gong, J. Biochar addition affected the dynamics of ammonia oxidizers and nitrification in microcosms of a coastal alkaline soil. Biol. Fertil. Soils 2014, 50, 321–332.
[CrossRef]
14. Laird, D.; Fleming, P.; Wang, B.; Horton, R.; Karlen, D. Biochar impact on nutrient leaching from a midwestern agricultural soil.Geoderma2010,158, 436–442. [CrossRef]
15. Mukherjee, A.; Zimmerman, A.R. Organic carbon and nutrient release from a range of laboratory-produced biochars and biochar—soil mixtures.Geoderma2013,193–194, 122–130. [CrossRef]
16. Hale, S.E.; Alling, V.; Martinsen, V.; Mulder, J.; Breedveld, G.D.; Cornelissen, G. The sorption and desorption of phosphate-P, ammonium-N and nitrate-N in cacao shell and corn cob biochars.Chemosphere2013,91, 1612–1619. [CrossRef] [PubMed]
17. Zackrisson, O.; Nilsson, M.-C.; Wardle, D.A. Key ecological function of charcoal from wildfire in the boreal forest.Oikos1996,77, 10–19. [CrossRef]
18. Major, J.; Steiner, C.; Downie, A.; Lehmann, J. Biochar effects on nutrient leaching. Chapter 15. InBiochar for Environmental Management Science and Technology; Lehmann, J., Joseph, S., Eds.; Earthscan: London, UK, 2009;
pp. 271–287.
19. Santi, C.; Bogusz, D.; Franche, C. Biological nitrogen fixation in non-legume plants.Ann. Bot. 2013,111, 743–767. [CrossRef]
20. Bezdicek, D.F.; Kennedy, A.C.Microorganisms in Action; Blackwell Scientific Publications: Oxford, UK, 1998;
p. 243.
Agronomy2019,9, 179 13 of 14
21. Rillig, M.C.; Wagner, M.; Salem, M.; Antunes, P.M.; George, C.; Ramke, H.-G.; Titirici, M.-M.; Antonietti, M.
Material derived from hydrothermal carbonization: Effects on plant growth and arbuscular mycorrhiza.
Appl. Soil Ecol.2010,45, 238–242. [CrossRef]
22. Atkinson, C.J.; Fitzgerald, J.D.; Hipps, N.A. Potential mechanisms for achieving agricultural benefits from biochar application to temperate soils: A review.Plant Soil2010,337, 1–18. [CrossRef]
23. DeLuca, T.H.; MacKenzie, M.D.; Gundale, M.J. Biochar effects on soil nutrient transformations. InBiochar for Environmental Management: Science, Technology and Implementation; Lehmann, J., Joseph, S., Eds.; Earthscan:
London, UK, 2009; pp. 251–270.
24. FAO.Guidelines for Soil Description; Food and Agriculture Organization of the United Nations: Rome, Italy, 2006.
25. Horel,Á.; Tóth, E.; Gelybó, G.; Dencs˝o, M.; Farkas, C. Biochar amendment affects soil water and CO2regime during capsicum annuum plant growth.Agronomy2019,9, 58. [CrossRef]
26. Schon, M.K.; Compton, M.P.; Bell, E.; Burns, I. Nitrogen concentrations affect pepper yield and leachate nitrate-nitrogen from rockwool culture.HortScience1994,48, 1241–1249. [CrossRef]
27. Yasuor, H.; Ben-Gal, A.; Yermiyahu, U.; Beit-Yannai, E.; Cohen, S. Nitrogen management of greenhouse pepper production: Agronomic, nutritional, and environmental implications.HortScience2013,50, 1688–1693.
[CrossRef]
28. Shackley, S. The economic viability and propspects for biochar in Europe: Shifting paradigms in uncertain times. InBiochar in European Soils and Agriculture. Science and Practice; Shackley, S., Ruysschaert, G., Zwart, K., Glaser, B., Eds.; Routledge: London, UK, 2016; pp. 205–226.
29. Aleksandrova, L.N.; Naidenova, O.A.Laboratory Practice in Soil Science; Kolos: Leningrad, Russian, 1976.
30. Welsh, D.T.; Bourgués, S.; de Wit, R.; Herbert, R.A. Seasonal variations in nitrogen-fixation (acetylene reduction) and sulphate-reduction rates in the rhizosphere of Zostera noltii: Nitrogen fixation by sulphate-reducing bacteria.Mar. Biol.1996,125, 619–628. [CrossRef]
31. Capone, D.G. Determination of nitrogenase activity in aquatic samples using the acetylene reduction procedure. InNitrogen in the Marine Environment; Carpenter, E.J., Capone, D.G., Eds.; Elsevier: New York, NY, USA, 1993; pp. 65–103.
32. Hardy, R.W.F.; Holsten, R.D.; Jackson, E.K.; Burns, R.C. The acetylene-ethylene assay for N2 fixation:
Laboratory and field evaluation.Plant Physiol.1968,43, 1185–1207. [CrossRef]
33. Pedersen, W.L.; Chakrabarty, K.; Klucas, R.V.; Vidaver, A.K. Nitrogen fixation (acetylene reduction) associated with roots of winter wheat and sorghum in Nebraska.Appl. Environ. Microbiol.1978,35, 129–135. [PubMed]
34. Sun, J.; He, F.; Shao, H.; Zhang, Z.; Xu, G. Effects of biochar application onSuaeda salsagrowth and saline soil properties.Environ. Earth Sci.2016,75, 630. [CrossRef]
35. Yao, C.; Joseph, S.; Li, L.; Pan, G.; Lin, Y.; Munroe, P.; Pace, B.; Taherymoosavi, S.; van Zwieten, L.; Thomas, T.;
et al. Developing more effective enhanced biochar fertilisers for improvement of pepper yield and quality.
Pedosphere2015,25, 703–712. [CrossRef]
36. Gravel, V.; Dorais, M.; Menard, C. Organic potted plants amended with biochar: Its effect on growth and Pythiumcolonization.Can. J. Plant Sci.2013,93, 1217–1227. [CrossRef]
37. Dorland, R.E.; Went, F.W. Plant growth under controlled conditions. VIII. Growth and fruiting of the chili pepper (Capsicum annuum).Am. J. Bot.1947,34, 393–401. [CrossRef]
38. Guohua, X.; Xiaorong, F.; Anthony, J.M. Plant nitrogen assimilation and use efficiency.Annu. Rev. Plant Biol.
2012,63, 153–182.
39. Chan, K.Y.; van Zwieten, L.; Meszaros, I.; Downie, A.; Joseph, S. Agronomic values of greenwaste biochar as a soil amendment.Soil Res.2007,45, 629–634. [CrossRef]
40. Clough, T.J.; Condron, L.M.; Kammann, C.; Muller, C. A review of biochar and soil nitrogen dynamics.
Agronomy2013,3, 275–293. [CrossRef]
41. Schulz, H.; Glaser, B. Effects of biochar compared to organic and inorganic fertilizers on soil quality and plant growth in a greenhouse experiment.J. Plant Nutr. Soil Sci.2012,175, 410–422. [CrossRef]
42. Lehmann, J.; Rondon, M. Biochar soil management on highly weathered soils in the humid tropics. In Biological Approaches to Sustainable Soil Systems; Uphoff, N., Ed.; CRC Press: Boca Raton, FL, USA, 2006;
pp. 517–530.
Agronomy2019,9, 179 14 of 14
43. Dempster, D.N.; Gleeson, D.B.; Solaiman, Z.M.; Jones, D.L.; Murphy, D.V. Decreased soil microbial biomass and nitrogen mineralisation withEucalyptus biocharaddition to a coarse textured soil.Plant Soil2012,354, 311–324. [CrossRef]
44. Kása, I.; Molnár, S.; Horel,Á. Net changes in nitrification in cultivated soil as a function of temperature and the type and concentration of biochar (in Hungarian).Agrokém. Talajt.2016,65, 297–311. [CrossRef]
45. Quilliam, R.S.; DeLuca, T.H.; Jones, D.L. Biochar application reduces nodulation but increases nitrogenase activity in clover.Plant Soil2013,366, 83–92. [CrossRef]
46. Gul, S.; Whalen, J.K.; Thomas, B.W.; Sachdeva, V.; Deng, H. Physico-chemical properties and microbial responses in biochar-amended soils: Mechanisms and future directions.Agric. Ecosyst. Environ.2015,206, 46–59. [CrossRef]
47. Cusack, D.F.; Silver, W.; McDowell, W.H. Biological nitrogen fixation in two tropical forests: Ecosystem-level patterns and effects of nitrogen fertilization.Ecosystems2009,12, 1299–1315. [CrossRef]
48. Limmer, C.; Drake, H.L. Non-symbiotic N2-fixation in acidic and pH-neutral forest soils: Aerobic and anaerobic differentials.Soil Biol. Biochem.1996,28, 177–183. [CrossRef]
49. Roper, M.M.; Smith, N.A. Straw decomposition and nitrogenase activity (C2H2reduction) by free-living microorganisms from soil: Effects of pH and clay content.Soil Biol. Biochem.1991,23, 275–283. [CrossRef]
© 2019 by the authors. Licensee MDPI, Basel, Switzerland. This article is an open access article distributed under the terms and conditions of the Creative Commons Attribution (CC BY) license (http://creativecommons.org/licenses/by/4.0/).