Article
Soil Organic Matter Alteration Velocity due to Land-Use Change: A Case Study under
Conservation Agriculture
Ádám Rieder1, Balázs Madarász2,3, Judit Alexandra Szabó2, Dóra Zacháry2, Anna Vancsik2, Marianna Ringer2,4, Zoltán Szalai2,4and Gergely Jakab2,4,*ID
1 Earth Surface Science Institute, University of Leeds, Leeds LS2 9JT, UK; eeari@leeds.ac.uk
2 Geographical Institute, Research Centre for Astronomy and Earth Sciences Hungarian Academy of Sciences, 1112 Budapest, Hungary; madarasz.balazs@csfk.mta.hu (B.M.); szabo.judit@csfk.mta.hu (J.A.S.);
zachary.dora@csfk.mta.hu (D.Z.); vancsik.anna@csfk.mta.hu (A.V.); ringer.marianna@csfk.mta.hu (M.R.);
szalai.zoltan@csfk.mta.hu (Z.S.)
3 Department of Soil Science and Water Management, Szent István University Faculty of Horticultural Science, 1118 Budapest, Hungary
4 Faculty of Science, Eötvös Loránd University, 1117 Budapest, Hungary
* Correspondence: jakabg@mtafki.hu; Tel.: +36-1-309-2600 (ext. 1478)
Received: 24 January 2018; Accepted: 19 March 2018; Published: 23 March 2018
Abstract:The cultivation of native forest soils usually triggers a decline in soil organic matter (SOM) and a deterioration of aggregates. Although switching to conservation tillage (CT) can supply SOM, little is known about the temporal resolution of this change. This study aims to quantify changes in soil organic carbon (SOC) content and SOM composition of the same soil under 14 years of CT, plowing tillage (PT), and native forest (NF). Plowing ameliorates the macroaggregate-mediated loss in SOC content, in both the fine fraction and the coarse particles. Decades of CT can significantly increase both the microaggregates and fine particles related to SOC content, whereas in the finest fraction, the volume of recalcitrant SOC increased the most, and reached the original value under NF. Continuous plowing triggered SOM molecular size increases in both aggregates and the fine fraction, whereas switching to CT restored the molecular SOM size of the fine fraction only. Therefore, this fraction can be changed, even in short periods. Water dissolved the largest and middle-sized molecules of SOM, which are mainly from macroaggregates. Even if aggregation did not increase due to turning to CT, the content of the larger molecules of SOM increased in this short time.
Keywords:temperate climate; carbon sequestration; conservation tillage; soil organic carbon
1. Introduction
Soil organic matter (SOM) is a combination of materials, which has been formed as a result of mainly plant remnants’ transformation in soil. This is also a general term, covering a very wide range of materials at various stages of degradation. SOM as a whole—among others—is responsible for the physical, chemical, and biological properties of the soil [1]. Its main component is the stable organic matter, which is often called humus, but it also contains raw plant litter and biologically active components [2]. As these components are mostly in the colloidal size range in the mull type of humus (mor and moder humus contain more large particles), they play a significant role in surface relevant processes such as the aggregation of soil particles, and water and nutrient holding capacity [3].
The degree and resistance of aggregation are of great importance, as they can determine the structure, as well as the water and air availability of the whole soil profile [4].
Sustainability2018,10, 943; doi:10.3390/su10040943 www.mdpi.com/journal/sustainability
Current SOM composition and volume are governed by the balance of inputs (mainly plant litter) and outputs (mineralisation to CO2) [5]. In virgin soils under natural vegetation, SOM content can reach its potential maximum, which is limited by the climate and particle size distribution [6,7].
A finer soil texture increases the SOM holding capacity [6,8], which, as Wiesmeier et al. [9] reported, was also positively correlated with mean annual temperature and negatively correlated with the mean annual precipitation, as well as elevation and slope steepness in central Europe. On the other hand, actual SOM content is mainly determined by land use [10–12]. Forest clearance leads to a considerable decrease in SOM due to the reduced biological production and input to the soil.
In addition, the cultivation of virgin soils indicates higher microbiological activity in the tilled soil layer, which increases SOM mineralisation [13]. Under arable soil conditions, SOM content stabilizes at a low level, which triggers a soil organic carbon (SOC) saturation deficit [14]. During the mineralisation process, SOM does not degrade as a whole, as some fractions are more vulnerable than others. The most recalcitrant fraction is the mineral phase-associated organic matter (MOM), which is presumed to be protected against microbiological degradation in terms of binding to soil particles and the absence of an active surface [9,15]. Contrarily, the most mobile fraction is the particulate organic matter (POM), which contains less degraded plant tissue fragments than the mineral phase [16]. According to the widely accepted theory, during intensive SOM mineralisation, the POM fraction degrades first;
however, some studies have also reported results about considerable losses of MOM [8]. Some SOM components are sheltered in aggregates without direct links to the mineral surface, which makes them vulnerable against mineralisation [17]. Consequently, SOC content and SOM composition changes vary within a wide temporal scale measured by the mean residence time of the different pools [18].
SOM turnover times are measured and modelled by many authors, even though the published results are not univocal [19,20]. However, in general, mineralisation is presumed to be much faster than humification [21].
Hassink [8] also declared that under temperate conditions, the SOC saturation of virgin soils was the function of a fine (<20µm) particle ratio (SOM attached directly to the mineral phase), as saturation was independent of the POM content, according to the Equation (1):
Cpot=4.09+0.37×Rf
(1) whereCpotis the potential C holding capacity of the fine fraction (g kg−1), and Rf is the ratio of fine (<20 µm) particles in the soil. Practically, actual C saturation of a soil does not match with this theoretical value. To quantify the difference, Meyer et al. [22] introduced the term ‘degree of C saturation’, as follows:
degree o f C saturation(%) =
1−Cpot−Cact
Cpot
×100 (2)
whereCactis the actual C content of the fine fraction (g kg-1).
The fractionated mineralisation of SOM can trigger changes in SOM composition, even at the molecular scale. Changing SOM quantity and composition leads to changes in physical soil properties such as aggregate stability, porosity, hydraulic conductivity, and resistance against crusting.
Therefore, cultivation of virgin soils can cause considerable decrease in soil health and quality [23,24].
On the other hand, conservation tillage (CT) is a possible option to minimise the degrading effects of conventional plowing tillage (PT), and even improve soil quality [25]. Even though CT covers various agro-techniques depending on geographical locations, it is basically based on non-inversion tillage and reduced tillage. Recently, the application of (green) manure and permanent surface coverage, i.e., cover crop, have come into the spotlight [26]. Most studies on CT focus on arid and semiarid regions, as soil moisture protection is crucial there, and hence, little is known about the effect of CT on SOM content and composition under temperate subhumid climate [27]. The velocity of change is also
hardly predictable and hence understudied, as it is a function of several environmental conditions, including climate change [28].
This study aimed to quantify the changes in SOC content and SOM composition of the same soil under native forest (NF), PT, and CT. Our hypothesis is that 14 years of CT after PT is enough for the SOC content to increase in all of the soil fractions. Moreover, we presume that this increase causes changes in SOM composition as well. We also hypothesise that SOM composition results gained by photometric and photon correlation methods are comparable to each other.
2. Materials and Methods
2.1. Study Site
The investigation site was located in western Hungary, next to the village of Szentgyörgyvár (46◦44054.1” N; 17◦08048.4” E) (Figure1A). In this study site, PT (cultivation based on annual moldboard plowing) and CT (using a reduced number of tillage operations by combined machinery, without inversion and leaving a minimum of 30% of crop residues on the surface) have been compared with each other since 2004 at the field scale [29,30] (Figure1C). NF is situated right next to the station at the very same morphological position. According to the historical land-use databases of Hungary, forest clearance and the start of cultivation happened after the 1870s at the experimental site, while the forest remained intact [31] (Figure1B). The whole cropfield was under PT until 2004, when two plots were converted to CT. No manure was applied at all, however, mineral fertiliser was used as an annual average of 25 kg ha−1, 15 kg ha−1, and 15 kg ha−1for nitrogen, phosphor, and potassium, respectively, between 1940 and 2004. Maize, winter wheat, and sunflower dominated the cropping system. Jakab et al. reported detailed data on the applied techniques [32,33] (Table1), while the forest is characterised byQuercus petraea,Quercus cerris, andAcer campestris, without intensive silviculture.
The soil is a haplic luvisol formed on sandy loess with a particle size distribution of 4% clay (<0.002 mm), 60% silt (0.002–0.02), and 36% sand. No CaCO3was present in the solum, whereas the pH varied between 6.25–6.36 in distilled water, and 4.57–4.80 in KCl. The cation exchange capacity of the tilled layer was 15.7 cmolckg−1. The climate was subhumid, with a mean annual precipitation of 628 mm, and a temperature of 11◦C. Slope steepness along the plots (50 m) was 9–10%, resulting in a uniform slope with an aspect to the east [34,35]. Samples from 0–20 cm depth (the potentially cultivated layer) of NF, CT, and PT fields were collected with repetitions. Samples were taken from the upper, middle, and lower third of the plots, at points that were equal distance from each other. All three samples per plot were a composite of three subsamples gathered from a circle with a diagonal of 1 m. Therefore, there are no relevant changes in slope steepness among the sampling points.
Table 1.General cultivation activities on the studied crop fields.
Ploughing Tillage Conservation Tillage
Ploughing -
Levelling Levelling and rolling *
Seed-bed preparation Seed-bed preparation
Sowing Sowing
Stubble operation (disking) Stubble operation (disc or cultivator) (Medium deep subsoiling) * (Medium deep subsoiling) *
* If it is needed.
Figure 1.(A) Location of the study area (solid red rectangle); (B) Land use of the study site in the 1860s (Arcanum Ltd.; after [31]); 1: forest; 2: arable; 3: orchard; 4: vineyard; (C) Land use of the study site in 2014 (Google Earth) NF: natural forest plot; PT/CT Szentgyörgyvár research station; CT: conservation tillage plot; PT: plowing tillage plot.
2.2. Analytical Processes
The fractionation of the samples was based on the widely accepted and applied procedure described by Zimmermann et al. [35] and improved by Poeplau et al. [36]. This procedure divides the bulk soil by applying wet sieving after ultrasonic dispersion with 22 J/mL, to fraction >63µm and <63µm particles, which is the silt and clay (s+c) fraction. Fraction >63µis divided again in terms of specific weight. Particles <1.8 g cm−3should represent the particulate organic matter (POM), whereas particles >1.8 g cm−3comprise the sand and aggregates (S+A) fraction. The SOC content of the s+c fraction is divided into recalcitrant (rSOC) and mobile pools. The latter one was oxidised using 6% NaOCl to determine the rSOC (remaining fraction after oxidation). Moreover, the water soluble dissolved organic carbon (DOC) was also determined and measured [35].
The SOC content of the solid and DOC samples were determined through dry combustion at 900◦C, using a Shimadzu TOL-LSSSM th5000 instrument, whereas alkaline soluble carbon content was measured by a GE Sievers 900 device (supercritical oxidation), as this device is able to measure samples with high salinity and alkalinity.
Particle size composition was measured using a Fritch Analysette 22 Microtech laser diffractometer in the range of 0.2–2000µm. Samples were treated with 0.5 M sodium pyrophosphate (Na4P2O7) and subjected to 15 min of ultrasonic agitation for disaggregation [37].
2.3. Prediction on SOM Composition
As SOM composition cannot be quantified directly, parallel proxies were used for predictions.
Alkaline extracts were prepared for photometric and photon correlation measurements. For creating the extracts, 0.5 M NaOH solution was used [38]. DOC samples represented the water-soluble fraction.
Absorbance spectra of the extractions were recorded from 180 nm to 1000 nm with a resolution of 0.5 nm. Photometric indices such as E2/E3(245/265 nm), E4/E6(400/600 nm), and the ultraviolet absorbance ratio index (URI) (210/254 nm) were calculated as proxies of SOM composition [39–42].
Dynamic light scattering (Malvern Zetasizer Nano), as a method for the molecular size distribution measurement of the extractions, was also used. Results are the averages of at least three repetitions.
2.4. Statistical Analysis
Data distribution was checked using the Kolmogorov–Smirnov test, and transformations were carried out wherever needed. Differences were tested using one-way analysis of variance (ANOVA), and means were compared using Tukey’s test. As POM had values that were one order of magnitude
higher, this fraction was excluded from the ANOVA for the SOC. The statistical analysis was carried out using IBM SPSS Statistics 20 software.
3. Results and Discussion
3.1. Changes in Physical Properties
Under forest, the amount of aggregates significantly (p< 0.001) exceeded the amount of the finest particles (Figure2). Forest clearance and cultivation changed the aggregate stability of the soil, whereas 14 years of CT was not enough to improve aggregation, as also reported by Zotarelli et al. [43].
POM had the same limited proportion under each land use, which is one order of magnitude lower (p< 0.001) compared with the S+A and s+c fractions.
Figure 2.Changes in aggregate stability and particulate organic matter (POM) share of the soil under various land uses. NF—native forest; CT—conservation tillage; PT—plowing tillage; (S+A)—sand and aggregates (>63µm); (s+c)—silt and clay fraction (<63µm); various letters indicate significant difference (p< 0.05).
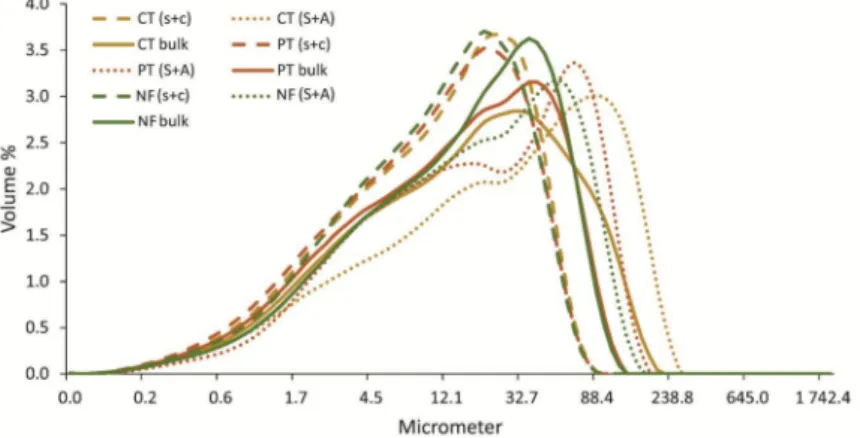
Soil fractions from different land-use types had nearly the same particle size distribution (Figure3);
however, the most uniform distribution was for the fine fraction (<63µm). The biggest sized aggregates were still microaggregates (<250µm), and were related to the CT soil, whereas the smallest ones were under NF. This suggests that—at least in the present case study—aggregate size and aggregate stability were independent of each other, as was also reported by Six and Paustian [17]. However, Zotarelli et al. [43] found a direct relationship between aggregate size and stability in Oxisols.
Figure 3. Particle size distributions of the investigated soils and soil fractions. NF—native forest;
CT—conservation tillage; PT—plowing tillage; (S+A)—sand and aggregates (>63µm); (s+c)—silt and clay fraction (<63µm).
The degree of C saturation (Equation (2)) for the PT, CT, and NF soils was 55.7%, 86.7%, and 151.7%, respectively. This supports the theory that tillage mitigates even the most recalcitrant SOC content related to the s+c fraction [44,45]. On the other hand, 14 years of CT could be enough for noticeable SOC reload in the finest fraction, which contradicts the mainstream results underlying the long turnover time of the s+c-related carbon pool [9,46], even though Meyer [22] had detected similarly rapid changes (Figure4). Since these results are based on case studies, more robust and widespread investigations are needed in order to determine general consequences.
Figure 4. Carbon saturation values of the soil under three different land-use conditions at Szentgyörgyvár research station according to Equation (1) [8]. NF—native forest; CT—conservation tillage; PT—plowing tillage; whiskers are for standard deviations.
3.2. Changes in SOC Content
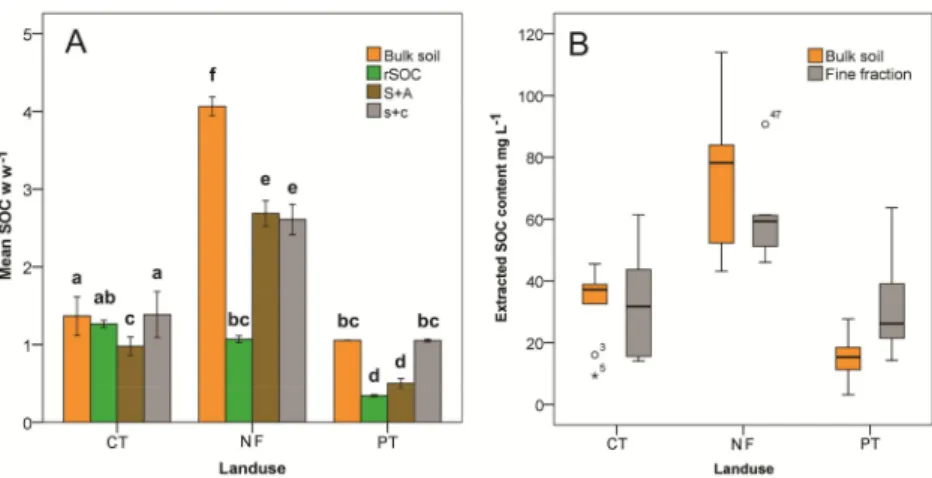
Bulk NF soil contained more than three times the SOC compared with crop fields; however, CT significantly exceeded PT (p< 0.05) in terms of SOC (Figure5A). The lowest standard deviation values were found under PT, mainly because it had the lowest SOC and POM content (Figure2).
POM had a higher SOC content than the other fractions; as this is presumed to be the function of decomposed plant litter, this was not included in this comparison. The mean POM values for CT, NF, and PT were 30.08 (±1.50), 6.54 (±0.28), and 8.24 (±0.29)w/wper fraction, respectively. These values demonstrate the beneficial effect of CT (leaving plant litter on the surface). However, interestingly, the forest soil had the lowest value. This could be the result of the high reactivity of forest litter tissue, which provides more organic mineral complexes [47] and increases bulk density.
Silt and clay-associated SOC have the very same values as the bulk soils for the crop fields, but differ from each other (p< 0.05). This highlights the rapid changes (14 years) in SOC content, even at the finest fraction. Panettieri et al. [48] have also measured recent SOM attachment to the s+c fraction over 12 years, under similar climate and soil conditions in western France. On the other hand, the main part of this SOC pool was recalcitrant under CT, resulting in high rSOC values, whereas, under PT and forest labile, vulnerable SOC components dominated this pool. In contrast, under NF, s+c SOC was higher, but made a lower contribution to the SOC content of the bulk soil. S+A-associated SOC considerably increased due to the omission of plowing [15,49]. Beare et al. [50] found the same increase in the microaggregate fraction after 13 years of no tillage, which underlined the velocity of the SOC increase in the microaggregate (<250µm) fraction. In the present case study, no macroaggergates (>250µm) were found, because of the high-energy ultrasonic pretreatment suggested by Popleau et al. [36].
Under NF, bulk soil had considerably higher SOC content than s+c, thus, emphasising the high SOC content of macroaggregates. Since macroaggregates were destroyed, this SOC turned into the water dissolved fraction, which was 4.64 (±0.28), 10.66 (±0.11), and 1.76 (±0.14) mg L−1for CT, NF, and PT, respectively.
Figure 5.Soil organic carbon (SOC) content of the soil fractions under various land uses (A) and the alkaline soluble SOC content (B); NF—native forest; CT—conservation tillage; PT—plowing tillage;
(S+A)—sand and aggregates (>63µm); (s+c)—silt and clay fraction (<63µm); whiskers are for standard deviations; various letters indicate significant difference (p< 0.05).
Alkaline-extracted SOM content accorded the SOM content of the bulk soil, as well as the fine fraction (Figure5B). Based on the present case study, this suggests that this extraction represented the SOC amount well as a whole, regardless of the changes in SOM composition. On the other hand, extraction increases variance values, and therefore can modify the ratios between the bulk soil and the fine fraction, as was the case under PT.
3.3. Changes in SOM Composition
POM was excluded from SOM composition predictions, as it reflected the most recent and undecomposed plant litter [14]. Moreover, its share in the soils was negligible (Figure5A).
The results of E2E3indicated that the rSOC fraction had the lowest polymerisation, independent of land use (Figure6a). Contrarily, E4E6did not support this or any other trend (Figure6b). Absorbance values at 280 nm seemed to be the function of SOC content, rather than indicators of the degree of aromaticity (Figure 6c). The URI, the other proxy of aromaticity, resulted in a homogeneous pattern, except for the DOC samples of the cropfields, which suggests a connection to water solubility (Figure6d). In general, there was no difference among the SOM compositions of different land use based on photometric indices.
The size distributions of the SOM molecules in the aggregates were bimodal (peaks at ~40 nm and 400 nm), and indicated the same size peaks for the crop fields (Figure7a), which is in contrast with the organomineral theory, i.e., aggregates contain the largest SOM molecules [51]. On the other hand, these aggregates were microaggregates, and the SOM that was rejected from the macroaggregates were in the DOC fraction, as described above. Under forest, a third peak appeared at 10 nm, which triggered a much lower average SOM molecular size. The SOM attached to the finest mineral particles revealed the most heterogeneous pattern for the cropfield, as they contained molecules >900 nm (Figure7b). Besides this peak, PT had the most similar pattern in the case of S+A, whereas CT and NF resulted in different SOM compositions in the S+A and s+c fractions. Due to heavy oxidisation, both cropfield SOMs became more homogeneous, losing their molecules that were <1000 nm and
<100 nm (Figure7c). In contrast, the silt and clay-associated SOM of the NF seemed to be degraded as a whole, resulting in very similar rSOC molecular size distribution (Figure7c). The largest molecules were found in the DOC fraction, which is in line with the macroaggregate theory. Water solubility seemed to be limited to two molecular size ranges under each land-use type (Figure7d). The ratio between these peaks were inversely proportional with cultivation intensity, which highlights the role of macroaggregate-containing, polymerised, water-soluble SOM [44,48,49].
Figure 6.Photometric index values of the soil fractions. (a) E2E3(245/265 nm); (b) E4/E6(465/665 nm);
(c) Absorbance at 280 nm; (d) URI (210/254 nm); S+A—sand and aggregates fraction; s+c—silt and clay fraction; rSOC—recalcitrant soil organic carbon; DOC—dissolved organic carbon.
Figure 7. Molecular size distributions of the dissolved soil organic matter (SOM) of the separated fractions under various land-use types. (a) sand and aggregate fraction; (b) silt and clay fraction;
(c) recalcitrant soil organic matter; (d) dissolved organic matter. Histograms represent averages.
4. Conclusions
Plowing seems to be a potential risk in terms of SOC content for each fraction. Beneath the well-known loss from macroaggregates, mineralisation ameliorates SOC content, both in the fine fraction and at the coarse particles. Decades of CT can significantly increase both the S+A and s+c-related SOC content, whereas in the finest fraction, the volume of recalcitrant SOC increased the most, reaching the original value under NF. Continuous cultivation triggered SOM molecular size increases in both aggregates and the fine fraction, whereas switching to CT restored the molecular SOM size of the fine fraction only. Therefore, this fraction can be changed, even in short periods. The lack of
changes in aggregate-associated SOM was also suggested by the unchanged aggregate stability. Water dissolves the largest and middle-sized molecules from a narrow range, and therefore, their chemical character is important. This contradicts the traditional “the smaller the more soluble” axiom, but supports the outstanding vulnerability of macroaggregate-contained large molecular-sized SOM. Even if aggregation did not increase due to turning to CT, the content of SOM of a higher molecular size increased in this short time. As these preliminary conclusions are the results of one particular research site, further case studies should be involved in order to draw general conclusions.
Acknowledgments: Support through the NKFI—K-123953 and the Bolyai János Research Scholarship of the Hungarian Academy of Sciences (G. Jakab) is gratefully acknowledged. The authors wish to express their cordial thanks to EU LIFE, Syngenta (LIFE03 ENV/UK/000617), Syngenta Hungary Ltd. and KMOP project:
4.2.1/B-10-2010-002, for financial and infrastructural support.
Author Contributions:G.J., B.M., andÁ.R. conceived and designed the experiments; G.J.,Á.R., J.A.S., A.V., Z.S., M.R., and D.Z. performed the experiments; G.J. andÁ.R. analysed the data; G.J.,Á.R., and B.M. wrote the paper.
Conflicts of Interest:The authors declare no conflict of interest.
References
1. Lehmann, J.; Kleber, M. The contentious nature of soil organic matter.Nature2015,528. [CrossRef] [PubMed]
2. Stevenson, F.J. Humus Chemistry Genesis, Composition, Reactions, 2nd ed.; Wiley and Sons Inc.:
New York, NY, USA, 1994.
3. Ponge, J.F. Plant-soil feedbacks mediated by humus forms: A review.Soil Biol. Biochem.2013,57, 1048–1060.
[CrossRef]
4. Kalhoro, S.A.; Xu, X.; Chen, W.; Hua, R.; Raza, S.; Ding, K. Effects of Different Land-Use Systems on Soil Aggregates: A Case Study of the Loess Plateau (Northern China).Sustainability2017,9, 1349. [CrossRef]
5. Bilandžija, D.; Zgorelec, Ž.; Kisi´c, I. Influence of tillage systems on short-term soil CO2 emissions.
Hung. Geogr. Bull.2017,66, 29–35. [CrossRef]
6. Angers, D.A.; Aurray, D.; Saby, N.P.A.; Walter, C. Ecosystem Carbon Sequestration.Soil Use Manag.2011,27, 448–452. [CrossRef]
7. Harrison-Kirk, T.; Beare, M.H.; Meenken, E.D.; Condron, L.M. Soil organic matter and texture affect responses to dry/wet cycles: Effects on carbon dioxide and nitrous oxide emissions.Soil Biol. Biochem.2013,57, 43–55.
[CrossRef]
8. Hassink, J. The capacity of soils to preserve organic C and N by their association with clay and silt particles.
Plant Soil1997,191, 77–87. [CrossRef]
9. Wiesmeier, M.; Hübner, R.; Spörlein, P.; Geu, U.; Hangen, E.; Reischl, A.; Schilling, B.; von Lützow, M.;
Kögel-Knabner, I. Carbon sequestration potential of soil in southeast Germany derived from stable soil organic carbon saturation.Glob. Chang. Biol.2014,20, 653–665. [CrossRef] [PubMed]
10. Liu, D.; Wang, Z.; Zhang, B.; Song, K.; Li, X.; Li, J.; Li, F.; Duan, H. Spatial distribution of soil organic carbon and analysis of related factors in croplands of the black soil region, Northeast China.Agric. Ecosyst. Environ.
2006,113, 73–81. [CrossRef]
11. Ye, X.; Tang, S.; Cornwell, W.K.; Gao, S.; Huang, Z.; Dong, M.; Cornelissen, J.H.C. Impact of land-use on carbon storage as dependent on soil texture: Evidence from a desertified dryland using repeated paired sampling design.J. Environ. Manag.2015,150, 489–498. [CrossRef] [PubMed]
12. Geraei, D.; Hojati, S.; Landi, A.; Cano, A. Total and labile forms of soil organic carbon as affected by land use change in southwestern Iran.Geoderma Reg.2016,7, 29–37. [CrossRef]
13. Lal, R. Soil Carbon Sequestration Impacts on Global climate change and food security. Science2004,304, 1623–1627. [CrossRef] [PubMed]
14. Murty, D.; Kirschbaum, M.U.F.; McMurtrie, R.E.; McGilvray, H. Does conversion of forest to agricultural land change soil carbon and nitrogen? A review of the literature.Glob. Chang. Biol.2002,8, 105–123. [CrossRef]
15. Skjemstad, J.; Spouncer, L.R.; Cowie, B.; Swift, R.S. Calibration of the Rothamsted organic carbon turnover model (RothC ver.26.3), using measurable soil organic carbon pools. Aust. J. Soil Res. 2004, 42, 79–88.
[CrossRef]
16. Neufeldt, H.; Resck, D.V.S.; Ayarza, M.A. Texture and land-use effects on soil organic matter in Cerrado Oxisols, Central Brazil.Geoderma2002,107, 151–164. [CrossRef]
17. Six, J.; Paustian, K. Aggregate-associated soil organic matter as an ecosystem property and a measurement tool.Soil Biol. Biochem.2014,68, A4–A9. [CrossRef]
18. Carvalhais, N.; Forkel, M.; Khomik, M.; Bellarby, J.; Jung, M.; Migliavacca, M.; Mu, M.; Saatchi, S.; Santoro, M.;
Thurner, M.; et al. Global covariation of carbon turnover times with climate in terrestrial ecosystems.Nature 2014,514, 213–217. [CrossRef] [PubMed]
19. Beniston, J.W.; DuPont, S.T.; Glover, J.D.; Lal, R.; Dungait, J.A.J. Soil organic carbon dynamics 75 years after land-use change in perennial grassland and annual wheat agricultural systems.Biogeochemistry2014,120, 37–49. [CrossRef]
20. Bruun, T.B.; Elberling, B.; de Neergaard, A.; Magid, J. Organic Carbon Dynamics in Different Soil Types After Conversion of Forest to Agriculture.Land Degrad. Dev.2013,26, 272–283. [CrossRef]
21. Tisdale, J.M.; Oades, J.M. Organic matter and water-stable aggregates in soils.J. Soil Sci.1982,33, 141–163.
[CrossRef]
22. Meyer, N.; Bornemann, L.; Welp, G.; Schiedung, H.; Herbst, M.; Amelung, W. Carbon saturation drives spatial patterns of soil organic matter losses under long-term bare fallow.Geoderma2017,306, 89–98. [CrossRef]
23. Cambardella, C.A.; Elliott, E.T. Carbon and Nitrogen Distribution in Aggregates from Cultivated and Native Grassland Soils.Soil Sci. Soc. Am. J.1993,57, 1071–1076. [CrossRef]
24. Jancsovszka, P. Sustainable development goals (SDGs).Tájökológiai Lapok2016,14, 71–181, (In Hungarian with English abstract).
25. Kassam, A.; Basch, G.; Friedrich, T.; Gonzalez, E.; Trivino, P.; Mkomwa, S. Mobilizing greater crop and land potentials sustainably.Hung. Geogr. Bull.2017,66, 3–11. [CrossRef]
26. Gomez, J.A. Sustainability using cover crops in Mediterranean tree crops, olives and vines-Challenges and current knowledge.Hung. Geogr. Bull.2017,66, 13–28. [CrossRef]
27. Crews, E.C.; Rumsey, B.E. What Agriculture Can Learn from Native Ecosystems in Building Soil Organic Matter: A Review.Sustainability2017,9, 578. [CrossRef]
28. Mika, J.; Farkas, A. Sensitivity of inland water bodies, natural vegetation and agriculture to weather extremes and to climate change.Tájökológiai Lapok2017,15, 85–90, (In Hungarian with English abstract).
29. Bádonyi, K.; Madarász, B.; Kertész,Á.; Csepinszky, B. Study of the relationship between tillage methods and soil erosion on an experimental site in Zala County.Hung. Geogr. Bull.2008,57, 147–167. (In Hungarian) 30. Madarász, B.; Bádonyi, K.; Csepinszky, B.; Mika, J.; Kertész,Á. Conservation tillage for rational water
management and soil conservation.Hung. Geogr. Bull.2011,60, 117–133.
31. Timár, G.; Biszak, S.; Székely, B.; Molnár, G. Digitized Maps of the Habsburg Military Surveys: Overview of the Project of ARCANUM Ltd. (Hungary). InPreservation in Digital Cartography. Lecture Notes in Geoinformation and Cartography; Jobst, M., Ed.; Springer: Berlin/Heidelberg, Germany, 2011; pp. 273–283.
32. Jakab, G.; Madarász, B.; Szabó, J.A.; Tóth, A.; Zacháry, D.; Szalai, Z.; Kertész,Á.; Dyson, J. Infiltration and soil loss changes during the growing season under ploughing and conservation tillage.Sustainability2017,9, 1726.
[CrossRef]
33. Kertész, Á.; Bádonyi, K.; Madarász, B.; Csepinszky, B. Environmental aspects of conventional and conservation tillage. In No-Till Farming Systems; Goddart, T., Zoebish, M., Gan, Y., Ellis, W., Watson, A., Sombatpanit, S., Eds.; Special Publication; World Association of Soil and Water Conservation:
Bangkok, Thailand, 2007; pp. 313–329.
34. Kertész,Á.; Madarász, B.; Csepinszky, B.; Benke, S. The role of conservation agriculture in landscape protection.Hung. Geogr. Bull.2010,59, 167–180.
35. Zimmermann, M.; Leifeld, J.; Schmidt, M.W.I.; Smith, P.; Fuhrer, J. Measured soil organic matter fractions can be related to pools in the RothC model.Eur. J. Soil Sci.2007,58, 658–667. [CrossRef]
36. Poeplau, C.; Dona, A.; Dondini, M.; Leifeld, J.; Nemod, R.; Schumacher, J.; Senapati, N.; Wiesmeier, M.
Reproducibility of a soil organic carbon fractionation method to derive RothC carbon pools.Eur. J. Soil Sci.
2013,64, 735–746. [CrossRef]
37. Centeri, C.; Jakab, G.; Szabó, S.; Farsang, A.; Barta, K.; Szalai, Z.; Bíró, Z. Comparison of particle-size analyzing laboratory methods.Environ. Eng. Manag. J.2015,14, 1125–1135.
38. Galantini, J.A.; Senesi, N.; Brunetti, G.; Rosell, R. Influence of texture on organic matter distribution and quality and nitrogen and sulphur status in semiarid pampean grassland soils of Argentina.Geoderma2004, 123, 143–152. [CrossRef]
39. Tan, K.H. Humic Matter in Soil and the Environment Principles and Controversies; Marcel Dekker Inc.:
New York, NY, USA, 2003.
40. Her, N.G.; Amy, G.; Sohn, J.; Gunten, U. UV absorbance ratio index with size exclusion chromatography (URI-SEC) as an NOM property indicator.Aqua2008,57, 35–46. [CrossRef]
41. Guo, M.; Chorover, J. Transport and fractionation of DOM in soil columns. Soil Sci. 2003,168, 108–118.
[CrossRef]
42. Nadi, M.; Sedaghati, E.; Fuleky, G. Evaluation of humus quality of forest soils with two extraction methods.
Int. J. For. Soil Eros.2012,2, 124–127.
43. Zotarelli, L.; Alves, B.J.R.; Urquiaga, S.; Torres, E.; dos Santos, H.P.; Paustian, K.; Boddey, R.M.; Six, J. Impact of tillage and crop rotation on aggregate-associated carbon in two oxisols. Soil Sci. Soc. Am. J.2005,69, 482–491. [CrossRef]
44. Six, J.; Conant, R.T.; Paul, E.A.; Paustian, K. Stabilization mechanisms of soil organic matter: Implications for C-saturation of soils.Plant Soil2002,241, 155–176. [CrossRef]
45. Lal, R. Soil carbon sequestration to mitigate climate change.Geoderma2004,123, 1–22. [CrossRef]
46. Sleutel, S.; De Neve, S.; Németh, T.; Tóth, T.; Hofman, G. Effect of manure and fertilizer application on the distribution of organic carbon in different soil fractions in long-term field experiments.Eur. J. Agron.2006, 25, 280–288. [CrossRef]
47. Angst, G.; Kögel-Knabner, I.; Kirfel, K.; Hertel, D.; Mueller, C.W. Spatial distribution and chemical composition of soil organic matter fractions in rhizosphere and non-rhizosphere soil under European beech (Fagus sylvaticaL.).Geoderma2016,264, 179–187. [CrossRef]
48. Panettieri, M.; Rumpel, C.; Dignac, M.F.; Chabbi, A. Does grassland introduc-tion into cropping cycles affect carbon dynamics through changes of allocation of soil organic matter within aggregate fractions?
Sci. Total Environ.2017,576, 251–263. [CrossRef] [PubMed]
49. Six, J.; Paustian, K.; Elliott, E.T.; Combrin, C. Soil Structure and Organic Matter: I. Distribution of Aggregate-Size Classes and Aggregate-Associated Carbon.Soil Sci. Soc. Am. J.2000,64, 681–689. [CrossRef]
50. Beare, M.H.; Hendrix, P.F.; Coleman, D.C. Water-Stable Aggregates and Organic Matter Fractions in Conventional- and No-Tillage Soils.Soil Sci. Soc. Am. J.1994,58, 777–786. [CrossRef]
51. Manzoni, S.; Porporato, A. Soil carbon and nitrogen mineralization: Theory and models across scales.
Soil Biol. Biochem.2009,41, 1355–1379. [CrossRef]
© 2018 by the authors. Licensee MDPI, Basel, Switzerland. This article is an open access article distributed under the terms and conditions of the Creative Commons Attribution (CC BY) license (http://creativecommons.org/licenses/by/4.0/).

![Figure 1. (A) Location of the study area (solid red rectangle); (B) Land use of the study site in the 1860s (Arcanum Ltd.; after [31]); 1: forest; 2: arable; 3: orchard; 4: vineyard; (C) Land use of the study site in 2014 (Google Earth) NF: natural forest](https://thumb-eu.123doks.com/thumbv2/9dokorg/1420150.120199/4.892.264.629.133.379/figure-location-rectangle-arcanum-orchard-vineyard-google-natural.webp)
![Figure 4. Carbon saturation values of the soil under three different land-use conditions at Szentgyörgyvár research station according to Equation (1) [8]](https://thumb-eu.123doks.com/thumbv2/9dokorg/1420150.120199/6.892.326.569.291.529/figure-saturation-different-conditions-szentgyörgyvár-research-according-equation.webp)