Article
Effects of Environmental Drivers and Agricultural Management on Soil CO 2 and N 2 O Emissions
Márton Dencs ˝o1 ,Ágota Horel1,* , Igor Bogunovic2 and Eszter Tóth1
Citation:Dencs˝o, M.; Horel, Á.;
Bogunovic, I.; Tóth, E. Effects of Environmental Drivers and Agricultural Management on Soil CO2and N2O Emissions.Agronomy 2021,11, 54. http://doi.org/10.3390/
agronomy11010054
Received: 24 October 2020 Accepted: 25 December 2020 Published: 29 December 2020
Publisher’s Note: MDPI stays neu- tral with regard to jurisdictional claims in published maps and institutional affiliations.
Copyright:© 2020 by the authors. Li- censee MDPI, Basel, Switzerland. This article is an open access article distributed under the terms and conditions of the Creative Commons Attribution (CC BY) license (https://creativecommons.org/
licenses/by/4.0/).
1 Institute of Soil Sciences and Agricultural Chemistry, Centre for Agricultural Research, Herman O. St. 15, 1022 Budapest, Hungary; dencso.marton@atk.hu (M.D.); toth.eszter@atk.hu (E.T.)
2 Faculty of Agriculture, University of Zagreb, Svetošimunska cesta 25, 10000 Zagreb, Croatia;
ibogunovic@agr.hr
* Correspondence: horel.agota@atk.hu
Abstract: Understanding the roles of natural drivers and anthropogenic activities in greenhouse gas (GHG) emissions of arable fields is crucial for adopting the most appropriate agricultural man- agement. This study investigated the effect of two tillage treatments of mouldboard ploughing (MP) and no-tillage (NT), and the environmental factors (soil water content and temperature, car- bon content and nitrogen forms) on soil carbon dioxide (CO2) and nitrous oxide (N2O) emissions.
The research was conducted on chernozem soil under winter wheat cultivation. Besides field moni- toring, several laboratory experiments took place to examine the effects of environmental drivers and fertilization management on soil GHG emissions. We observed no significant difference between the CO2emission of MP and NT during a full year period. Nevertheless, significant differences were found in the sub-periods (more particularly during vegetation and then after harvest). NT had higher CO2emission than MP in all laboratory experiments (p <0.001) and in the after harvest period of the field trial, measured on bare soil (p <0.0001). NT had significantly higher N2O emission both under laboratory (p <0.0001) and field conditions (p <0.0081). Different fertilization showed no distinguishable effect on N2O emission in the laboratory. This study confirms that N2O emission of the arable field depended more on soil water content than soil temperature, and vice-versa for CO2emission.
Keywords:tillage experiment; CO2emission; N2O emission; soil water content; fertilization
1. Introduction
Although the importance of carbon dioxide (CO2) in climate change is well known, it remains in the focus of research interest due to its role in the biosphere and the global ecosystem. More recently however the function of nitrous oxide (N2O) emission appears as a new challenge despite the fact that N2O has minor concentration in the atmosphere compared to CO2.Nonetheless, it is a more potent greenhouse gas (GHG) having 310 times higher global warming potential than CO2[1]. Moreover, N2O also contributes to the processes of ozone depletion [2].
CO2has many natural (respiration of biosphere, soils and wetlands, volcanic erup- tions) and anthropogenic sources (industry, fossil fuel combustion, transportation, agricul- ture), as well as natural sinks (forests and oceans) [3]. N2O emission might originate from natural sources such as different microbial processes of soils and wetlands, lightning in the troposphere or anthropogenic sources like industry and agriculture, fuel and biomass combustion. There are a number of natural sinks of N2O, like photochemical processes in the stratosphere [3].
Soil CO2emission has several natural drivers, such as soil temperature (Ts), soil wa- ter content (SWC), soil carbon content (TC) and biosphere (e.g., root respiration, micro, mezzo and macro fauna) [4]. N2O emission of soils is mainly governed by soil climate like SWC, Ts, soil chemistry and microbial processes such as nitrification or denitrification.
Agronomy2021,11, 54. https://doi.org/10.3390/agronomy11010054 https://www.mdpi.com/journal/agronomy
N2O emission has great temporal and spatial variability [5], thus its measurement is more uncertain than that of CO2emission that usually has well-defined annual patterns [6]. N2O emission variations can be examined especially after heavy rain events or during long- lasting wet periods and after thaws [7]. There are contradictions and gaps in our recent knowledge on this topic [8], hence further research should specify the effect of different environmental factors such as SWC and Ts on soil CO2and N2O emission. Elevated Ts and SWC might influence soil carbon and nitrogen cycle via microbiological processes, thus higher CO2and N2O emissions can occur under such circumstances [9–11]. High SWC is regarded as a facilitating factor of elevated N2O emissions, although increased emissions do not necessarily occur under high moisture circumstances [12]. After fertiliza- tion, immense rainfalls can induce N2O emission peaks [12]. Therefore, nutrient supply combined with precipitation might affect N2O emission. Although during winter and spring thaws elevated N2O emissions are probable [12,13] they do not necessarily occur:
fertilization and available nitrogen sources also influence this phenomenon [12]. Besides N2O emissions, CO2emission peaks can be also observed during fall and winter thaws [13].
It is important to note, however, that N2O fluxes depend more on air and soil surface (5 cm depth) temperature than on deeper soil (25 cm depth) temperature during thaw events, while CO2fluxes have similar temperature dependency at both surface and sub-surface layers [13].
GHG emissions induced by agricultural production participate with 10–12% of global anthropogenic GHG emission [14], which compels scientists to investigate this topic in specific soil and environmental conditions. Agricultural activities like soil management (e.g., tillage or fertilization practices) affect CO2and N2O emissions [15–17] but contradic- tions prevail regarding the effect of tillage and minimum or no-tillage practices on GHG emissions of soils. The effects of different tillage methods on CO2emission are highly dependent on the timing of measurements. CO2emission measurements performed just after tillage operation show much higher values in the ploughing plots than in the no-tilled ones [18], as aeration provides optimal conditions for more intensive microbial activities.
By contrast, the changes in CO2emissions, affected by different tillage methods, are not so evident on the long-term scale. Most of the experiments regarding the long-term effect of ploughing on soil GHG emission compares the collected data to no tillage or reduced tillage findings. Some studies report higher CO2emission in ploughing [19–22], while others find higher emission in reduced or no-tillage treatments [23–25]. Still others do not report significant differences in the emission of conventional and no-tillage treatments [26,27].
Several investigations report higher N2O emissions for minimum or no-tillage treatments compared to tilled fields [20,25,26,28–30], while other studies conclude with opposite findings [21,31–33], or report no significant differences [34]. Mineral [35–38] and organic fertilizer [36–39] management influences CO2and N2O emission of arable fields, especially in a couple of days after fertilizer application. Fertilization affects soil parameters such as SWC, microbial community, and soil nutrient contents. Available C and N forms, and the C/N ratio are key factors of GHG emissions. The application of organic and mixed (organic and mineral) fertilizer treatments can result in a higher CO2emission of soils [40]. At the same time the effects of nitrogen-based fertilizers without organic matter addition on soil emissions are not evident, since they can reduce CO2emission on a long term [41]. Mineral fertilizers might enhance N2O emission in the short- term, but organic treatments might enhance emissions in the long-term [42]. Even the type of nitrogen fertilizer influences N2O production, as the emissions tend to be higher after NH4+-based mineral fertilizer treatments than after NO3−based ones [43].
Due to incomplete knowledge about N2O emissions of soils, based on works in both field and laboratory measurements, developing or improving models can be considered as essential to fill gaps.
The aim of this study is to investigate the effects of two tillage methods—the mould- board ploughing (MP) and the no-tillage (NT)—on CO2and N2O emissions on a Central European arable field. We hypothesized that tillage causes differences in SWC and Ts,
and this consequently manifests in differences in soil CO2and N2O emissions. Besides field investigations, we performed several laboratory experiments to further explore the main governing factors of GHG emissions, i.e., SWC, Ts, and fertilizer amount.
2. Materials and Methods 2.1. Introduction of Field Trial
The study site is a long-term (>18 years) tillage experiment at Szent István University’s Józsefmajor Experimental and Training Farm, Heves County, Hungary (47 41031.700N 19 36036.100E, 110 m a.s.l). The soil is Endocalcic loamic chernozem [44], which is a dominant soil type in the region of the study. The climate is typical continental type with 560 mm average annual precipitation and 10.3◦C mean annual temperature. The experiment was set up in 2002 and consists of six different tillage treatments (mouldboard ploughing-(MP), no- tillage (NT), disk tillage, loosening, shallow and deep cultivation), in a randomized design.
For the purpose of this study, we investigated the MP and NT treatments. Each tillage treatment had an area of 10×105 m in four replicates. In the experiment, crop rotation and adaptive fertilization were used annually. After harvest plant residuals were left on the surface as mulch, and straw was mixed with the soil during tillage operations. The sown crop in season 2018/2019 was winter wheat (Triticum aestivum), and the results of emission measurements of the year 2019 are introduced in this article. The management events and the applied N fertilization doses during the last 5 years of the experiment are summarized in Table1.
Table 1.Management events and the applied fertilization doses between 2014–2019 [45] (note: weed management is not included).
Year Crop Type Date of Fertilization Applied N Fertilizer Doses Date of Sowing Date of Harvest Date of Tillage
2015 Winter wheat (Triticum aestivumL.)
07/10/2014 28.5 kg ha−1
08/10/2014 08/09/2015 02/10/2014
16/04/2015 35 kg ha−1
29/05/2015 15 kg ha−1
2016 Maize
(Zea maysL.)
28/10/2015 42 kg ha−1
18/04/2016 24/10/2016 28/10/2015
16/04/2016 72 kg ha−1
2017 Winter oat (Avena sativaL.)
27/10/2016 24 kg ha−1
01/11/2016 12/07/2017 28/10/2016
03/03/2017 100 kg ha−1
2018 Soy
(Glycine max) 20/03/2018 60 kg ha−1 26/04/2018 17/09/2018 11/09/2017
2019 Winter wheat (Triticum aestivumL.)
10/10/2018 20 kg ha−1
10/10/2018 18/07/2019 10/10/2018
11/02/2019 30 kg ha−1
2.2. Greenhouse Gas (GHG) Emission Measurements—Laboratory Experiments
To investigate the underlying processes of GHG emissions in a more controlled en- vironment, we set up the following three different laboratory experiments. Detailed information is presented in Tables2and3.
(i) In the Tillage experiment we examined the effect of the two tillage methods (MP, NT) on GHG emission under constant air temperature. For the investigations, we collected samples from MP and NT treatments and one fertilizer dose of 80 kg ha−1N (MP80, NT80) was applied besides non-fertilized control (MP0, NT0). Calcium ammonium nitrate (CAN) was used as fertilizer. SWC was constant in the first part of the experiment and then columns were left to air dry, which enabled us to study the SWC-dependency of GHG emission.
(ii) In the Fertilizer experiment we examined the effect of different fertilizer doses of 80 kg ha−1N (MP80, NT80) and 160 kg ha−1N (MP160, NT160) on the GHG emissions of MP and NT under constant air temperature. In the Fertilizer experiment, the initial field SWC was maintained in the first part of the experiments, then a higher SWC was used in the second part of this investigation.
(iii) In the Temperature dependency experiment we investigated the effect of Ts on GHG emissions of MP and NT under two constant SWC and fertilization conditions.
The laboratory experiments were implemented by the following methodology: we col- lected undisturbed soil cores (d = 10.5 cm, h = 10.0 cm) from the upper 10 cm of MP and NT treatments. We inserted plastic tubes (d = 10.5 cm, h = 20.0 cm) into the soil and sealed them in the bottom after sampling. During the laboratory measurements, the top of these columns was also sealed to create an incubation chamber, which enabled us to attach these sealed chambers to a cavity ring down spectrometer (CRDS) multi-gas anal- yser for measuring CO2and N2O emissions. Each experiment started after a 2-day long pre-incubation period. We maintained SWC on the initial field value for the first part of the experiment until a steady state GHG emission occurred. We did not change the initial SWC of the samples, therefore SWC was higher in NT than in MP treatment in all laboratory experiments imitating field conditions (Table2).
The air temperature was constant (21 or 27◦C depending on the experiment) during the investigations (Table2) except for the Ts dependency experiment, where investigations were performed at 4, 10, 20 and 30◦C (Table3).
In all laboratory experiments, we measured GHG emissions daily during the first week, then two times weekly during the rest of the experimental duration (Figure1).
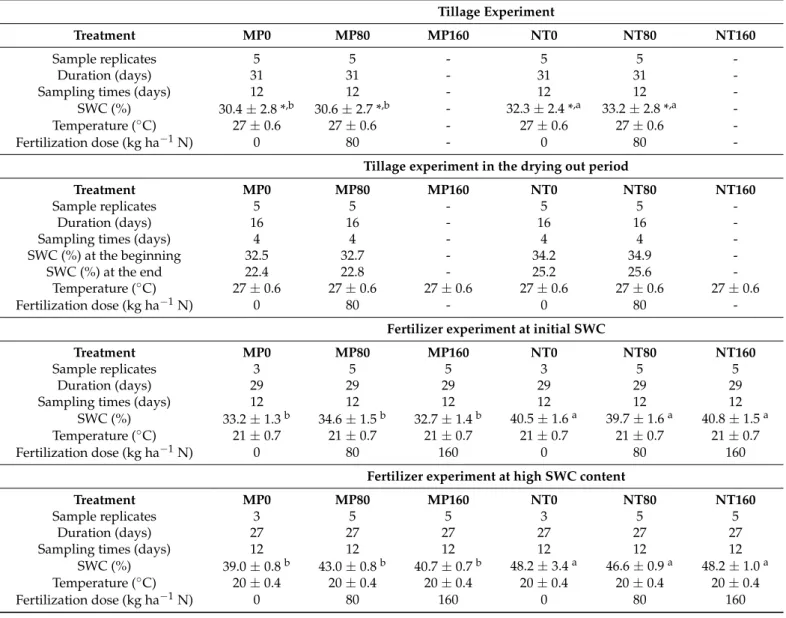
Table 2.Details of the Tillage and Fertilizer soil column experiments.
Tillage Experiment
Treatment MP0 MP80 MP160 NT0 NT80 NT160
Sample replicates 5 5 - 5 5 -
Duration (days) 31 31 - 31 31 -
Sampling times (days) 12 12 - 12 12 -
SWC (%) 30.4±2.8 *,b 30.6±2.7 *,b - 32.3±2.4 *,a 33.2±2.8 *,a -
Temperature (◦C) 27±0.6 27±0.6 - 27±0.6 27±0.6 -
Fertilization dose (kg ha−1N) 0 80 - 0 80 -
Tillage experiment in the drying out period
Treatment MP0 MP80 MP160 NT0 NT80 NT160
Sample replicates 5 5 - 5 5 -
Duration (days) 16 16 - 16 16 -
Sampling times (days) 4 4 - 4 4 -
SWC (%) at the beginning 32.5 32.7 - 34.2 34.9 -
SWC (%) at the end 22.4 22.8 - 25.2 25.6 -
Temperature (◦C) 27±0.6 27±0.6 27±0.6 27±0.6 27±0.6 27±0.6
Fertilization dose (kg ha−1N) 0 80 - 0 80 -
Fertilizer experiment at initial SWC
Treatment MP0 MP80 MP160 NT0 NT80 NT160
Sample replicates 3 5 5 3 5 5
Duration (days) 29 29 29 29 29 29
Sampling times (days) 12 12 12 12 12 12
SWC (%) 33.2±1.3b 34.6±1.5b 32.7±1.4b 40.5±1.6a 39.7±1.6a 40.8±1.5a
Temperature (◦C) 21±0.7 21±0.7 21±0.7 21±0.7 21±0.7 21±0.7
Fertilization dose (kg ha−1N) 0 80 160 0 80 160
Fertilizer experiment at high SWC content
Treatment MP0 MP80 MP160 NT0 NT80 NT160
Sample replicates 3 5 5 3 5 5
Duration (days) 27 27 27 27 27 27
Sampling times (days) 12 12 12 12 12 12
SWC (%) 39.0±0.8b 43.0±0.8b 40.7±0.7b 48.2±3.4a 46.6±0.9a 48.2±1.0a
Temperature (◦C) 20±0.4 20±0.4 20±0.4 20±0.4 20±0.4 20±0.4
Fertilization dose (kg ha−1N) 0 80 160 0 80 160
Small letters indicate significant differences between soil water content (SWC) (* drying out period is included). Different fertilizer doses:
MP 0, 80, 160; NT 0, 80, 160 kg ha−1in mouldboard ploughing (MP) and no-tillage (NT), respectively.
Table 3.Details of the Temperature dependency soil column experiments.
Temperature Dependency Experiment at Initial SWC
Treatment MP0 NT0 MP0 NT0 MP0 NT0 MP0 NT0
Temperature (◦C) - 10 10 20 20 30 30
Sample replicates - 5 5 5 5 5 5
Sampling times (days) - 1 1 1 1 1 1
SWC (%) - 33.9±0.4b 39.6±0.3a 33.9±0.4b 39.6±0.3a 33.9±0.4b 39.6±0.3a
Fertilization dose (kg ha−1N) - 0 0 0 0 0 0
Temperature dependency experiment at high SWC
Treatment MP0 NT0 MP0 NT0 MP0 NT0 MP0 NT0
Temperature (◦C) - 10 10 20 20 30 30
Sample replicates - 5 5 5 5 5 5
Sampling times (days) - 1 1 1 1 1 1
SWC (%) - 43.3±0.4b 46.7±0.4a 43.3±0.4b 46.7±0.4a 43.3±0.4b 46.7±0.4a
Fertilization dose (kg ha−1N) - 0 0 0
Temperature dependency experiment at high SWC with fertilization
Treatment MP80 NT80 MP80 NT80 MP80 NT80 MP80 NT80
Temperature (◦C) 4◦C 4◦C 10◦C 10◦C 20◦C 20◦C 30◦C 30◦C
Sample replicates 5 5 5 5 5 5 5 5
Sampling times (days) 1 1 1 1 1 1 1 1
SWC (%) 44.5±0.5b 47.6±0.6a 44.5±0.5b 47.6±0.6a 44.5±0.5b 47.6±0.6a 44.5±0.5b 47.6±0.6a
Fertilization dose (kg ha−1N) 80 80 80 80 80 80 80 80
Small letters indicate significant differences between soil water content (SWC). Different fertilizer doses: MP 0, 80, 160; NT 0, 80, 160 kg ha−1N in mouldboard ploughing (MP) and no-tillage (NT), respectively.
Agronomy 2021, 11, x FOR PEER REVIEW 6 of 22
Figure 1. The course of CO2 emission in the laboratory experiments: (a) tillage experiment and (b) fertilizer experiment. Different fertilizer doses: MP0, 80, 160; NT 0, 80, 160 kg ha−1 in mouldboard ploughing (MP) and no‐tillage (NT), respectively. SWC—soil water content.
2.3. GHG Emission Measurements—Field Experiment
Regular CO
2 emission measurements were performed in seven replicates from 2013in both MP and NT treatments [46]. In addition, we started N
2O measurements in 2019.
For the present study we selected the whole year dataset for CO
2 including vegetation andafter‐harvest period and a half‐year dataset for N
2O emission including the after‐harvest period (Table 4). We implemented CO
2 measurements weekly and N2O measurements on a weekly to monthly basis with 7 (CO
2) and 3 (N
2O) replicates per treatment. To determine GHG emissions, we applied two in situ gas analysers, an infrared gas analyser (IR) for
CO
2 emission and a CRDS multi gas analyser for N2O emission. The measurements by the
different instruments were taken at the same time, in close vicinity. The GHG measurements were based on the dynamic chamber method [47–49], where chambers were not automatic but were placed manually. We set the incubation time of the chambers to 2 and 15 min for CO
2 and N2O, respectively. GHG fluxes were calculated by quadratic (CO
2) and linear (N
2O) estimations. To investigate the environmental drivers of GHG emissions, we monitored SWC, Ts at every GHG measurement points. Sampling strategy and basic environmental parameters are presented in Table 4.
Table 4. Sampling strategy and basic environmental parameters of the field experiment with small letters indicating significant differences between soil water content (SWC) of the treatments.
Tillage treatments: MP: mouldboard ploughing, NT: no‐tillage. Ts—soil temperature.
Investigated
Period Treatment
Sample Number in
a Day
Number of Sampling
Days
Total Number of
Samples
Duration of the Period
(dd/mm)
SWC (%) Ts (°C) Figure 1.The course of CO2emission in the laboratory experiments: (a) tillage experiment and (b) fertilizer experiment.
Different fertilizer doses: MP0, 80, 160; NT 0, 80, 160 kg ha−1in mouldboard ploughing (MP) and no-tillage (NT), respectively.
SWC—soil water content.
2.3. GHG Emission Measurements—Field Experiment
Regular CO2emission measurements were performed in seven replicates from 2013 in both MP and NT treatments [46]. In addition, we started N2O measurements in 2019.
For the present study we selected the whole year dataset for CO2including vegetation and after-harvest period and a half-year dataset for N2O emission including the after-harvest period (Table4). We implemented CO2measurements weekly and N2O measurements on a weekly to monthly basis with 7 (CO2) and 3 (N2O) replicates per treatment. To determine GHG emissions, we applied two in situ gas analysers, an infrared gas analyser (IR) for CO2emission and a CRDS multi gas analyser for N2O emission. The measurements by the different instruments were taken at the same time, in close vicinity. The GHG measurements were based on the dynamic chamber method [47–49], where chambers were not automatic but were placed manually. We set the incubation time of the chambers to 2 and 15 min for CO2and N2O, respectively. GHG fluxes were calculated by quadratic (CO2) and linear (N2O) estimations. To investigate the environmental drivers of GHG emissions, we monitored SWC, Ts at every GHG measurement points. Sampling strategy and basic environmental parameters are presented in Table4.
Table 4. Sampling strategy and basic environmental parameters of the field experiment with small letters indicating significant differences between soil water content (SWC) of the treatments. Tillage treatments: MP: mouldboard ploughing, NT: no-tillage. Ts—soil temperature.
Investigated Period Treatment Sample Number in a Day
Number of Sampling Days
Total Number of Samples per Treatment
Duration of the Period
(dd/mm) SWC (%) Ts (◦C)
Whole year period
MP 7 for CO2
3 for N2O
29 for CO2
8 for N2O
203 for CO2
24 for N2O 18/02–18/12 - 1.2–23.9
NT 7 for CO2
3 for N2O
29 for CO2
8 for N2O
203 for CO2
24 for N2O 18/02–18/12 - 1.0–25.8
Vegetation period
MP 7 for CO2
0 for N2O
13 for CO2
0 for N2O
91 for CO2
0 for N2O 18/02–01/08 - 1.2–23.4
NT 7 for CO2
0 for N2O
13 for CO2
0 for N2O
91 for CO2
0 for N2O 18/02–01/08 - 1.0–25.0
After harvest period
MP 7 for CO2
3 for N2O
16 for CO2
8 for N2O
112 for CO2
24 for N2O 01/08–22/11 34.9±5.5b 5.4–23.9
NT 7 for CO2
3 for N2O
16 for CO2
8 for N2O
112 for CO2
24 for N2O 01/08–22/11 38.8±7.3a 5.7–25.8
2.4. Instrumentation
We used an EGM-5 (PPSYSTEMS, U.S.) in situ IR gas-analyser to determine CO2 emissions and a PICARRO G2508 CRDS multi-gas analyser (PICARRO, U.S.) to determine N2O emission of the field trial. We also used the PICARRO G2508 to determine CO2and N2O emissions during all laboratory experiments.
The measurement accuracy of EGM-5 was <1% of reference gas and the measurement range was 0–5000 ppm. In the case of the PICARRO G2508, the accuracy for raw non- smoothed data was±600 ppb for CO2and±25 ppb for N2O. The guaranteed range was 380–5000 ppm for CO2and 0.3–200 ppm for N2O.
In the field experiment we also measured the volumetric SWC of the upper 10 cm of each GHG measurement points by CAMPBELL SCIENTIFIC HYDROSENSE II SWC probe with an accuracy of 3% and a resolution of <0.05%. We determined Ts with PPSYSTEMS STP-2 soil temperature probe, which was attached to the EGM5 analyser with an accuracy of±0.3◦C at 25◦C. In the laboratory experiments, we calculated volumetric SWC from gravimetric SWC of each sample at the end of the experiments.
The leaf area index (LAI) of winter wheat were measured by an ACCUPAR LP80 cep- tometer (METERGROUP, U.S.) during ear emergence and flowering phenological phases, which refer to GS59 and GS61 in the Zadoks decimal code system, respectively [50,51].
2.5. Soil Chemical and Physical Analyses
We collected soil samples from the upper 10 cm at all N2O emission measurement times to determine the total nitrogen (Ntot), total carbon (TC), NH4+-N, and NO3−-N contents of the samples by wet chemical analyses [52]. We determined the same chemical parameters from the soil columns used in the laboratory experiments by the same methods at the end of the experiments. Sample numbers of the field experiment were 19 and 26 in total (over the after-harvest period) for MP and NT, respectively. Sample numbers of laboratory experiments’ chemical parameters can be seen in Tables2and3.
For the physical analysis, we collected three undisturbed soil cores (100 cm3) from the upper 5–10 cm layer of MP and NT. We dried the soil cores at 105◦C for 24 h, and we measured the dry weight of the samples to calculate bulk density [53].
2.6. Data Handling and Statistical Analyses
Negative CO2flux data of field measurements provided by the EGM analyser were omitted because we considered these occasions to be caused by chamber failures. Negative fluxes of CO2are a matter of debate in the scientific discussion. Negative CO2fluxes are more probable in specific areas like deserts [54], non-vegetated arid lands [55], highly alka- line soils under dry conditions [56], coastal peatlands [57], or estuary wetlands [58] than in the case of continental type arable field during summer and early fall. We used the 5 min smoothed dataset of N2O concentrations provided by the PICARRO analyser in order to eliminate the high variance of the raw concentration curve. Negative N2O fluxes were considered as zero fluxes. Arable fields can be a sink of N2O from the atmosphere under certain circumstances [59], but in our case these negative values converged to zero well, and they were below measurement uncertainty.
For the basic statistical analysis, we used GraphPad Prism version 8.4.3 for Windows, (GraphPad Software, San Diego, California U.S.). We determined the distribution of the datasets with a D’Agostino and Pearson test. We applied all data from the replicates instead of daily mean values of GHG emission, SWC and chemical comparison of laboratory and field investigations. Based on the dataset distribution we used different statistical analyses, which are presented in Table5.
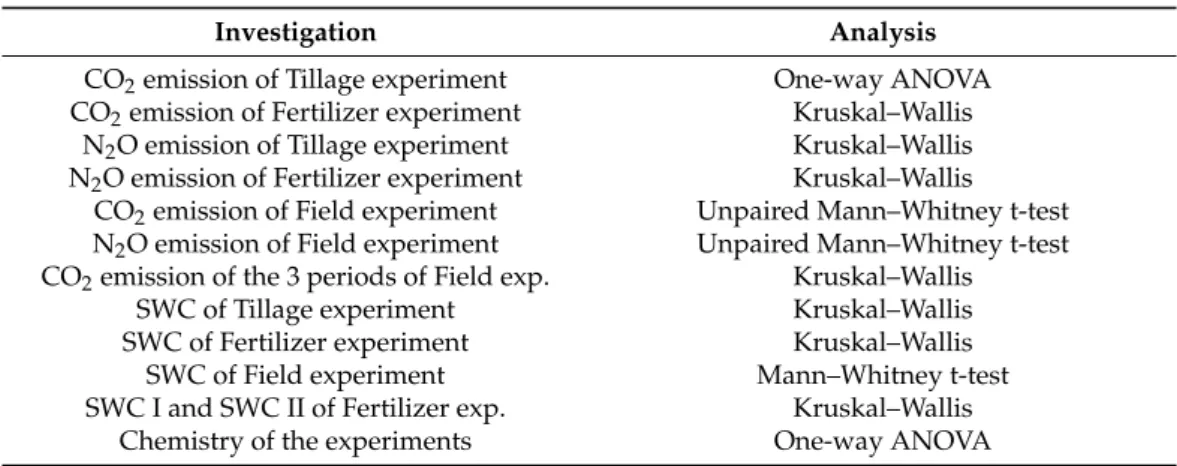
Table 5.Statistical analysis of the different experiments. ANOVA refers to analysis of variance.
Investigation Analysis
CO2emission of Tillage experiment One-way ANOVA
CO2emission of Fertilizer experiment Kruskal–Wallis N2O emission of Tillage experiment Kruskal–Wallis N2O emission of Fertilizer experiment Kruskal–Wallis
CO2emission of Field experiment Unpaired Mann–Whitney t-test N2O emission of Field experiment Unpaired Mann–Whitney t-test CO2emission of the 3 periods of Field exp. Kruskal–Wallis
SWC of Tillage experiment Kruskal–Wallis
SWC of Fertilizer experiment Kruskal–Wallis
SWC of Field experiment Mann–Whitney t-test
SWC I and SWC II of Fertilizer exp. Kruskal–Wallis
Chemistry of the experiments One-way ANOVA
We used Pearson’s correlation to find relationships of GHG emission and environmen- tal parameters. We interpreted correlations according to Schober et al. [60].
3. Results
3.1. GHG Emissions of Laboratory Experiments 3.1.1. CO2Emission
In general, under laboratory conditions, NT had higher mean CO2emissions than MP in all experiments (Table6). In the Tillage experiment the difference between CO2
emissions of MP0 and NT0 was significant (p <0.0001) and it was significant between MP80 and NT80 (p <0.0001) as well. Fertilization significantly reduced CO2emission both in the MP80 (p =0.0245) and NT80 treatments (p <0.0067) compared to non-fertilized controls (MP0 and NT0, respectively).
Table 6.Mean CO2emission (±SD) of soil column experiments.
Treatment
Mean CO2Emission (mg CO2m−2s−1) Tillage Experiment Fertilizer exp.—
Whole Period
Fertilizer exp.—
Initial SWC
Fertilizer exp.—
High SWC MP0 0.030±0.007c 0.024±0.006c 0.026±0.014b 0.022±0.006b,c NT0 0.058±0.012a 0.061±0.016a,b 0.072±0.031a 0.043±0.008a MP80 0.024±0.007d 0.022±0.004c 0.029±0.006b 0.014±0.003c NT80 0.046±0.012b 0.053±0.013b 0.072±0.038a 0.029±0.003b
MP160 - 0.018±0.005c 0.025±0.008b 0.009±0.003d
NT160 - 0.074±0.008a 0.092±0.024a 0.049±0.011a
Small letters indicate significant differences between treatments, within each experiment. Different fertilizer doses: MP 0, 80, 160; NT 0, 80, 160 kg ha−1in mouldboard (MP) ploughing and no-tillage (NT), respectively.
(Sample numbers are presented in Table2).
Similar to the findings of the Tillage experiments, NT0, NT80, NT160 had significantly higher mean CO2emissions than MP0, MP80, MP160 (p <0.0001) in the Fertilizer exper- iment. However, none of the fertilizer doses had significant effect on the CO2emission, in MP80 (p >0.9999);MP 160(p =0.1747) compared to MP0; or in NT80 (p =0.1083), NT160 (p >0.9999) compared to NT0, but there was a significant difference between NT80 and NT160 (p =0.0009)
Mean CO2emissions of NT varied in all laboratory experiments, while the mean CO2 emissions of MP had only minor variability, thus the emission of MP was more stable (Table6).
Treatments had a decreasing trend of CO2emission over time in the laboratory experi- ments, which was steeper in the case of NT compared to MP, especially in the Fertilizer experiment (Figure1).
3.1.2. N2O Emission
We found similar tendencies in the case of N2O emission as for the CO2data, the mean N2O emission of NT was higher than of MP in all laboratory experiments (Table7).
Table 7. Mean N2O emission (±SD) of laboratory experiments. Small letters indicate significant differences between treatments, within each experiment. Different fertilizer doses: MP 0, 80, 160;
NT 0, 80, 160 kg ha−1in mouldboard ploughing (MP) and no-tillage (NT), respectively. (Sample numbers are presented in Table2).
Treatment
Mean N2O Emission (µg N2O m−2s−1) Tillage Experiment Fertilizer exp.—
Whole Period
Fertilizer exp.—
Initial SWC
Fertilizer exp.—
High SWC MP0 0.003±0.002c 0.010±0.013c 0.003±0.002d 0.019±0.017d NT0 0.044±0.017a 0.263±0.148b 0.058±0.048b 0.488±0.278b MP80 0.017±0.016b 0.091±0.071c 0.002±0.001d 0.187±0.162c NT80 0.049±0.026a 0.628±0.270a 0.425±0.233a,b 0.879±0.507a,b
MP160 - 0.081±0.092c 0.006±0.003c 0.163±0.164c,d
NT160 - 1.684±2.506a 0.516±0.345a 2.987±1.984a
In the Tillage experiment, N2O emission was significantly higher (p <0.0001) in NT compared to MP treatments regardless of the fertilization doses (Table7). The 80 kg ha−1 fertilizer dose had a significant effect (p =0.0028) on N2O emission of MP80 compared to MP0, however, it had a non-significant effect (p >0.9999) in NT80 compared to NT0 (Table7).
In the Fertilizer experiment NT0, NT80, NT160 had a significantly higher (p <0.0001) N2O emission than MP0, MP80, and MP160 regardless of fertilization doses. The N2O emissions had a nonlinear response to the different fertilizer rates in NT, where NT160 showed the highest mean N2O emission. There were significant differences between the mean N2O emission of NT0 and NT80 (p =0.0065) and between NT0 and NT160 (p <0.0001).
Nevertheless, the difference was not significant between NT80 and NT160 (p >0.9999) (Table7). There was no significant effect of fertilizer additions on N2O emission for MP treatments (p >0.0523) (Table7).
The temporal course of the N2O emissions showed similarities both in the Tillage and Fertilizer experiments (Figure2). After fertilization, N2O emissions peaked in the first week, then there were declining trends in all experiments while the SWC and Ts were constant.
The N2O emissions reached a steady-state after one week (Figure2), then decreased during the drying out period (Figure2a).
Agronomy 2021, 11, x FOR PEER REVIEW 10 of 22
After N
2O emission got constant, we increased the SWC of the treatments from 33.5
± 1.0 to 40.9 ± 2.0 (avg. MP) and from 40.3 ± 0.6 to 47.7 ± 0.9 (avg. NT) during the second part of the Fertilizer experiment (Figure 2b). The N
2O emission was significantly higher under elevated SWC compared to initial SWC in all treatments (p < 0.0103). Still, elevated N
2O emissions of MP did not reach the highest emission of any measured N
2O values in the NT treatments under initial SWC, even when the SWC of MP was on the same level (Figure 2b).
Figure 2. N2O emission and soil water content (SWC) in (a) Tillage experiment and (b) in Fertilizer experiment. Different fertilizer doses: MP 0, 80, 160; NT 0, 80, 160 kg ha−1 in mouldboard
ploughing (MP) and no‐tillage (NT), respectively.
3.2. Environmental Governing Factors of GHG Emissions in Laboratory Experiments
We set a T dependency experiment under initial (field) SWC (33.9 ± 0.4 % in MP0, 39.6 ± 0.3 % in NT0), high SWC (43.3 ± 0.4 % in MP0 and 46.7 ± 0.4 in NT0), and high SWC combined with fertilization (44.5 ± 0.5 % in MP80 and 47.6 ± 0.6 % in NT80;
Table 3).
CO
2emissions of MP and NT treatments highly depended on Ts in laboratory experiments, although the correlations were not significant in all cases (Table 8).
Correlation between CO
2emission and Ts was strong in all cases but not always significant.
The N
2O emissions showed moderate to strong dependency on Ts with significance only in two cases (Table 8).
Table 8. Correlation and significance * of Ts and greenhouse gas (GHG) emissions; r2 and p‐values are indicated (Sample numbers are presented in Table 3).
Treatment Ts Dependency of CO2 Ts Dependency of N2O
MP0—initial SWC 0.97 (p = 0.1153) 0.99 (p = 0.0001) *
Figure 2.N2O emission and soil water content (SWC) in (a) Tillage experiment and (b) in Fertilizer experiment. Different fertilizer doses: MP 0, 80, 160; NT 0, 80, 160 kg ha−1in mouldboard ploughing (MP) and no-tillage (NT), respectively.
After N2O emission got constant, we increased the SWC of the treatments from 33.5±1.0 to 40.9±2.0 (avg. MP) and from 40.3±0.6 to 47.7±0.9 (avg. NT) during the second part of the Fertilizer experiment (Figure2b). The N2O emission was significantly higher under elevated SWC compared to initial SWC in all treatments (p <0.0103). Still, elevated N2O emissions of MP did not reach the highest emission of any measured N2O values in the NT treatments under initial SWC, even when the SWC of MP was on the same level (Figure2b).
3.2. Environmental Governing Factors of GHG Emissions in Laboratory Experiments
We set a T dependency experiment under initial (field) SWC (33.9±0.4 % in MP0, 39.6±0.3 % in NT0), high SWC (43.3±0.4 % in MP0 and 46.7±0.4 in NT0), and high SWC combined with fertilization (44.5±0.5 % in MP80 and 47.6±0.6 % in NT80; Table3).
CO2emissions of MP and NT treatments highly depended on Ts in laboratory exper- iments, although the correlations were not significant in all cases (Table8). Correlation between CO2emission and Ts was strong in all cases but not always significant.
Table 8.Correlation and significance * of Ts and greenhouse gas (GHG) emissions;r2andp-values are indicated (Sample numbers are presented in Table3).
Treatment Ts Dependency of CO2 Ts Dependency of N2O MP0—initial SWC 0.97 (p =0.1153) 0.99 (p =0.0001) *
MP0—high SWC 0.99 (p =0.0200) * 0.57 (p =0.4544)
MP80—high SWC 0.97 (p =0.1163) 0.81 (p= 0.0978)
NT0—initial SWC 0.99 (p =0.0062) * 0.32 (p =0.6143)
NT0—high SWC 0.97 (p =0.1166) 0.75 (p =0.3333)
NT80—high SWC and fertilization 0.91 (p= 0.0479) * 0.97 (p =0.0176) *
The N2O emissions showed moderate to strong dependency on Ts with significance only in two cases (Table8).
The SWC of the MP and NT treatments were also different during all laboratory experiments (Tables2and3), due to the initial field conditions of the treatments. In the Tillage experiment NT had a significantly higher SWC than MP regardless of fertilization (p <0.0001 both in 0 and 80 kg ha−1).
We could observe similar trends in the Fertilizer experiment as NT treatments (NT0, NT80, NT160) had significantly higher SWC than MP treatments (MP0, MP80, MP160) regardless of fertilization (p <0.0001 in all treatments). In contrast with tillage, fertilization had no significant effect on SWC neither in MP nor in NT in any experiments (p >0.9999) (Table2).
We examined the SWC dependency of GHG emissions in the second, shorter drying out period, after reaching the steady-state GHG emission phase in the Tillage experiments.
The SWC dependency of CO2emission was strong in MP0 (r2= 0.89,p =0.0589) and very strong and significant in MP80 (r2= 0.99,p =0.0020). Both control and fertilized samples of NT had moderate correlation with SWC (r2= 0.60,p =0.2277 in NT0;r2= 0.58,p =0.2360 in NT80).
Investigating the SWC dependency of N2O emission in the Tillage experiment, MP80 and NT0 samples showed very strong and significant SWC dependency (r2= 0.93,p =0.0344 andr2= 0.95,p =0.0278, respectively). The N2O emission of NT80 had a strong, but not significant correlation with SWC (r2= 0.74,p =0.1418) and MP0 had weak N2O emission during the whole measurement period, thus SWC dependency could not be interpreted (r2= 0.03,p =0.8354).
3.3. Soil Chemical Parameters of Laboratory Experiments
The main soil chemical parameters are provided in Table9for all laboratory exper- iments. Regardless of fertilization rate, all NT treatments had significantly higher Ntot
content as compared to all MP treatments in the Tillage(p <0.0137), Fertilizer (p <0.0001) and Temperature dependency (p <0.0079) experiments.
Table 9.Soil chemical parameters of the laboratory experiments.
Experiment Treatment Ntot
(%)
NH4+
(mg kg−1)
NO3−
(mg kg−1) Sample Number
Tillage
MP0 0.157±0.005b 16.45±0.29b 11.50±2.38b 5
NT0 0.238±0.010a 31.88±2.34a 30.03±9.97a 5
MP80 0.172±0.025b 19.47±6.10b 17.27±6.10a,b 5
NT80 0.227±0.038a 28.26±6.52a 35.81±14.68a 5
Fertilizer
MP0 0.145±0.007b 9.62±0.26b 11.00±1.30c 3
NT0 0.236±0.012a 14.68±0.29a 27.87±7.55c 3
MP80 0.151±0.009b 9.15±0.38b 70.68±9.18b 5
NT80 0.226±0.010a 13.41±1.37a 31.70±12.78b,c 5
MP160 0.159±0.003b 14.05±2.98b 141.83±7.21a 5
NT160 0.231±0.009a 14.19±0.43a 89.46±48.83b 5
Temperature dependence MP80 0.182±0.007b 15.96±0.56b 59.03±6.64a 5
NT80 0.245±0.012a 22.23±1.51a 45.12±13.64a 5
Small letters indicate significant differences between treatments of a single experiment, within a chemical parameter. Different fertilizer doses: MP 0, 80, 160; NT 0, 80, 160 kg ha−1in mouldboard ploughing (MP) and no-tillage (NT), respectively.
In the Tillage experiment NT0 and NT80 had significantly higher NH4+contents than MP0 (p =0.0004 andp =0.0047, respectively), or MP80 (p =0.0031 andp =0.0374, respec- tively). Fertilization had no effect on NH4+contents in MP (p =0.7332) or NT (p =0.6120) treatments. In the Fertilizer experiment NT0, NT80, NT160 and MP160 treatments had significantly higher NH4+contents compared to MP0 (p < 0.0250) and MP80 (p <0.0026), and there was no significant difference between the NH4+ content of MP0 and MP80 (p =0.9979). NH4+content of NT treatments was not significant as compared to each other (p >0.8478). Significantly higher NH4+of NT80 compared to MP80 was observed in the Temperature dependency experiment (p =0.0079; Table9).
In the Tillage experiment there were no significant differences between the NO3−
content of MP0 and MP80 (p= 0.7595) and between NT0 and NT80 (p= 0.7590), while the differences were significant between MP0 and NT0 (p= 0.0277) and between MP80 and NT80 (p= 0.0276). In the Fertilizer experiment there were significant differences (p <0.0233) between the NO3−content of all of the fertilizer doses in MP. In NT there was no significant difference (p >0.9999) in the NO3−content of NT0 and NT80, although these fertilizer treat- ments significantly differed from NT160 (p =0.0183 andp =0.0095, respectively). There was a significant difference between the NO3−content of MP and NT treatments (p =0.0211) only under 160 kg ha−1fertilization. In the Temperature dependency experiment there were no significant differences between the NO3− content of the two (MP80 and NT80) treatments (p =0.1508; Table9).
3.4. GHG Emissions of Field Experiment
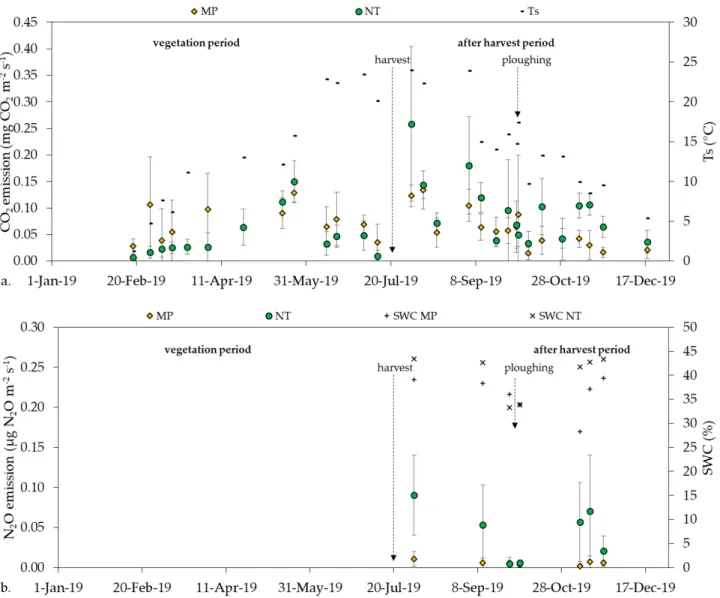
The annual course of CO2emission showed an increasing trend in the first part of the vegetation period until the end of May, then decreased during ripening till harvest in both MP and NT treatments. A secondary emission peak occurred in the after-harvest period with a decline in fall and winter (Figure3a).
The whole year investigation period was divided into two sub-periods: vegetation period, and after harvest period with no vegetation (Figure3, Table4). In the NT treatment, the after harvest period had a significantly higher mean CO2emission than the vegetation period(p <0.0001) or the whole year period (p =0.0080). Regarding MP none of the three investigated periods had significant differences as compared to each other (p= 0.4778), thus MP showed a more balanced CO2emission (Table10).
Agronomy2021,11, 54 12 of 20
Table 9. Soil chemical parameters of the laboratory experiments.
Experiment Treatment N
tot(%)
NH
4+(mg kg
−1)
NO
3−(mg kg
−1)
Sample Number
Tillage
MP0 0.157 ± 0.005
b16.45 ± 0.29
b11.50 ± 2.38
b5 NT0 0.238 ± 0.010
a31.88 ± 2.34
a30.03 ± 9.97
a5 MP80 0.172 ± 0.025
b19.47 ± 6.10
b17.27 ± 6.10
a,b5 NT80 0.227 ± 0.038
a28.26 ± 6.52
a35.81 ± 14.68
a5
Fertilizer
MP0 0.145 ± 0.007
b9.62 ± 0.26
b11.00 ± 1.30
c3 NT0 0.236 ± 0.012
a14.68 ± 0.29
a27.87 ± 7.55
c3 MP80 0.151 ± 0.009
b9.15 ± 0.38
b70.68 ± 9.18
b5 NT80 0.226 ± 0.010
a13.41 ± 1.37
a31.70 ± 12.78
b,c5 MP160 0.159 ± 0.003
b14.05 ± 2.98
b141.83 ± 7.21
a5 NT160 0.231 ± 0.009
a14.19 ± 0.43
a89.46 ± 48.83
b5 Temperature
dependence
MP80 0.182 ± 0.007
b15.96 ± 0.56
b59.03 ± 6.64
a5 NT80 0.245 ± 0.012
a22.23 ± 1.51
a45.12 ± 13.64
a5 Small letters indicate significant differences between treatments of a single experiment, within a chemical parameter. Dif‐
ferent fertilizer doses: MP 0, 80, 160; NT 0, 80, 160 kg ha
−1 in mouldboard ploughing (MP) and no‐tillage (NT), respectively.3.4. GHG Emissions of Field Experiment
The annual course of CO
2emission showed an increasing trend in the first part of the vegetation period until the end of May, then decreased during ripening till harvest in both MP and NT treatments. A secondary emission peak occurred in the after‐harvest period with a decline in fall and winter (Figure 3a).
Figure 3. (a) The annual course of CO2
emission with soil temperature (Ts)
and (b) half‐year course of N
2O with soil water content (SWC).
Figure 3.(a) The annual course of CO2emission with soil temperature (Ts) and (b) half-year course of N2O with soil water content (SWC).
Table 10. Mean values of GHG emissions divided into different periods. Small letters indicate significant differences between the different periods within a treatment. Tillage treatments: MP:
mouldboard ploughing, NT: no-tillage. (Sample numbers are presented in Table4).
Treatment Mean CO2Emission (mg m−2s−1)
whole year period vegetation period after-harvest period
MP 0.063±0.035a 0.068±0.037a 0.059±0.031a
NT 0.072±0.032b 0.051±0.022c 0.095±0.041a
NT had a slightly higher mean CO2emission than MP during the whole year pe- riod, but the difference was not significant (p =0.3933). During the vegetation period (from 18/02/19 to 01/08/19) MP had significantly higher mean CO2emission than NT (p =0.0028). In the after harvest period, where plant and root activity did not prevail, NT had a significantly higher CO2emission than MP (p <0.0001) (Table11).
Table 11.Mean values of GHG emissions divided into different periods.
Investigated Period Mean CO2Emission (mg m−2s−1)
Mean N2O Emission (µg m−2s−1)
MP NT MP NT
whole year 0.063±0.035a 0.072±0.032a - -
vegetation 0.068±0.037a 0.051±0.022b - -
after-harvest 0.059±0.031b 0.095±0.041a 0.006±0.005b 0.043±0.035a Small letters indicate significant differences between the treatments within a period. Tillage treat-ments: MP:
mouldboard ploughing, NT: no-tillage. (Sample numbers can be seen in Table4).
N2O emission data were collected from the after harvest period only, where there was no vegetation on the selected parcels. Our data showed that N2O emission had a non-specific temporal trend on the investigated arable field (Figure3b). Both the temporal variability of N2O emission and the deviation of the measurement points were higher in NT than in MP (Figure3b). Mean N2O emission was significantly higher (p= 0.0081) in NT than in MP treatment (Table11).
3.5. Environmental Governing Factors of GHG Emissions in Field Experiment
Regarding the whole year period, the correlation between Ts and CO2 emission was weak but significant (r2 = 0.27, p = 0.0043 in MP and r2 = 0.25p = 0.0067 in NT (Table12)), while during the vegetation period, the correlations were weak and non- significant (r2= 0.002,p =0.6418 in MP andr2= 0.006,p =0.4277 in NT). CO2emission significantly correlated with Ts (r2= 0.89,p <0.0001 in MP andr2= 0.45,p= 0.0018 in NT) in each treatment after harvest. N2O emission of MP slightly depended on Ts during the after harvest period. There was weak and not significant correlation between Ts and N2O emission in MP (r2= 0.30;p =0.1995) and no correlation in NT (r2= 0.03;p =0.6984).
Table 12.Environmental drivers of GHG emission and its significance*.r2values are indicated. Tillage treatments: MP:
mouldboard ploughing, NT: no-tillage. (Sample numbers are presented in Table3).
Investigated Period Treatment Ts Dependence of CO2Emission
Ts Dependence of N2O Emission
SWC Dependence of CO2Emission
SWC Dependence of N2O Emission
Whole year MP 0.27 (p =0.0043) * - - -
NT 0.25 (p =0.0067)* - - -
Vegetation period MP 0.02 (p =0.6418) - - -
NT 0.06 (p =0.4277) - - -
After harvest period MP 0.89 (p <0.0001) * 0.30 (p =0.1995) 0.00 (p =0.9044) 0.83 (p= 0.0347) * NT 0.54 (p= 0.0018) * 0.03 (p =0.6984) 0.02 (p =0.7134) 0.82 (p= 0.0399) *
According to the collected data of the field experiment SWC of NT was significantly higher than in MP (p= 0.0020; Table4). Bulk density of NT was also slightly higher than MP with 1.6±0.0 and 1.5±0.0 g cm−3, respectively. We could not observe any correla- tion between the SWC and the CO2emission during the after harvest period (r2= 0.00, p =0.9044) in MP and (r2= 0.02,p =0.7134) in NT.
N2O emission showed high dependency on SWC of the field trial. Correlation was strong and significant in both tillage treatments (r2= 0.83,p =0.0347 in MP andr2= 0.82, p =0.0399 in NT; Table12).
3.6. Soil Chemical Parameters of the Field Experiment
During the after-harvest period of the field experiment, we collected soil samples every N2O measurement day from all sampling points. The mean soil chemical parameters of the treatments are summarized in Table13.
![Table 1. Management events and the applied fertilization doses between 2014–2019 [45] (note: weed management is not included).](https://thumb-eu.123doks.com/thumbv2/9dokorg/744176.30829/3.892.52.842.602.794/table-management-events-applied-fertilization-doses-management-included.webp)