0139–3006 © 2017 Akadémiai Kiadó, Budapest DOI: 10.1556/066.2017.0007
Preliminary communication
CHARACTERIZATION OF THE EFFECT OF SHORT-TERM HIGH TEMPERATURE AND VIBRATION ON WINE BY QUANTITATIVE DESCRIPTIVE ANALYSIS AND SOLID PHASE MICROEXTRACTION-
GAS CHROMATOGRAPHY-MASS SPECTROMETRY
P. ZHAO, H. WANG and H. LI*
College of Enology, Northwest A&F University, Taicheng Road 3, 712100 Yangling. China (Received: 27 June 2017; accepted: 27 August 2017)
The effect of short-term higher ambient temperature (HT) and continuous vibration (CV) treatment was comparatively characterized by sensory evaluation and chemical analysis. Results of quantitative descriptive analysis of modifi ed frequency (MF) showed that HT causes both in red wine and white wine a decrease of fruity and fl oral characters, an unbalance of taste, and a shortness of aftertaste length. CV wine showed very close sensory characters to control in most terms evaluated. Seventy-four volatile compounds were quantitative analysed by solid phase microextraction- gas chromatography-mass spectrometry, and the principal component analysis (PCA) was conducted on the 23 volatiles of highest odour activity value (OAV). The concentrations of potential fruity and fl oral aroma attributors like isoamyl acetate, ethyl butanoate, ethyl 2-methylbutanoate, ethyl hexanoate, ethyl octanoate, β-damascenone, and linalool were lower in HT wine than that in original wine and CV wine.
Keywords: wine, higher temperature, vibration, storage, sensory evaluation, chemical analysis
Beside winemaking techniques, wine conveyance and storage also contribute to wine quality.
With the fast rise of global trade and online shopping, more wines are shipped. However, because of limited availability of refrigerated containers and the relatively high shipping charges of bottled wine, most wines are stored and shipped under bad conditions.
Higher ambient temperature or continuous vibration during shipping and storage of bottled wine were cited as the possible culprits to cause defective sensory characteristics of wine. Wine quality depends upon its composition, especially aroma-active compounds with higher concentration and lower threshold in wine. FRANCIS and co-workers (1994) reported diminished fl oral characters and increased oak, honey, and smoky attributes of Chardonnay and Semillon wines caused by heated storage (45±5 °C for 20 days). In the study of S OMERS
and POCOCK (1990), a ten-day anaerobic heat treatment (42–45 °C) of Syrah wines caused colour and phenolic composition changes, and the astringency of wine was also reduced. DE
and NOBLE (1997) heated two vintages of Chardonnay wine at 40 °C. They noticed that even 5 days could trigger aroma changes in young unoaked Chardonnay, which is 7–9 days for oaked wine. By descriptive analysis, signifi cant decrease in the fruity and fl oral-like aromas and increase in the oak, butter/vanilla, honey, tea/tobacco, and rubber aromas were found after fi fteen days of heating treatment. ROBINSON and co-workers (2010) explored the effects
* To whom correspondence should be addressed.
Phone: +86 29 87082805; fax: +86 29 87082805; e-mail: lihuawine@nwsuaf.edu.cn
of shipping conditions including three different storage temperature treatments and samples travelling in the trunk of a car on sensory attributes and volatile composition of commercial white and red wines. Both sensory and analytical data indicated that higher temperatures would cause signifi cant changes in wines. BUTZKE and co-workers (2012) made a similar conclusion that the elevated temperature wine is exposed to has a profound impact on aging reactions and sensory quality, resulting in a more aged wine compared with conventional cellar storage.
CHUNG and co-workers (2008) studied the effect of vibration on some physico-chemical characteristics of a commercial red wine. Vibrations during wine aging could result in signifi cant changes of the physico-chemical properties in bottled wine. With constant vibration, the evolution of the wine was substantially accelerated.
Oxygen (WIRTH et al., 2012; SÁENZ-NAVAJAS et al., 2014) and sul phur dioxide (RAPOSO et al., 2016) were able to infl uence the chemical and sensory properties of wine during bottle storage. There is no literature indicating that oxygen and sulphur dioxide could change the characteristics of wine during a short time of bottle storage.
The objective of this study was to confi rm the infl uence of excessive ambient temperature and vibration on the sensory characters and chemical attributes, and especially on volatile compounds of wine. Besides, the main correlations between change of chemical composition and changes of sensory properties were to be verifi ed.
1. Materials and methods
1.1. Wines
Commercial dry white wine (Chardonnay, vintage 2012, corked) and dry red wine (Cabernet Sauvignon, vintage 2012, corked) were purchased from wine cellars. All wine samples involved in this study were from the same lot and kept unopened and stored at room temperature before treatments. Ethanol content, extract, reducing sugars, titration acidity, pH, volatile acidity, total SO2, total monomeric anthocyanin, and phenols of the sample wines were analysed (data shown in supplementary table) with the methods of GB/T 15038-2006 (GB (GUO BIAO, 2006)).
1.2. Treatments
According to publications (CHUNG et al., 2008; ROBINSON et al., 2010), high temperature of 40 °C (HT) and shaker provided continuous vibration (CV) were two factors to induce changes in wine. Sample wines were sealed and put into an incubator at 40 °C for fi fteen days, labelled as TW for white wine, TR for red wine. Other samples were sealed and put in a shaker at 150 r.p.m. for fi fteen days, labelled as VW for white wine, VR for red wine. Wines put in a room with a temperature of 20±3 °C, with no vibration were regarded as control sample, labelled as CW for white wine, CR for red wine. Storage conditions in this study were dark with 60–70% relative humidity. All treatments were done in triplicates and samples were put at room temperature before sensory evaluation and chemical analysis.
1.3. Reagents and chemical standards
Chemical standards used in this study were purchased from Sigma-Aldrich (St. Louis, MO, USA), TCI America (Portland, OR, USA), EKC Inc. (Rosemont, IL, USA), and EMD Chemical Inc. (Gibbstown, NJ, USA), and their purities were >90% in all cases. Details of the compounds are shown in a supplementary table. Milli-Q quality water was obtained from a Milli-Q purifi cation system (Millipore, Boston, MA, USA). Methanol (HPLC grade), dichloromethane (HPLC grade), and acetonitrile (HPLC grade) were from EM Science (Gibbstown, NJ, USA). Standard stock solutions were prepared in methanol, except for fatty acids that were prepared in acetonitrile. All solutions were stored in dark bottles at –20 °C.
1.4. Sensory evaluation
The panel (25 experienced panellists) was recruited from students of faculties in the College.
Panellists were trained over 50 days using a ‘‘Le Nez du Vin” aroma kit. Panellists were required to identify the different sample from the presented 3 samples. The descriptive analysis was performed as described by LI and co-workers (2008). The panellists were required to score wine from the aspects of appearance, aroma, mouthfeel, and overall quality, respectively using a hundred-mark system for each term. The Quantitative Descriptive Analysis (QDA) was performed as described by TAO and co-workers (2009) to determine the most important terms describing the aroma characteristics of wine samples in this study. Red and white wines in a balanced and completed block design were presented (in triplicates) to panellists. They were required to use 5 to 6 most signifi cant terms to describe the wine aroma, mouthfeel, and taste. Panellists were also asked to score the intensity of each term using a 5-point scale. The data processed were a mixture of intensity and frequency of detection (‘‘modifi ed frequency”, MF), which was calculated with the formula proposed by TAO and co-workers (2009).
1.5. Qualitative and quantitative analysis
Main volatiles in the sample were quantitated by headspace SPME-GC-MS as described by FANG and QIAN (2006) and ZHAO and co-workers (2017). A DVB/CAR/PDMS (Divinylben- zene/Carboxen/Polydimethylsiloxane, Supelco Inc., Bellefonte, PA) fi bre was used. Com- pound separation was achieved with a ZB-wax column (30 m×0.25 mm i.d., 0.5 μm fi lm thickness, Phenomenex). Agilent 6890 gas chromatograph equipped with Agilent 5973 mass selective detector (Agilent, Santa Clara, CA) was used. Quantifi cation was achieved using selected ion monitoring. Each sample was analysed in triplicates. Standard calibration curve was prepared by spiking known amounts of standards into a 20-ml vial with 2 ml of syn- thetic wine (12% ethanol (v/v), 3.5 g l tartaric acid, pH 3.5) and 8 ml of citrate buffer (0.5 g l–1, pH 3.5, saturated with NaCl). Twenty microlitres of internal standard (50 mg l–1, 4-octanol in methanol) was added (ZHAO et al., 2017). Results were calculated with Chemstation soft- ware (v10.0, Agilent Technologies, Santa Clara, CA)
1.6. Statistical analysis
Tables and spider charts were crafted by Microsoft excel 2013. Principal component analysis (PCA) was performed on quantifi ed chemical compositions by Canoco 5.0 (Microcomputer Power Inc., Ithaca, NY, USA). ANOVA Duncan’s t test was carried out using SPSS 20.0 (SPSS Inc., Chicago, IL, USA).
2. Results and discussion
2.1. Sensory evaluations
Table 1. Statistic table of the results of triangle test
Sample combinations Right answers a X2 Level of signifi cant difference
CW & TW 17 12.01 0.1%
CW & VW 7 0.13 none
CR & TR 15 6.85 1%
CR & VR 9 0.25 none
a: Chi-square (X2) distribution, X2=([4X1-2X2]–3)2/8N, X1 and X2: correct and false answers; N: the total number of judgements
Results of the triangle test are shown in Table 1. HT treatment made both white and red wine samples taste different at 0.1% and 1% levels. No sensory character changes of white or red wine samples were observed for CV treatment. Based on scores given by 25 panellists (Fig. 1), HT treatment stressed the wine in the terms of aroma, mouthfeel, and overall quality.
CV treatment had no effect on wine quality.
Fig. 1. Bar chart of sensory evaluation scores of white (A) and red (B) wine samples A. : CW; : TW; :VW; B. : CR; : TR; : VR
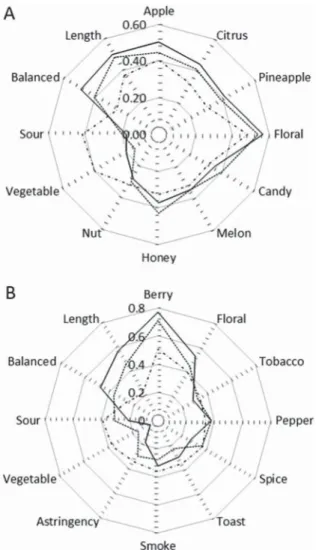
Fig. 2. Spider chart of the top 12 modifi ed frequencies (MF) of descriptors in white (A) and red (B) wine sample ____: CW; ---:SW; ……..: RW; ____: CR; ---:SR; ……..: RR
According to the results of QDA and MF, 12 terms were drafted to describe the sensory attributes of wine samples (Fig. 2). For control white wine, fl oral, apple, length, balanced terms were detected as the most important attributes. After HT treatment, vegetable and sour terms were given higher values, fl oral and apple terms lower. VW was found closer to the control by the sensory terms. For red wine samples, blackcurrant, blackberry, blueberry, raspberry, etc. descriptors were grouped into the berry term. As shown in Figure 2B, terms berry, length, fl oral, balanced, and pepper were rated as top sensory terms in CR. Terms of vegetable, sour, and astringency presented higher MF values in TR; terms berry, fl oral, balanced, and length terms received lower MF values. VR sample was given lower values at terms fl oral, smoke, balanced, length, and toast, higher in astringency, sour, and spice.
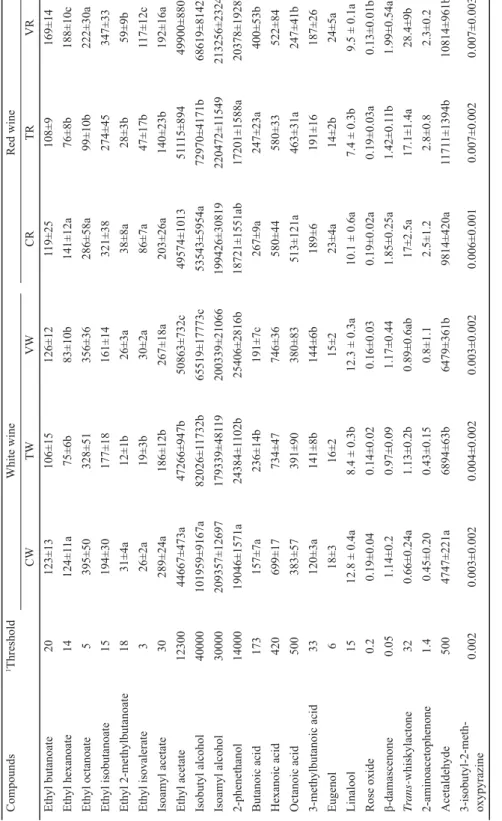
Table 2. Concentrations of volatile compounds quantitated in wine samples (in μg l–1, mean ± SD) with odour activity values (OAV)>0.5 Compounds1ThresholdWhite wineRed wine CWTWVWCRTRVR Ethyl butanoate20123±13106±15126±12119±25108±9169±14 Ethyl hexanoate14124±11a75±6b83±10b141±12a76±8b 188±10c Ethyl octanoate5395±50328±51356±36286±58a99±10b 222±30a Ethyl isobutanoate15194±30177±18161±14321±38274±45347±33 Ethyl 2-methylbutanoate1831±4a12±1b26±3a38±8a28±3b 59±9b Ethyl isovalerate326±2a19±3b30±2a86±7a47±17b117±12c Isoamyl acetate30289±24a186±12b267±18a203±26a140±23b192±16a Ethyl acetate1230044667±473a47266±947b50863±732c49574±101351115±89449900±880 Isobutyl alcohol40000101959±9167a82026±11732b65519±17773c53543±5954a72970±4171b68619±8142b Isoamyl alcohol30000209357±12697 179339±48119200339±21066199426±30819220472±11549213256±23249 2-phenethanol1400019046±1571a24384±1102b25406±2816b18721±1551ab17201±1588a20378±1928b Butanoic acid173157±7a236±14b191±7c267±9a247±23a400±53b Hexanoic acid420699±17734±47746±36580±44580±33522±84 Octanoic acid500383±57391±90380±83513±121a463±31a247±41b 3-methylbutanoic acid33120±3a141±8b144±6b189±6191±16187±26 Eugenol618±316±215±223±4a14±2b24±5a Linalool1512.8 ± 0.4a8.4 ± 0.3b12.3 ± 0.3a10.1 ± 0.6a7.4 ± 0.3b9.5 ± 0.1a Rose oxide0.20.19±0.04 0.14±0.020.16±0.030.19±0.02a0.19±0.03a0.13±0.01b β-damascenone0.051.14±0.20.97±0.091.17±0.441.85±0.25a1.42±0.11b1.99±0.54a Trans-whiskylactone320.66±0.24a1.13±0.2b0.89±0.6ab17±2.5a17.1±1.4a28.4±9b 2-aminoacetophenone1.40.45±0.200.43±0.150.8±1.12.5±1.22.8±0.82.3±0.2 Acetaldehyde5004747±221a6894±63b6479±361b9814±420a11711±1394b10814±961b 3-isobutyl-2-meth- oxypyrazine0.0020.003±0.0020.004±0.0020.003±0.0020.006±0.0010.007±0.0020.007±0.003 1: Odour threshold of the volatiles were presented in μg l–1, measured in model wine, water/ethanol (90/10, w/w) unless otherwise indicated, referenced from literature (GUTH, 1997; FERREIRA et al., 2000; LÓPEZ et al., 2002; LI et al., 2008; PARKER et al., 2012). 2: Different letters within rows indicate statistical differences by Duncan test (P<0.05)
The observed results of sensory analysis above were supported by other chemists. In the research of DE and NOBLE (1997), they found that younger unoaked Chardonnays only needed fi ve days of elevated temperature (40 °C) storage to present a signifi cant difference in aroma in triangle tests. Similar results were obtained by OWENS and co-workers (1998).
2.2. Chemical analysis
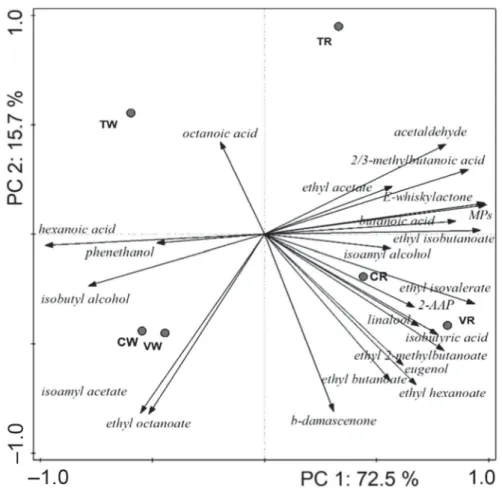
The selected 74 volatile compounds in sample wines were quantifi ed, and the odour active values (OAV, the ratio of concentration data and odour threshold) were calculated. As shown in Table 2, a concentration decrease of ethyl esters of linear fatty acid derivatives and branched acid derivatives in HT treatment sample was observed in both white and red wine samples. Especially ethyl butanoate, ethyl hexanoate, ethyl octanoate, ethyl 2-methylbutanoate, and ethyl isovalerate, which have low odour threshold, contributed to the fruity attributors of wine. Among the quantifi ed aroma compounds, 23 volatiles were with OAV≥0.5. They were analysed by PCA according to their concentrations. The bi-plot (Fig. 3) revealed 88.2% of total variance (PC1 and PC2 contributing 72.5% and 15.7%, respectively). White wine samples CW, VW, and TW were located in the second and third quadrant, and red wine sample CR, VR, and TR were located in the fi rst and fourth quadrants.
Fig. 3. PCA biplot of chemical composition with OAV≥0.5 in wine sample
Compared to CW and VW, TW showed lower correlation of isoamyl acetate, ethyl butanoate, ethyl 2-methylbutanoate, ethyl hexanoate, ethyl octanoate, etc. esters (fruity-like odour), and β-damascenone (maple syrup and tobacco like odour), linalool (citrus and fl oral like odour), eugenol (violet and spice like odour), etc., which were potential high aroma contributors in wine. A similar trend was obtained in red wine samples. CR and VR samples were determined to have higher OAV of isoamyl alcohol (brandy like odour), 2-aminoacetophenone (grape and sweet odour), and E-whiskylactone (toast nut and creamy odour). 2-Aminoacetophenon was reported as an atypical aging off-fl avour compound, which was released from the oxidative degradation of phytohormone indole-3-acetic acid (SCHMARR
et al., 2016). The results of HT treatments observed were consistent with the work carried out by PÉREZ and co-workers (2003), WICKS (2009), and ROBINSON and co-workers (2010).
Vibration possibly led to a rapid browning of wine, an increase of the formation of ethyl carbamate (EC) (STEVENS, 1995), and other destructive oxidative reactions, which can help release glucose-bound fl avour precursors like fruity-fl oral terpenes prematurely (FRANCIS et al., 1994), due to a decline in protective free sulphur dioxide (OUGH, 1985).
3. Conclusions
The sensory evaluation in this paper revealed that heat exposure changed the organoleptic properties of wine: a weaker fruity and fl oral character, a muted and unbalanced overall perception, a shorter aftertaste length were experienced.
Chemical analysis of the major contributing volatiles demonstrated that wine samples exposed to high temperature showed signifi cantly lower concentrations of potential fruity and fl oral aroma contributors like esters, β-damascenone, and linalool. No direct effect of short time vibration on wine could be detected. Further study of the mechanism of the changes of chemical and sensory properties affected by bad storage conditions would be of great signifi cance in the future.
During the shipping and storage of wine, no heating and vibration should be allowed, as these, for even as short as 15 days, are harmful for wine quality. In the future, it would be inspiring to study whether a deliberate use of regulated storage conditions could accelerate planned wine aging.
Confl ict of interest The authors declare that they have no confl ict of interest.
*
This work was funded by the China National Science Fund (31471708).
References
BUTZKE, C.E., VOGT. E. & CHACÓN-RODRÍGUEZ, L. (2012): Effects of heat exposure on wine quality during transport and storage. J. Wine Res., 23(1), 15–25.
C HUNG, H.J., SON, J.H., PARK. E.Y., KIM, E.J. & LIM, S.T. (2008): Effect of vibration and storage on some physico- chemical properties of a commercial red wine. J. Food Compos. Anal., 21, 655–659.
DE, L.P.C. & NOBLE, A.C. (1997): Effect of storage at elevated temperatures on aroma of Chardonnay wines. Am. J.
Enol. Viticult., 48, 310–316.
FANG, Y. & QIAN, M.C. (2006): Quantifi cation of selected aroma-active compounds in Pinot noir wines from different grape maturities. J. Agr. Food Chem., 54, 8567–8573.
FERREIRA, V., LÓPEZ, R. & CACHO, J.F. (2000): Quan titative determination of the odorants of young red wines from different grape varieties. J. Sci. Food Agr., 80, 1659–1667.
FRANCIS, I.L., SEFTON, M.A. & WILLIAMS, P.J. (1994): The sensory effects of pre- or post-fermentation thermal processing on Chardonnary and Semillon wines. Am. J. Enol. Viticult., 58(8), 472–476.
GUTH, H. (1997): Quantitation and sensory studies of character impact odorants of different white wine varieties. J.
Agr. Food Chem., 45, 3027–3032.
GB (GUO BIAO) (2006): Analytical methods of wine and fruit wine. GB/T 15038. Science Press, Beijing, pp. 26.
LÓPEZ, R., AZNAR, M., CACHO, J. & FERREIRA, V. (2002): Determi nation of minor and trace volatile compounds in wine by solid-phase extraction and gas chromatography with mass spectrometric detection. J. Chromatogr. A., 966(1), 167–177.
LI, H., TAO, Y.S., WANG. H. & ZHANG, L. (2008): Impact o dorants of Chardonnay dry white wine from Changli County (China). Eur. Food Res. Technol., 227(1), 287–292.
OUGH, C.S. (1985): Some effects of temperature and SO2 on wine during simulated transport or storage. Am. J. Enol.
Viticult., 36(1), 18–22.
OWENS, C.P ., SCHLICH. P., WADA. K. & NOBLE, A.C. (1998): Using sensory and instrumental data to interpret the effect of storage at elevated temperatures on aroma of Chardonnay wines. Ann. NY. Acad. Sci., 855, 854–859.
PARKER, M., OSIDACZ, P., BALDOCK, G.A., HAYASAKA, Y., BLACK, C.A., PARDON, K. H., JEFFERY, D.W., GEUE, J.P., HERDERICH, M.J. & FRANCIS, I.L. (2012): Contribution of several volatile phenols and their glycoconjugates to smoke-related sensory properties of red wine. J. Agr. Food Chem., 60, 2629–2637.
PÉREZ-COELLO, M.S., GONZÁLEZ-VIÑAS, M.A., GARCÍA-ROMERO, E., DIAZ-MAROTO, M.C. & CABEZUDO, M.D. (2003):
Infl uence of storage temperature on the volatile compounds of young white wines. Food Control, 14(5), 301–306.
RAPOSO, R., RUIZ-MORENO, M.J., GARDE-CERDÁN, T., PUERTAS, B., MORENO-ROJAS, J.M., ZAFRILLA, P., GONZALO- DIAGO, A., GUERRERO, R.F. & CANTOS-VILLAR, E. (2016): Replacement of sulfur dioxide by hydroxytyrosol in white wine: Infl uence on both quality parameters and sensory. LWT – Food Sci. Technol., 65, 214–221.
ROBINSON, A.L., MUELLER, M., HEYMANN H, EBELER, S.E., BOSS, P.K., SOLOMON, P.S. & TRENGOVE, R.D. (2010): Effect of simulated shipping conditions on sensory attributes and volatile composition of commercial white and red wines. Am. J. Enol. Viticult., 61(3), 337–347.
SÁENZ-NAVAJAS, M.P., AVIZCURI, J.M., FERREIRA, V. & FERNÁNDEZ-ZURBANO, P. (2014): Sensory changes during bottle storage of Spanish red wines under different initial oxygen doses. Food Res. Int., 66, 235–246.
SCHMARR, H. G., KEISER, J. & KRAUTWALD, S. (2016): An improved method for the analysis of 2-aminoacetophenone in wine based on headspace solid-phase microextraction and heart-cut multidimensional gas chromatography with selective detection by tandem mass spectrometry. J. Chromatogr. A., 11, 29.
SOMERS, T.C. & POCOCK, K.F. (1990): Evolution of red wines III. Promotion of the maturation phase. Vitis, 29, 109–121.
STEVENS, D.F. (1995): Ethyl carbamate formation in wines undergoing long-term storage. MS Thesis, University of California, Davis.
TAO, Y.S., LIU, Y. Q. & LI, H. (2009): Sensory characters of Cabernet Sauvignon dry red wine from Changli County (China). Food Chem., 114, 565–569.
WICKS, M.S. (2009): Effects of simulated shipping conditions on the sensory attributes of red and white wines.
University of California, Davis. 65 pages.
WIRTH, J., CAILLÉ, S., SOUQUET, J.M., SAMSON, A., DIEVAL, J.B., VIDAL, S., FULCRAND, H. & CHEYNIER, V. (2012):
Impact of post-bottling oxygen exposure on the sensory characteristics and phenolic composition of Grenache rosé wines. Food Chem., 132, 1861–1871.
ZHAO, P.T., GAO, J.X., QIAN, M. & LI, H.(2017): Characterization of the key aroma compounds in Chinese Syrah wine by gas chromatography-olfactometry-mass spectrometry and aroma reconstitution studies. Molecules, 22(7), 1045.