ContentslistsavailableatScienceDirect
Journal of Pharmaceutical and Biomedical Analysis
jou rn al h om e p a g e :w w w . e l s e v i e r . c o m / l o c a t e / j p b a
A validated UHPLC-MS method for tryptophan metabolites:
Application in the diagnosis of multiple sclerosis
Ferenc Tömösi
a, Gábor Kecskeméti
a, Edina Katalin Cseh
b, Elza Szabó
b, Cecília Rajda
b, Róbert Kormány
c, Zoltán Szabó
a, László Vécsei
b,d, Tamás Janáky
a,∗aDepartmentofMedicalChemistry,InterdisciplinaryCentreofExcellence,UniversityofSzeged,Dómtér8,H-6720,Szeged,Hungary
bDepartmentofNeurology,InterdisciplinaryCentreofExcellence,UniversityofSzeged,Semmelweisu.6,H-6725,Szeged,Hungary
cEgisPharmaceuticalsPlc.,Keresztúriút30-38,H-1106,Budapest,Hungary
dHungarianAcademyofSciences,MTA-SZTENeuroscienceResearchGroup,Semmelweisu.6,H-6725,Szeged,Hungary
a r t i c l e i n f o
Articlehistory:
Received12December2019 Receivedinrevisedform6March2020 Accepted7March2020
Availableonline9March2020
Keywords:
Tryptophanmetabolism Derivatization
Liquidchromatography-massspectrometry DryLab®4
Validation Multiplesclerosis
a b s t r a c t
Thesimultaneousquantitativeestimationoftryptophan(TRP)anditsmetabolitesrepresentsagreat challengebecauseoftheirdiversechemicalproperties,e.g.,presenceofacidic,basic,andnonpolar functionalgroupsandtheirimmenselydifferentconcentrationsinbiologicalmatrices.Ashortultra high-performanceliquidchromatography(UHPLC)–tandemmassspectrometry(MS/MS)methodwas validatedfortargetedanalysisofTRPandits11mostimportantmetabolitesderivedviabothkynure- nine(KYN)and serotonin (SERO) pathwaysin human serumand cerebrospinalfluid (CSF):SERO, KYN,3-hydroxyanthranilicacid,5-hydroxyindoleaceticacid,anthranilicacid,kynurenicacid(KYNA),3- hydroxykynurenine(3-HK),xanthurenicacid,melatonin,picolinicacid(PICA),andquinolinicacid(QUIN).
Afterselectingthe“best”reversed-phasecolumnandorganicmodifier,DryLab®4wasusedtooptimize thegradienttimeandtemperatureinchromatographicseparation.Toachieveabsolutequantification, deuterium-labeledinternalstandardswereused.Amongallcompounds,3wereanalyzedinderivatized (butylester)forms(3-HK,PICA,andQUIN)andtheremaining9inunderivatizedforms.Validationwas performedinaccordancewiththeICHandFDAguidelinestodeterminetheintradayandinterdaypreci- sion,accuracy,sensitivity,andrecovery.TodemonstratetheapplicabilityofthedevelopedUHPLC–MS/MS method,theaforementionedmetaboliteswereanalyzedinserumandCSFsamplesfrompatientswith multiplesclerosis(multiplesclerosisgroup)andthosewithsymptomaticornoninflammatoryneurolog- icaldiseases(controlgroup).TheconcentrationofQUINdramaticallyincreased,whereasthatofKYNA slightlydecreasedinthemultiplesclerosisgroup,resultinginasignificantlyincreasedQUIN/KYNAratio andsignificantlydecreasedPICA/QUINratio.
©2020ElsevierB.V.Allrightsreserved.
Abbreviations: 3-HANA, 3-hydroxyanthranilic acid; 3-HK, 3- hydroxykynurenine; 5-HIAA, 5-hydroxyindoleacetic acid; aCSF, artificial cerebrospinal fluid;AGC, automatic gain control; ANA, anthranilicacid; CSF, cerebrospinalfluid;EDSS,expandeddisabilitystatusscale;FA,formicacid;FD, fluorescencedetector;GC,gaschromatography;HPLC,high-performanceliquid chromatography;HQC,high-levelqualitycontrol;KAT,kynurenineaminotrans- ferase;KP,kynureninepathway;KYN,l-kynurenine;KYNA,kynurenicacid;LOD, limitofdetection;LOQ,limitofquantification;LQC,low-levelqualitycontrol;MELA, melatonin;MQC,medium-levelqualitycontrol;MS/MS,tandemmassspectrome- try;PFP,pentafluorophenyl;PICA,picolinicacid;PRM,parallelreactionmonitoring;
QC,qualitycontrol;QUIN,quinolinicacid;RPC,reversed-phasechromatography;
RRMS,relapsing-remittingmultiplesclerosis; RSD,relativestandard deviation;
SERO,serotonin;SIL-IS,stableisotope-labeledinternalstandard;TRP,tryptophan;
UHPLC,ultrahigh-performanceliquidchromatography;XA,xanthurenicacid.
∗Correspondingauthor.
E-mailaddress:janaky.tamas@med.u-szeged.hu(T.Janáky).
1. Introduction
The kynurenine(KYN) pathway (KP) is themajor metabolic pathway of the essential amino acid tryptophan (TRP), which leadstotheproductionofneuroprotectiveandneurotoxiccom- pounds.Changesintheconcentrationsofneuroprotectantssuch as kynurenic acid (KYNA) and picolinic acid (PICA) have been describedindifferentdiseases,buttheexcitotoxinquinolinicacid (QUIN)andthefreeradicalgenerator3-hydroxykynurenine(3-HK) areassociatedwithdifferentneurodegenerativediseasesincluding multiplesclerosis[1].KYNAisanendogenousglutamatereceptor antagonistthataffectsallionotropicglutamatereceptorsincluding NMDA, kainate, and AMPA receptors, and it exhibits the high- estaffinityfortheNMDAreceptoranddisplaysantioxidantand freeradical-scavengingactivities[2].Conversely,QUINisknown
https://doi.org/10.1016/j.jpba.2020.113246 0731-7085/©2020ElsevierB.V.Allrightsreserved.
foritsbroad-spectrumneurotoxiceffectsincludingitsroleasan NMDA receptor agonist, in addition to its roles in antioxidant depletion,lipidperoxidation,andoxygenintermediategeneration [1].
Multiplesclerosis is a disabling autoimmune, inflammatory, neurodegenerative, demyelinating disease affecting the central nervoussystem.Thediagnosisofmultiplesclerosisisbasedonclin- icalsymptomssuggestiveofdemyelinatingdisordersasprovenby MRIandlumbarpuncture.Inadditiontodisseminationofthedis- easeinspaceand time,itisessentialtoexcludeotherdiseases.
AccordingtoMcDonald’scriteria,asrevisedin2017,oligoclonal gammopathyincerebrospinalfluid(CSF)orthesimultaneouspres- enceofgadolinium-enhancingandnonenhancinglesionscanverify disseminationintime.Disseminationinspacecanbeprovenby thepresenceofoneormoreT2lesionsintheperiventricular,corti- cal,juxtacortical,orinfratentorialspaceorspinalcord[3].Multiple sclerosisisconsideredactiveifthefollowingfindingsarepresent:
relapse,confirmedexpandeddisabilitystatusscale(EDSS)progres- sion,new/enlargedMRIlesions,anddisease-relatedbrainatrophy [4].
Recently, multiple sclerosis subtypes were differentiated according the concentrations of the different TRP metabo- lites [1,5] because changes in their concentrations appear to serve aspotentialbiomarkers. For example, inacute relapse of relapsing–remittingmultiplesclerosis(RRMS),increasedneuro- toxicQUINconcentration,higherQUIN/KYNandQUIN/KYNAratios [6],andlowerKYNAconcentrationcanbeobservedinCSF,whereas increasedKYNAconcentrationwerefoundinplasma.Theexpres- sionof KYNaminotransferase(KAT) alsoincreasedin redblood cells.DecreasedTRPconcentrationinbothserum andCSFwere describedinpatientswithRRMScomparedwiththoseincontrol subjects.Interestingly,duringremission,lowerKYNAconcentra- tioncanbeobservedinCSF[7],whereashigherKYNAconcentration canbefoundinpatientswiththeprogressive formofmultiple sclerosis[8].
The simultaneous quantitative estimation of TRP and its metabolitesrepresentsagreatchallengebecauseoftheirdiverse chemicalproperties,namely,presenceofacidic,basic,andnonpo- larfunctionalgroupsandtheirimmenselydifferentconcentrations inbiologicalmatricessuchasserum(plasma)andCSF.Numerous chromatographicmethodshavebeendevelopedforthesuccessful quantitativeestimationofthesemetabolitesusinggaschromatog- raphy(GC),high-performanceliquidchromatography(HPLC),ultra high-performanceliquid chromatography(UHPLC)coupledwith a fluorescence detector (FD), a UV detector, or tandem mass spectrometry(MS/MS)[8–11].TheadvantagesofUHPLC–MS/MS includeitssensitivity,abilitytoquantitatemultiplecompoundsin asinglerun,shortelutiontime,excellentseparationefficiency,and requirementofsmallsampleamount.Hénykováetal.[9]developed aUHPLC–MS/MSmethodforthequantitativeestimation ofTRP, KYN,3-HK,KYNA,3-hydroxyanthranilicacid(3-HANA),anthranilic acid(ANA),serotonin(SERO),melatonin(MELA),andotherimpor- tantneuroactivemetabolitesderivedfromTRPinhumanCSFand serum.Fuertigetal.[10]describedthesuccessfulquantitativeesti- mationof13compoundsrelatedtoTRPinthebrainsandplasmaof miceandCSFandplasmaofnonhumanprimates.However,none ofthesestudiesconsideredtheseparationandpeakshapeofearly elutingcomponents.Becauseofthedifferentchemicalcharacteris- ticsofTRPanditsmetabolites,thecombinationofseveralmethods wasusedtomeasuretheirconcentrationsbyGuilleminetal.[8]
includingUHPLCcoupledwithadiodearraydetectorandanFD wereusedtomeasureTRP,KYN,3-HK,3-HANA,andANAconcen- trationsusingisocraticseparation.Inaddition,gradientelutionwas performedtomeasureKYNAconcentrationusinganFD,andGC coupledwithamassspectrometerwasusedtomeasurePICAand QUINconcentrations.
Themainpurposeofthecurrentstudywastodevelopanew, robust UHPLC–MS/MS method to quantify the concentrations of TRP and its 11 most important metabolites (Fig. 1), which were derived via both KP and SERO pathways, including the concentrationsoftherarelymeasuredmetabolitesPICAandQUIN.
Optimization of a chromatographic method can be supported andacceleratedusinginsilicosimulationsoftware[12]todefine themostappropriateconditionsforrapid,sensitive,precise,and reproducibleanalysisas economicallyaspossible.Aftercolumn and organic modifier scouting, the DryLab®4 method develop- ment/optimizationsoftware[13]wasappliedtopredictretention andresolutionasfunctionsofgradienttime(tG)andtemperature (T).
Tothebestofourknowledge,thisisthefirstreportonthesimul- taneousquantitativecharacterizationofendogenousSERO,KYN, 3-HANA,TRP,5-hydroxyindoleaceticacid(5-HIAA),ANA,KYNA,3- HK,xanthurenicacid(XA),MELA,PICA,andQUINinserumandCSF ofpatientswithmultiplesclerosisusingUHPLC–MS/MS.
2. Materialsandmethods 2.1. Reagentsandchemicals
AllreagentsandchemicalswereofanalyticalorLC–MSgrade.
TRPanditsmetabolitesd4-PICAandn-butanolwerepurchased fromSigma-Aldrich(St.Louis,MO,USA).d3-3-HKwasobtained fromBuchemB.V.(Apeldoorn,TheNetherlands).Otherdeuterated internal standards (ISs; d4-SERO, d4-KYN, d3-3-HANA, d5-TRP, d5-5-HIAA,d5-KYNA,d4-XA,d4-MELA,andd3-QUIN)werepur- chasedfromTorontoResearchChemicals(Toronto,ON,Canada).
Acetonitrile(ACN),methanol(MeOH),water,HPLC-gradeammo- niumformate,andammoniumacetatewereobtainedfromVWR Chemicals(Monroeville,PA,USA).Formicacid(FA)waspurchased fromFisherScientific(Portsmouth,NH,USA)andacetylchloride fromAlfaAesar(Haverhill,MA,USA).
2.2. Preparationofstandard,IS,andqualitycontrol(QC)solutions Stocksolutionswerepreparedindividuallyatafinalconcentra- tionof1mg/mL,except3-HKandd3-3-HK(0.5mg/mL).According totheirstabilityandsolubility,severalsolventswereused.SERO, d4-SERO,TRP,d5-TRP,ANA,PICA,andd4-PICAweredissolvedin water–MeOH–FA–ascorbicacid(50:50:0.1:0.02,v/v/v/v).KYN,d4- KYN,5-HIAA,d5-5-HIAA,3-HK,d3-3-HK,MELA,d4-MELA,QUIN, andd3-QUINweredissolvedinMeOHcontaining0.1%(v/v)FAand 0.02%(v/v)ascorbicacid.3-HANA,d3-3-HANA,KYNA,d5-KYNA, XA,andd4-XAweredissolvedindimethylsulfoxide.Allstandard stocksolutionswerepreparedonice,dividedinto200-Laliquots, andstoredat−80◦Cuntilfurtheruse.
Calibration standards were prepared at 12 levels and QC samples at three levels (low-level QC [LQC], eighth point of calibration;middle-level QC [MQC],fourth point ofcalibration;
and high-level QC [HQC], second point of calibration) in arti- ficial CSF (aCSF; containing 127mM NaCl, 1.0mM KCl, 1.2mM KH2PO4,26mMNaHCO3,10mMd-glucose,2.4mMCaCl2,1.3mM MgCl2,and 5.26Mbovineserumalbumin)[14] forCSFanaly- sis.Calibrationstandardscomprised250LaCSF,20Lstandard solutionmix(31.25–1000nMSERO,6.25–200nMKYN,0.25–8nM 3-HANA,250–8000nMTRP,12.5–400nM5-HIAA,0.6–20nMANA, 0.25–8nMKYNA,1.25–40nM3-HK,0.1–2nMXA,0.25–8nMMELA, 2–60nMPICA, and 5–160nM QUINin 0.1 %[v/v] aqueousFA), and910Lice-coldACNcontaining10Lstableisotope-labeled (SIL)-ISmix(800nMd4-SERO,20nMd4-KYN,3nMd3-3-HANA, 4000nM d5-TRP, 200nM d5-5-HIAA, 2nM d5-KYNA, 8nM d3- 3-HK,0.4nMd4-XA, 4nMd4-MELA,15nM d4-PICA,and 25nM d3-QUIN).
Fig.1.Simplifiedpathways oftryptophanmetabolism,indicating theprincipleenzymes,kynurenineaminotransferase(KAT), indoleamine-2,3-dioxygenase(IDO), tryptophan-2,3-dioxygenase(TDO),kynureninase(KYNU),andkynurenine-3-monooxygenase(KMO).
The calibration standards and QC samples for serum anal- ysis were prepared in charcoal-stripped human serum, which waspreparedasdescribedbyMölleretal.[15]. Briefly,1.2gof charcoal-activatedpowder(FisherScientific)wasaddedto20mL serum,rotatedfor 2h, andcentrifugedat14,000 ×g for10min toobtainthesupernatant.Then,“blank”serumwasconfirmedby LC–MS/MStobefreeofTRPanditsmetabolites.Calibrationstan- dardscomprised100L“blank” serum,10Lstandardsolution mix[156.25–5000nMSERO,312.5–10000nMKYN,7.8–250nM3- HANA,6.25–200MTRP,7.8–250nM5-HIAA,6.25–200nMANA, 4.7–150nMKYNA,6.25–200nM3-HK,1.5–50nMXA,0.16–5nM MELA,3.125–100nMPICA,and62.5–2000nMQUINin0.1%(v/v) aqueousFA],and370Lice-coldacetone:MeOH(1:1,v/v)contain- ing10LSIL-ISmix(1500nMd4-SERO,1000nMd4-KYN,65nM d3-3-HANA,5250nMd5-TRP,200nMd5-5-HIAA,50nMd5-KYNA, 90nMd3-3-HK,25nMd4-XA,4nMd4-MELA,80nMd4-PICA,and 300nM d3-QUIN). Concentrations were selected in accordance withendogenous analyte concentrationsand toreach a proper signaltonoiseratio.
2.3. CollectionofhumanCSFandserumsamples
Thefemalesincludedinthisstudy,whounderwentbothlumbar punctureandbloodsamplecollection,wereenrolledattheDepart- mentofNeurology,UniversityofSzeged.Approvalforthehuman studywasgrantedbythelocalEthicalCommitteeoftheUniver- sityof Szeged(46/2014 and 143/2015), and thestudyprotocol adheredtothetenetsof themostrecentrevisionof theDecla-
Table1
Detaileddemographicandclinicaldataofthestudypopulation.
Subject Multiplesclerosisgroup Controlgroup Ageinyears(mean±SD) 33.84±9.14 37.57±10.09 Ageatonset(mean±SD) 32.47±9.00 –
EDSS(median,IQR) 0.5(0,1.5) –
Dataarepresentedasthemean±SDormedianandinterquartilerangeforEDSS.
EDSS,expandeddisabilitystatusscale;IQR,interquartilerange;SD,standarddevi- ation.
rationofHelsinkiforexperimentsinvolvinghumans.Allenrolled subjectsprovidedvoluntarysignedinformedconsentforparticipa- tion.Inclusioncriteriaforthemultiplesclerosisgroupwereolder than18years, femalesex,diagnosisofRRMS,clinicalfollow-up foratleast2years,andavailabilityofserumandCSFsamplesat thebiobankatthetimeofdiagnosticlumbarpuncture(n=20).The demographicandclinicaldataofthecohortarepresentedinTable1.
DisabilitywasquantitativelyestimatedusingEDSS.EDSSvalues rangedbetween0and5.5 (median=0.5).Age-matchedpatients (n=14)withsymptomaticneurologicaldisorder(e.g.,headache) ornoninflammatoryneurologicaldisease(e.g.,benignintracranial hypertension)whohadbeenfollowedupforatleast2yearsserved asthecontrolgroup.
CSFsampleswerecentrifugedimmediatelyafterlumbarpunc- tureat3500rpmfor10min,andaliquotsof500Lwerestored at−80◦Cuntilfurtheruse.Whole-bloodsampleswerecollected in Vacutainertubes, centrifuged,and thesupernatant storedas mentionedpreviously.SerumandCSFsampleswerecollectedand
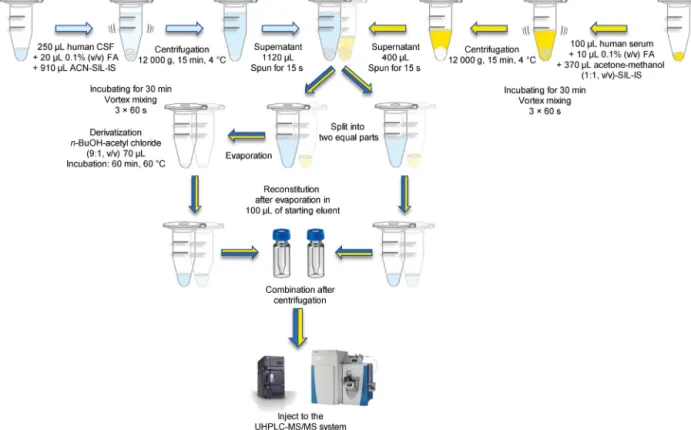
Fig.2.FlowchartofthesamplepreparationprocessofhumanCSFandserumsamples.
CSF,cerebrospinalfluid;FA,formicacid;ACN-SIL-IS,acetonitrilecontainingstableisotope-labeledinternalstandard;n-BuOH,n-butanol;UHPLC–MS/MS,ultrahigh- performanceliquidchromatography-tandemmassspectrometry.
storedaccordingtothestandardizedinternationalbiobankingcon- sensusprotocoloftheBIOMS-Eunetwork[16].
2.4. PreparationofhumanCSFandserumsamplesforanalysis PriortoprofilingtheKPandSEROpathways,sampleswererela- beled;therefore,ablindstudywasconducted.To250Lofeach CSFsample,20L0.1%(v/v)ofaqueousFAand910Lice-cold ACNcontaining10LSIL-ISmix(thesameasusedintheprepa- rationofthecalibrationstandards)wereadded,andthemixture wasvortexedfor30s.Itwasallowedtorestfor15minat−20◦C, vortexedfor60stosupportproteinprecipitation,andincubated foranother15minat−20◦C.Thesupernatantwasobtainedvia centrifugationofthemixturefor15minat12,000×gat4◦C.The supernatant(1120L)wastransferredtoanewtube,centrifuged for15s,andsplitintotwoequalparts.Afterconcentrationunder vacuum(SavantSC110ASpeedVacPlus,Savant,USA),halfofthe samplewastreatedwith70L derivatizingreagent(n-butanol- acetylchloride,9:1,v/v)andincubatedfor1hat60◦C.Themixture wasdriedundernitrogenbeforereconstitution.Bothpartsofthe sampleweredissolvedin100Lstarting eluent,vortexed,cen- trifuged,andcombined(Fig.2).
Serumsampleswerepreparedinthesamemanner,exceptthat to100Lofserumsampleweremixedwith10L0.1%(v/v)aque- ousFAand370Lice-cold acetone–MeOH(1:1,v/v)containing 10LSIL-ISmix,and400Lsupernatantwasprocessedfurther (Fig.2).
2.5. InstrumentationandUHPLC–MS/MSanalysis 2.5.1. DevelopmentandoptimizationofUHPLCseparation
UHPLCseparationofTRPand itsmetaboliteswasperformed on an ACQUITY I-Class UPLCTM liquid chromatography system (Waters, Manchester, UK) comprising Binary Solvent Manager,
SampleManager-FL,andColumnManager.Thedwellvolumeof thesystemwas100L.
To select the most appropriate column for analyte separa- tion,thefollowingreversed-phasecolumnsweretested:BEHC18 2.1×50mm(1.7m)andCortecsC182.1×50mm(1.6m)from Waters(Milford,MA,USA)andKinetexC182.1×100mm(2.6m);
KinetexEVOC182.1×150mm(5.0m);LunaC182.0×100mm (2.5m); Luna Omega Polar C18 2.1×50mm, (1.6m); Luna Omega PS C18 2.1×50mm (1.6m), Kinetex C8 2.1×150mm (2.6m), Jupiter Proteo C12 2.0×150mm (4.0m), and Luna Phenyl-Hexyl2.1×100mm(2.6m)fromPhenomenex(Torrance, CA,US).
ChromatogramsweredevelopedwithagenericMS-compatible gradientfrom2%to80%Bin7minusing0.1%FAassolventA and0.1%FAinMeOHassolventB.Similargradientelutionwas performedusingACNinsolventBasanorganicmodifier.Foreach measurement,theflowratewassetat300L/minandTat25◦C.
Intotal,20Lofastandardmixturecontaining2g/mLofeach analyte wasinjectedinto thecolumns.The UHPLCsystem was controlledusingMassLynx4.1SCN901(Waters).
Tooptimizeseparation onthe“best”column, a2Dretention modelwasbuiltonthebasisoffourchromatographicrunsafter injectionofamixtureof allanalytes.The tG valuesweresetat 5and15mintolinearlychangetheeluentcompositionfrom10
%to90%MeOH containing0.1%FA.Chromatographywasper- formedat25◦C and50◦Cataflowrateof300L/min.Peaksin differentchromatogramswereidentifiedbydetectingthemolec- ularionsofeveryanalyteonamassspectrometer.Theresulting chromatographicdata(retentiontime,peakwidth,andarea)were enteredintoDryLab®4(Molnár-Institute,Berlin,Germany)tocre- atea2Dresolutionmapdisplayingthecriticalresolutionsofthe peaksseparatedagainsttGandT.
ChromatographicseparationforquantitativeestimationofTRP and its 11 metabolites in CSF and serum was performed at
25◦Conapentafluorophenyl(PFP)column(Phenomenex;100Å, 100mm×2.1mm,particlesize2.6m;“best”column)protected byaPFPguardcolumn(Phenomenex)using0.1%(v/v)aqueousFA assolventAandMeOHcontaining0.1%(v/v)FAassolventB.The finalgradientwassetasfollows:0.0min,10%B;1.0min,30%B;
3.0min,50%B;3.5min,90%B;5.0min,90%B;5.1min,10%B;
and7min10%B.Foreachmeasurement,theflowratewassetat 300L/min.SampleTwasmaintainedat5◦C.Finally,20Lofthe samplewasinjectedintotheUHPLC–MS/MSsystem.
2.5.2. Optimizationofmassspectrometricanalysis
Allmass spectrometricmeasurementswereconductedusing theQExactiveTMPlusHybridQuadrupole-OrbitrapMassSpectrom- eter(ThermoFisherScientific,SanJose,CA,USA)connectedonline tothe UHPLCinstrument. The instrument was operatedin the positive-ionmodeusingtheequippedHESI-IIsourcewiththefol- lowingparameters:capillaryT,256◦C;sprayvoltage,3.5kV;aux gasheaterT,406◦C;sheathgasflow,48;auxgasflow,11;sweep gasflow,2;andS-lensRFlevel,50.0(sourceauto-defaults).Fullscan wasconductedwithamassrangeof50–300m/zandresolutionof 17,500.Theautomaticgaincontrol(AGC)settingwasdefinedas 3×10⁶charges,andthemaximuminjectiontimewassetto60ms.
For quantitative mass spectrometric analysis of TRP and its metabolitesusingMS/MS,theparallelreactionmonitoring(PRM) data acquisition modewas selected. Toreach the bestprecur- sor/producttransitionforquantitationandmaximizesensitivity, the optimalfragmentation conditions and collision energies of each analyte were identified. This optimization procedurewas performedforeachindividualstandardbydirectlyinfusingeach solutionintotheionsourceusingaHamiltonsyringeataflowrate of20L/min.
TheconcentrationsofTRPanditsmetabolitesinbiologicalsam- ples were measured by monitoringthe appropriate transitions (Table 2)determined previously.AGC target wassetat 5×10⁶ chargesfor TRPand d5-TRP becauseof theirhigherconcentra- tionsand2×105chargesfortheremaininganalytes.Themaximum injectiontimewassetat60msandresolutionat17,500.Adivert valveplacedaftertheanalyticalcolumnwasprogrammedtoswitch flowontothemassspectrometeronlywhenanalytesofinterest elutedfromthecolumn(1.4–5.0min)topreventexcessivecontam- inationoftheionsourceandionoptics.Thewashingprocedures oftheautosamplerbeforeandafterinjectingsampleswerepro- grammedtoavoidcarryoverofanalytes.
Controlof themassspectrometer,dataacquisition,anddata processing wasconductedusing XcaliburTM 4.1 (ThermoFisher Scientific).
2.6. Methodvalidation
BiologicalmatricesdevoidofTRPanditsmetabolitesarenot readily available; hence, surrogate matrices (aCSF and “blank”
serum)wereusedtodemonstratetheefficiencyofthemethod.In thisstudy,SIL-ISanalogswereusedtovalidatetheUHPLC–MS/MS method. For validation, the linearity, limits of detection (LOD) andquantification(LOQ),precision,accuracy,andrecoverywere assessedfollowingtheICHandFDAguidelines[17,18].
2.6.1. Linearity,LOD,andLOQ
Thecalibrationcurvesofthe12analyteswereconstructedfrom thepeakarearatiosofthecompoundtoSIL-ISat11levelsusing mixedworkingstandardsolutions.Accordingtotheacceptancecri- teria,thecalibrationcurveshouldhaveacorrelationcoefficient(r2) of0.99orbetter.TheLODandLOQofeachanalytewerecalculated basedonthestandarderroroftheintercept.LODandLOQwerecal- culatedusingtheformulas3.3×␣/Sand10×␣/S,respectively,
where␣isthestandarderrorofthey-interceptandSistheslope ofthecalibrationcurve(SupplementaryTables1–2).
2.6.2. Precisionandaccuracy
Theaccuracyandintradayandinterdayprecisionswerecalcu- latedbydeterminingfivereplicatesofLQC,MQC,andHQCsamples over3consecutivedays(n=45).TheconcentrationvaluesofQCs arepresentedinSupplementaryTables3–6.
Regardingprecision,theacceptancecriterionwas±15%with respecttorelativestandarddeviation(RSD).Regardingaccuracy, thelimitwasthesamerelativetodefiniteconcentrations.
2.6.3. Recovery
Todeterminerecovery,twobatcheswerepreparedasdescribed previously [19]. The first batchwas spikedbeforeprotein pre- cipitation, whereas the second batch was spiked after protein precipitation.Toachievereliableresults,fiveLQC,MQC,andHQC replicateswereprepared(seeChapter2.2).TherecoveryofTRPand itsmetaboliteswasestimatedbycomparingthecalculatedconcen- trationratiosofthetwobatchesatthreeQClevels(LQC,MQC,and HQC;n=45).
2.7. Statisticalanalysis
The calculation of peak arearatios and the calibration and quantitationofanalyteswereperformedfromcollectedrawdata usingXcaliburTMQuanBrowser(ThermoFisherScientific).Thepro- cesseddataincludingpeakarea,peakarearatio,retentiontime, andconcentrationwereexportedintoMicrosoftExceltocreatean appropriatefileforinputintheRsoftware[20].Thenormalityof thevariableswascheckedusingtheKolmogorov–Smirnovtestand visuallycheckedusingquantile–quantileplots,andtheequalityof varianceswasexaminedusingWelch’sF-test.Outlierswereiden- tifiedusingGrubbs’stest.Tocomparedatabetweenthecontrol andmultiplesclerosisgroups,boxplotswithSDsweregenerated.
Comparisonsbetweenthetwogroupswereconductedusingan independentsamplest-testortwo-sampleWilcoxontestinR.A p-valueof<0.05wasconsideredstatisticallysignificant.
3. Resultsanddiscussion
3.1. Optimizationofsamplepreparation
TheanalysisofsmallmoleculesusingLC–MSusuallyrequires cleanupprocedurestoeliminatetheworstinterferingcompounds and to concentrate the sample if the analyte is present at extremelylowconcentrations.Biologicalsamplescontainproteins thatadverselyaffecttheanalysisofsmallmolecules.Toimprove sensitivity,proteinsinsampleshadtobeeliminated.Inourpre- liminaryexperiments,fourdifferentprecipitationsolvents were comparedwiththeir3×and5×volumesinhumanserumsamples [i.e., MeOH,ACN, acetone–MeOH(3:7, v/v),and acetone–MeOH (1:1,v/v)]andtwodifferentsolventsinCSFsamples(i.e.,MeOH andACN)tomonitortherecoveryofeachTRPmetabolite.3-HANA couldnotbedetectedusingMeOH(datanotshown).Thebestresult wasachievedusing3×volumeofACNtoprecipitatethemajority ofproteinsinCSFsamplesand3×volumeofacetone–MeOH(1:1, v/v)forserumsamples(seeChapter3.3.3).
Inacomplexquantitativebioanalyticalmethod,theuseofSIL-IS canhelpcontrolthevariabilityofthemethod.Becauseitispro- cessedalongwiththeanalyte,SIL-ISshouldbothhelpcorrectfor variabilityinsamplepreparationduringextractionandchemical derivatizationandcompensateforvariabilityinMSdetection.In thepresentstudy,11deuteratedequivalentsofTRPmetabolites wereaddedatthebeginningofanalysistocontroleverystepof theanalytical procedure. Unfortunately, thedeuteratedformof
Table2
Exactmassoftheprecursor,quantifier,andqualifierionsandtheoptimalcollisionenergiesoftheanalytesinthePRMmethod;theirexperimental(texp)andsimulated(tsim) retentiontimes,andtheirratio(texp/tsim)inoptimizedultrahigh-performanceliquidchromatographicseparation.
Analyte Precursorion[M+H]+ Quantifierion[M+H]+ Qualifierion[M+H]+ CE(eV) texp(min) tsim(min) texp/tsim
SERO 177.1022 115.0548 132.0810 32 1.53 1.50 1.02
d4-SERO 181.1273 119.0704 136.1060 32 1.53 1.50 1.02
KYN 209.0919 94.0660 146.0603 14 1.61 1.59 1.01
d4-KYN 213.1169 98.0912 150.0856 14 1.61 1.59 1.01
3-HANA 154.0499 136.0393 108.0453 10 2.26 2.24 1.01
d3-3-HANA 157.0688 139.0582 111.0812 10 2.26 2.24 1.01
TRP 205.0973 118.0652 188.0706 18 2.42 2.38 1.01
d5-TRP 210.1285 123.0968 193.1018 18 2.42 2.38 1.01
5-HIAA 192.0659 146.0600 117.0570 18 2.69 2.65 1.01
d5-5-HIAA 197.0972 150.0852 122.0685 18 2.69 2.65 1.01
ANA 138.0547 92.0503 120.0449 20 3.06 3.03 1.01
KYNA 190.0502 116.0503 162.0552 38 3.54 3.55 1.00
d5-KYNA 195.0806 121.0816 167.0867 38 3.54 3.55 1.00
XA 206.0450 178.0508 132.0443 21 3.90 3.91 1.00
d4-XA 210.0695 182.0761 136.0691 21 3.90 3.91 1.00
3-HK 281.1496 152.0709 110.0606 15 3.99 4.03 0.99
d3-3-HK 284.1684 155.0897 113.1082 15 3.99 4.03 0.99
MELA 233.1284 130.0654 115.0546 54 4.11 4.16 0.99
d4-MELA 237.1536 134.0907 119.0801 54 4.11 4.16 0.99
PICA 180.1019 96.0453 124.0396 28 4.38 4.43 0.99
d4-PICA 184.1270 100.0702 128.0647 28 4.38 4.43 0.99
QUIN 280.1543 96.0453 124.0396 37 4.63 4.61 1.00
d3-QUIN 283.1732 99.0641 128.0647 37 4.63 4.61 1.00
CE,collisionenergy;SERO,serotonin;KYN,l-kynurenine;3-HANA,3-hydroxyanthranilicacid;TRP,tryptophan;5-HIAA,5-hydroxyindoleaceticacid;ANA,anthranilicacid;
KYNA,kynurenicacid;XA,xanthurenicacid;3-HK,3-hydroxykynurenine;MELA,melatonin;PICA,picolinicacid;QUIN,quinolinicacid.
Fig.3. Extractedionchromatogramsoftheunderivatized(left)andbutyl-esterified(right)formsof3-hydroxykynurenine(3-HK,greenpeaks),picolinicacid(PICA,orange peaks),andquinolinicacid(QUIN,redpeaks).
ANAwasunavailable; therefore,for itsquantitative estimation, d5-KYNA,whichhasasimilarchromatographicelutiontime,was used.
SomeTRPmetabolites(3-HK,PICA,andQUIN)haveunfavor- ablechromatographicproperties,makingtheirquantitativeLC–MS estimationunreliable.Thechromatographicpropertiesofanalytes canbemodifiedviaderivatization.Changesinthestructureofan analyteusually affectitsphysicaland chemical properties(e.g., polarity,solubility,stability,andionizationefficiencyinmassspec- trometry),which can alter theseparation characteristicsof the analyte(e.g.,improvedpeakshape,elutiontime,peaksymmetry, efficiency,andplatecount)[21]. Ifthesechangesare favorable, theymightleadtoimprovementintheseparationoftheanalyte.
Regardingprecolumnderivatization,theselectedreactionmustbe quantitativeor,atleast,reproducibleandfreeofbyproducts.
Atthesametime,chemicalmodificationmayservetominimize matrixinterferencebymovingthecompoundtoapositiononthe chromatogramwhereinterferencewiththematrixcomponentis minimal.
ExceptSEROandMELA,TRPanditsmetaboliteshavecarboxyl group(s).Themostfrequentlyusedapproachforderivatizingcar-
boxylicacidsisesterificationwithashort-chainaliphaticalcoholin thepresenceofanacidasacatalyst[22].Althoughthisestablished esterificationmethod(Fischeresterification)leadstoequilibrium, thereactioncanbeshiftedtowardtheproductsbyapplyingexcess amountofalcohol.EsterificationofTRPanditsmetaboliteswas performedusingMeOH,ethanol,n-propanol,orn-butanol.Because theyhavethelongesthydrophobicaliphaticchains,thebutylated products exhibited the highest retention when reversed-phase columnswereused,andtherewasnocoelutionoftheesterified andnonderivatizedcomponents(datanotshown).Butylesterfor- mation changed thepolarity of the molecules,resulting in the formationof well-retainedpeakswithexcellentpeak shapesin casesof3-HK,PICA,and QUIN(Fig.3).Esterificationof analytes withthemixtureofn-butanolandacetylchlorideisacommonly usedproceduretoderivatizeaminoacidsfornewbornaminoacid screeningviamassspectrometry[22].
Thederivatizationmethodwasoptimizedbyassessingtheeffect ofreactiontime(0,20,30,40,50,and60min;n=3;Fig.4),andthe maximumconversionofcarboxylgroup(s)toesterswasachieved after60-minreaction.Althoughesterificationwasnotcomplete after60minforallcomponents(74%–95%),themethodcouldbe
Table3
Physicochemicalproperties(hydrogenbonddonor/acceptorgroups,pKa,logP,logD,andisoelectricpoint)oftryptophanmetabolites(calculatedusingChemAxon’sChemi- calizesoftware[24]).
Analyte Molecularmass(g/mol) pKa1 pKa2 pKa3 pI logP logD(pH3) logD(pH6) logD(pH9) Hydrogenbond donorcount
Hydrogenbond acceptorcount
SERO 212.68 9.31 10.00 9.78 0.48 −1.85 −1.76 0.32 3 2
KYN 306.29 1.19 8.96 6.11 −1.91 −2.35 −1.91 −2.20 3 5
3-HANA 153.14 1.94 10.37 4.82 3.03 1.15 0.75 −0.42 −2.36 3 4
TRP 204.23 2.54 9.40 5.97 −1.09 −1.19 −1.09 −1.22 3 3
5-HIAA 191.18 4.22 9.56 – 1.41 3.80 −0.38 −2.16 3 3
ANA 137.14 4.89 1.95 3.34 1.45 1.27 0.17 −2.00 2 3
KYNA 189.17 2.47 2.31 1.87 2.40 −0.47 −1.68 2 4
XA 205.17 2.17 9.06 14.22 3.25 −0.17 −0.17 −0.65 −2.22 3 5
3-HK 224.21 0.99 9.86 3.378.90 6.11 −2.21 −2.73 −2.21 −2.57 4 6
MELA 232.28 −1.57 15.90 7.08 1.15 1.15 1.15 1.15 2 2
PICA 123.11 1.00 5.52 3.04 −0.65 −0.65 −1.25 −2.71 1 3
QUIN 167.12 0.31 4.16 6.67 2.27 −1.2 −1.23 −3.11 −6.39 2 5
SERO,serotonin;KYN,l-kynurenine;3-HANA,3-hydroxyanthranilicacid;TRP,tryptophan;5-HIAA,5-hydroxyindoleaceticacid;ANA,anthranilicacid;KYNA,kynurenicacid;
XA,xanthurenicacid;3-HK,3-hydroxykynurenine;MELA,melatonin;PICA,picolinicacid;QUIN,quinolinicacid.
Fig.4.Efficiencyofesterificationinpercentagesatdifferentreactiontimes.Quino- linicacid,red;3-hydroxykynurenine,green;picolinicacid,orange.
reliablyusedbecauseofthepresenceofSIL-IS,whichhasnearly identicalchemical andphysicalpropertiesasthetargetanalyte.
Althoughtheabsoluteresponse maybeaffected,theanalyte/IS peakarearatioshouldbeunaffectedandthemethodshouldbe accurate,precise,andrugged.
Duringsamplepreparation,allcarboxylgroup-containingcom- poundswereesterifiedin50%ofthesamplesandremixedwith theuntreatedfractiontoanalyzebutylated3-HK,PICA,andQUIN in the same chromatographic run with SERO, MELA, and the non-esterifiedcarboxyl group-containingTRPand itsremaining metabolites.
3.2. DevelopmentandoptimizationoftheUHPLCmethod
LC–MS is one of the most prominent analytical techniques becauseofitsinherentselectivityandsensitivity.Mostcurrently used HPLC/UHPLC separation techniques are performed using reversed-phasechromatography(RPC).RPChasbecomethestan- dardtechniqueforanalyzingawiderange ofsmall(evenlarge) compoundsrangingfromneutral polarand nonpolarsolutesto acidic,basic,andamphotericcompounds.Stationaryphasesused inRPCtypically comprisevarying lengthsofhydrocarbonssuch asC18,C8,andC4,forwhichanalyteretentionismainlydrivenby hydrophobicandvanderWaalsinteractions.Asthemobilephase,a mixtureofwaterwithamiscible,polarorganicsolventsuchasACN andMeOHisused,usuallysupplementedwithdifferentadditives.
TRPandsomeofitsmetabolitesareratherhydrophobicbecause oftheindoleorphenylring;however,theattachedpyridinering andhydroxy,amine,orcarboxygroupsincreasetheirhydrophilic- itywhileprovidingionicpropertiestomolecules.Developingan
LC MSmethodfor thesimultaneousquantitative estimationof thesetypesoftargetcompoundsisextremelychallengingbecause of the great diversity in theirphysicochemical properties (e.g., pKa,isoelectricpoint,hydrophobicity,numberofhydrogenbond donor/acceptorgroups,andsolubility;Table3).
Thefirststageofchromatographicmethoddevelopmentisiden- tifyingthemostpromisingcolumnchemistry,organicmodifier,and pHofthemobilephaseforanalyteseparation.Toscoutthemost appropriatecolumnandorganicsolvent,weperformedtwoini- tialexperimentsusinganumberofcolumnswithelutionusinga MS-compatiblegenericgradient(seeSection2.5.1).The“best”col- umnandorganicmodifierwereselectedviavisualcomparisonof theresultantchromatograms,takingintoaccounttheoverallpeak shapes,retentionofhighlypolarcompounds,andbaselinesepara- tionofanalytesintheshortesttime.Then,DryLab®4wasusedto optimizeseparationontheselectedcolumn.
AnoctadecylsilanecolumnisthefirstchoiceforseparatingTRP anditsmetabolites;therefore,wetestedsevenC18columns.Sep- arationwasalsoperformedonreversed-phasecolumnscontaining otherhydrocarbongroups (C8,C12,and phenyl-hexyl).Because of the different characteristics of the tested stationary phases, theyexhibiteddistinctretentionandelutionprofiles.PICAwasthe firstelutinganalyteonallcolumns,butsatisfactoryretentionwas observedonlyusingtheBEHC18andLunaOmegaPolarcolumns.
TheearlyelutingQUINcouldnotbedetectedusingtheKinetexC18 andCortecsC18columns,whereasitappearedasawidepeakwhen theBEHC18andLunaC18columnswereused.Itselutionprofile wasunacceptablywideontheothercolumns.3-HKexhibitedlow retention,anditsometimeselutedasdoublepeaks(LunaC18,BEH C18,PolarC18,andCortecsC18columns).ThepeakofSEROhad frontingandtailingontheKinetexC18,LunaC18,BEHC18,and CortecsC18columns.ThepeakshapeofXAwasunacceptableon theLunaC18,KinetexC18,CortecsC18,andphenyl-hexylcolumns.
TRP,5-HIAA,ANA,KYNA,andXAgroupedatthesecondpartofchro- matogramsin0.6–1.3-minwindowsusuallyasunseparatedpeaks.
Stationaryphaseswithshorteralkylchainsprovedtobeevenless retentivefortheseanalytes;therefore,wehadtosearchforother typesofreversed-phasecolumns.
Retentiontimeswereshorterandpeaksweresomewhatsharper usingACNasanorganicmodifier;however,noimportantselectiv- ityorsensitivitydifferenceswereobserved.
Fluorinatedstationaryphases,particularlythoseinvolvingPFP moieties,havebecomepopularalternativestothetraditionalalkyl phasesbecauseofthedifferencesinselectivityandretentionthat theyprovide.PFPphasesusemultipleretention mechanismsto separatesmall,highlypolararomaticcompounds[23],andthey appeartobeidealchoicesforanalyzingTRPmetabolites.Theelec-
tronegativefluorineatomsproduceanelectron-deficientphenyl ring,which permitsthePFPphase toact asa Lewisacidor an electronacceptor.–interactions canoccurwithsolutesrich in electrons(Lewis bases)suchas amino and hydroxyl groups.
Carbon–fluorinebondsareextremelypolar,thusenablinganalytes toalsoberetainedbydipole–dipoleinteractions,H-bonding,and sometimesionicinteractions,resultinginincreasedanalytereten- tion.Inthepresenceofarigidaromaticring,thesoluteshapecan alsodictateselectivity.Thepredominanceofeachretentionmecha- nismisinfluencedbythephysicochemicalpropertiesandstructure ofanalytesandthechromatographicconditionsused.
Core-shellKinetexF5(2.1×150mm,2.6m)andtwoKinetex PFP(2.1×100mm,2.6m;Phenomenex)columnswithdifferent lotnumbersweretestedusingtheabovementionedgenericgra- dients.Similarly,asobservedfortheC18stationaryphases,PICA, QUIN,and3-HKelutedinwide,skewedpeaksfromeveryfluori- natedphase.Despitethedifferentstructures(distinctfunctional groupsonbenzene,pyridine,orindolerings),thepKavaluesand H-bondingcapabilitiesofKYN–SEROand5-HIAA–KYNA–XApairs couldnotberesolvedontheKinetexF5column,asobservedfor 3-HANA–KYNandXA–TRPpairsontheKinetexPFPcolumn(from newerseries).TheolderKinetexPFPcolumncouldseparatethe abovementionedanalytepairsusingMeOHasanorganicmodifier, anditgenerallyproduceda“good-looking”chromatogram(except PICA,QUIN,and3-HK).ChoosingACNinsteadofMeOHresultedin differencesinselectivity;however,3-HANAandTRPwerecoeluted, followedby deteriorated quantification of3-HANA becausethe concentrationofTRPin serumand CSFareatleastthreeorders ofmagnitudehigherthanthatof3-HANA.Similarly,ANA,KYNA, andXAcouldnotberesolvedusingACN.
BecauseofthedifferentionizablefunctionalgroupsofTRPand itsmetabolites,thepHofthemobilephasecouldinfluencethe ionizationstateofthesecompounds.However,because10ofour analytespossesscarboxylgroup(s),theirionizationwassuppressed atpH<3,resultinginmorehydrophobicspecies.Themajorityof thesemetabolitesarezwitterionicmolecules,and7ofthemhave isoelectricpointsbelow6.0,indicatingthatthecarboxylgroupis intheanionicformaroundpH6. AthigherpHvalues,more of thesecompoundshaveadditionaldeprotonizedfunctionalgroups, resultinginanionicspecies.Usually,detectionofanionicanalytes viamassspectrometryinthenegativemoderesultsinlowersen- sitivity.Moreover,almostallofourtestedcolumnsarereportedby theirrespectivemanufacturerstohavepoorstabilityabovepH8.
ThesameconclusioncanbedrawnfromthecalculatedlogP andlogDvaluespresentedinTable3[24].Inreversed-phaseHPLC, retentiontimeiscloselyrelatedtothehydrophobicityofanalytes, whichcanbeestimatedusinglogP(octanol/water)values.Whenan analyteisdissociatedinthemobilephase,logD(distributioncoeffi- cient,whichreflectsthecontributionofallionicspeciestothetotal hydrophobicityofananalyte)isoftenusedinsteadoflogP.Increas- ingpHresultedinlowerlogDvaluesforalmostalltestedanalytes, whichagainresultedinlowerretentiontime.
Basedontheresultsofcolumn-andorganicmodifier-scouting experimentsand thetheoreticalconsideration ofthe pHofthe mobilephase,separationofTRPanditsmetaboliteswasperformed onaKinetexPFPcolumnunderacidicconditionsusing0.1%(v/v) aqueousFA(pH2.7)andMeOHasanorganicmodifier.
Derivatization of the carboxyl group(s) of TRP and 9 of its metabolitesviaesterificationwithfourcarbonatomscontaining n-butanolincreasedthehydrophobicityofanalytes,resultingin higherretentiononreversed-phasechromatographiccolumns.The peakshapeofthemostpolarcompounds3-HK,PICA,andQUIN wasoptimalafterbutylation(Fig.3),andtheirretentionincreased significantly.QUINhastwocarboxylgroups,andtheiresterifica- tionmadeQUINthemosthydrophobicTRPmetabolite.Using a genericgradient(seeSection2.5.1),theleastretentiveesterified
3-HKelutedimmediatelybeforethemostretentivenonesterified metaboliteMELA.Esterified5-HIAAandKYNcoeluted,whereas5 butylatedmetabolites(TRP,KYNA,3-HANA,XA,andANA)grouped betweenesterifiedPICAandQUINwithoutdisturbingthedetermi- nationofotheranalytes.
Considering the chromatographic behavior of esterified and nonesterifiedTRPanditsmetabolites,7compoundswereselected for their quantitative estimation in the nonderivatized forms, whereas3metaboliteswerequantitativelyestimatedintheirbuty- latedforms.SEROandMELAwerealsoanalyzed(nonesterifiable), buttheirinvivoconcentrationsprovedtobelowerthantheirLOD inthecaseofCSFsamples.However,SEROcouldbequantifiedin serumsamples.
Apartfrom the type and physical characteristics of thesta- tionaryphase, natureof organicmodifier, andcomposition and pHofthemobilephase,otherchromatographicparameters(e.g., length and profile of the gradient, T, ionic strength of the mobilephase,initialandfinalorganicconcentrationsofeluents, and column dimensions) canalso influence analyte separation.
Improvingthe analytical performance testing of these parame- terswouldbetediousandtime-consuming,butnotcost-effective or “green.” However, computer-assisted HPLC method devel- opment/optimization software can help define the appropriate conditionsforrobust,precise,andreproducibleanalysisandcan simultaneously save resources. DryLab®4 is one such software thathelpsthechromatographerdevelopbetterandmorereliable HPLC/UHPLCmethodsinashortertime.Thiscanbeachievedby insilicomodelingofretentionandresolutionbasedonalimited number(2–12)ofinitialexperiments[13].
TooptimizeseparationofTRPandits11metabolitesonaKine- texPFPcolumnusingMeOHasanorganicmodifier,weperformed fourinitiallineargradientchromatographicrunstotesttheeffects ofgradientsteepness/tG(tG1=5andtG2=15min)andT(T1=25◦C andT2=50◦C)onretentiontimeandresolution.Basedonthese chromatograms,thesoftwaresimulatedchromatogramsandcre- ateda2Dcolor-codedresolutionmap,plottingcriticalresolution asa functionoftGandT.Redregionsonthisplotrepresentthe optimalchromatographicconditionswitharesolutionof>1.3.We selectedaworkingpoint(tG1=5min,T=25◦C),andusingthegradi- enteditor,wesimulatedtheresolutionofthetwomostproblematic analytepairs:SERO–KYNand3-HK–XA(Fig.5).Thebestseparation wasachievedusingagradientwithfourlinearsegments:0–1min, 10%–30%B;1–3min,30%–50%B;3–3.5min,50%–90%B;and 3.5–5min,90%B(Fig.6).Retentiontimepredictionwasexperi- mentallyverifiedusingtheselectedparameters.Theexperimental (texp)andsimulated(tsim)retentiontimesforeachanalyte,together withtheirratio(r=texp/tsim),aresummarizedinTable2.Allratios rangedfrom0.99to1.02,indicatinganexcellentmatchbetween thesimulatedandactualseparations.
DryLab®4 combines over 30 years of HPLC expertise with thelatestsoftware technologiesand enableschromatographers involvedinpharmaceuticalandchemicalindustries,environmen- talprotection,andresearchindustriestoeasilycreatefast,robust, high-qualitymethods[21].Tothebestofourknowledge,thisisthe firstreportontheuseofDryLab®4tooptimizeLC/MSanalysisof endogenousmultianalyte-containingbiologicalsamples[25].
3.3. Methodvalidation 3.3.1. Linearity,LOD,andLOQ
TheLOD,LOQ,retentiontime,andlinearityofthecalibration curveswithr2valuesareshowninSupplementaryTable1forCSF andSupplementaryTable2forserum.Forallanalytes,r2exceeded 0.99.LODwaslessthan7.80nM,andinmostcases,LOQwaslower than8.26nMforallmetabolites,exceptinSEROandQUIN(23.65 and20.59nM,respectively).
Fig.5.DryLab®4resolutionmapwithworkingpoint(tG=5min,T=25◦C).
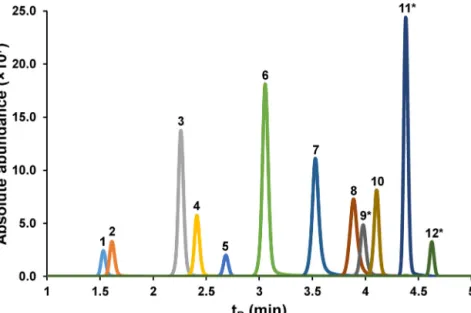
Fig.6. Extractedionchromatogramofquantitativelyestimatedanalytes:serotonin(1),l-kynurenine(2),3-hydroxyanthranilicacid(3),tryptophan(4),5-hydroxyindoleacetic acid(5),anthranilicacid(6),kynurenicacid(7),xanthurenicacid(8),3-hydroxykynurenine(9*),melatonin(10),picolinicacid(11*),quinolinicacid(12*).*,indicates derivatizedanalytes.
3.3.2. Precisionandaccuracy
Theintradayandinterdayprecisions(RSD)ofthemethodfor thetwomatriceswereobtainedbyanalyzingfivereplicatesofthe threeQClevelson3consecutivedays(SupplementaryTables3–6).
Accordingtotheresults,thedevelopedmethodwasfoundtohave areliableprecision.
Theaccuracyrangedfrom86.7-112.0%ofintradayandinterday measurements(SupplementaryTables3and4)inaCSFandfrom 89.1-107.7%inthe“blank”serum(SupplementaryTables5and6), whichareinlinewithrecommendeddata[17,18].
3.3.3. Recovery
Tomeasureanalyteconcentrations,asimpleproteinprecipita- tionmethodwasselectedinsteadofliquid–liquidorsolid-phase extraction.Ingeneral,proteinprecipitationiseasier,morerapid, andreasonablethan theabovementioned methods.Theprocess firstwasconductedusingACNandMeOHforaCSFandwithsup- plementationwithacetone–MeOH(3:7,v/v)andacetone–MeOH (1:1, v/v) for the “blank” serum. Finally, for protein precipi- tation, ACN was used for aCSF and acetone–MeOH (1:1, v/v) for the “blank” serum. Analyte recoveries were determined at threedifferentconcentrationstoprovethattherecoveryofeach
analytewasconcentrationindependent,reproducible,andconsis- tent.
Analyterecoveriesrangedfrom93.8-105.3%foraCSF(Supple- mentaryTable7) andfrom 84.7-109.4% forthe“blank” serum (SupplementaryTable8).Ourvaluesarewithintherangerecom- mendedbytheICHandFDAguidelines[17,18].
3.4. TRPmetaboliteprofilechangesinmultiplesclerosis
In mostcases, thequantitative estimation of many analytes withdifferent polarities is challenging. Hence,derivatization is commonlyusedtoimprovetheselectivityandsensitivityofthe methodbecauseitchangesthechemicalpropertiesofcompounds and increasesthemassof analytes,which provideanexcellent strategyforavoidingtheinterferenceofmatrixcomponents[26].
Therefore,toachievesuccessfulsimultaneousquantitationofthe 12analytes,aderivatizationstepwasincludedtoimprovethepeak shapeandretentionof3-HK,PICA,andQUIN.Althoughtheconcen- trationsofbothSEROandMELAwerebelowtheirLODinCSFand thatofMELAwasalsobelowitsLODinserum,themethodwas validatedaccordingtotheICHandFDAguidelines[17,18].Appli- cabilityofthemethodwasprovenbyquantifyingthemetabolitesof
Fig.7.Boxplotsofsignificantchangesbetweenthecontrolandmultiplesclerosisgroupsincerebrospinalfluid,intheconcentrationsofkynurenicacid(KYNA),3- hydroxykynurenine(3-HK),picolinicacid(PICA),quinolinicacid(QUIN),KYNA/l-kynurenine(KYN),QUIN/KYNA,andPICA/QUIN.Significancewasevaluatedusingan independentsamplest-testoratwo-sampleWilcoxontestaftertheF-test:*p<0.05;**p<0.01;***p<0.001.
Table4
ConcentrationsofTRPanditsmetabolitesinhumancerebrospinalfluidandseruminthecontrolandmultiplesclerosisgroups.
CSF Serum
Analyte Controlgroup Multiplesclerosisgroup p-value Controlgroup Multiplesclerosisgroup p-value
Concentration(nM) Concentration(nM)
SERO <LOD <LOD – 919.9±451.1 725.9±365.4 0.1761
KYN 49.3±16.6 60.4±21.2 0.1691a 2397±664.4 2365±714.9 0.8949
3-HANA 0.7±0.7 1.1±0.8 0.1533a 58.0±20.6 55.3±16.8 0.6853
TRP 1847±305.6 1781±367.3 0.9277a 52043±11057 50948±9325 0.4089
5-HIAA 101.0±36.7 85.8±31.4 0.3487 66.0±21.3 50.7±11.3 0.0248
ANA 7.0±3.9 6.3±3.0 0.7957a 16.2±6.3 15.9±5.0 0.9047
KYNA 0.9±0.6 0.5±0.2 0.0469 32.2±10.4 27.2±9.5 0.1692
XA 0.037±0.034 0.053±0.062 0.8534a 13.7±9.0 10.6±5.0 0.5981a
3-HK 4.7±2.8 6.4±2.6 0.0346a 92.0±46.3 89.8±27.9 0.8724
MELA <LOD <LOD – <LOD <LOD –
PICA 13.4±4.6 10.0±3.4 0.0224 35.4±8.4 31.6±9.2 0.2586
QUIN 16.4±2.8 24.7±5.1 0.0001 100.5±45.9 158.0±73.5 0.0302
QUIN/KYNA 36.2±37.1 73.2±57.8 0.0015a 3.7±2.0 6.5±2.9 0.0183
KYN/TRP(×103) 28.2±11.1 35.1±14.5 0.1575 48.2±15.8 46.8±13.5 0.9855a
PICA/QUIN 0.8±0.4 0.4±0.2 0.0065 0.4±0.3 0.2±0.2 0.0476a
KYNA/KYN(×103) 18.5±12.3 8.9±5.0 0.0041a 14.2±5.6 11.5±3.3 0.0832a
CSF,cerebrospinalfluid;LOD,limitofdetection;SERO,serotonin;KYN,l-kynurenine;3-HANA,3-hydroxyanthranilicacid;TRP,tryptophan;5-HIAA,5-hydroxyindoleacetic acid;ANA,anthranilicacid;KYNA,kynurenicacid;XA,xanthurenicacid;3-HK,3-hydroxykynurenine;MELA,melatonin;PICA,picolinicacid;QUIN,quinolinicacid.
Significantp-valuesarehighlightedinbold.Dataarepresentedasthemean±SD(control,n=14;multiplesclerosis,n=20).p-valuesweredeterminedusinganindependent- samplest-testandtwo-sampleWilcoxontest.
aTwo-sampleWilcoxontest.
interestfrombothhumanCSFandseruminashortstudy,inwhich metaboliteconcentrationswerecomparedbetweenthemultiple sclerosisandcontrolgroups.
Investigationofthemolecularbackgroundofneurodegenera- tivediseasessuchasmultiplesclerosisrequiresintensiveresearch, andsomeanalytesderivedfromTRPhavebeenstudiedcompre- hensively[1,2,5,8].Theneedtomeasureallimportantmetabolites inasinglerunisnecessaryconsideringtheefficiency,financial,and time-savingaspectsofamethod,whereasrobustnessensuresthe applicabilityofthesamemethodondifferentbiologicalmatrices,
whichiscrucialforbettercomprehensionoftheactualpathome- chanismsofdiseases.
In a recent study [8] of TRP metabolites, changes in KYNA, PICA, QUIN, and 3-HK concentrations were compared between patientswithmultiplesclerosisandcontrols.Ourfindingsarein linewithliteraturedata,andQUIN-inducedexcitotoxiceffectscan becounterbalancedbyKYNA.In thecontextofmultiplesclero- sis,QUINconcentrationincreaseddramatically inboth CSF and serum,whereasKYNAconcentrationslightlydecreased (Table4 andFigs.7and8),resultinginasignificantlyhigherQUIN/KYNA
Fig.8.Boxplotsofsignificantchangesbetweenthecontrolandmultiplesclerosisgroupsinserum,intheconcentrationsof5-hydroxyindoleaceticacid(5-HIAA),QUIN, QUIN/KYNA,andPICA/QUIN.Significancewasevaluatedusinganindependentsamplest-testoratwo-sampleWilcoxontestaftertheF-test:*p<0.05;**p<0.01;***p<0.001.
ratiointhemultiplesclerosisgroupthaninthecontrolgroup.The QUIN/KYNAratioreflectsexcitotoxicitybecauseexcitotoxicityis increasinglyfavoredastheratioincreases.Thehypothesisthatexci- totoxicTRPmetabolitescancauseneurodegenerationinmultiple sclerosisissupportedbythesedata.
TheKYNA/KYNratio(apotentialsurrogatemarkerofKATactiv- ity)decreasedinthemultiplesclerosisgroupcomparedwithinthe controlgroup.Thisoriginatedfromdecreasedmetabolismofthe neuroprotectivebranchofKP,aphenomenondescribedinother disorders[27].
Inaddition,thePICA/QUINratio,whichincreasedinthemulti- plesclerosisgroup,maybearesultoftheabilityofneuroprotective PICAtoantagonizeQUINneurotoxicity[28]ormayberepresenta- tiveoftheinflammatoryprocessesinmultiplesclerosis.
InCSFsamples,themeasured3-HKconcentrationsignificantly increased,whichisexpectedbecausethisneurotoxicmetaboliteis knowntopotentiateQUIN-inducedexcitotoxicity[8]. Moreover, QUINis involved inthephosphorylationof neurofilaments,the structuralcomponentsofaxons[29].Theincreasedconcentration ofneurofilamentsinCSFandserumofpatientswithmultiplescle- rosisreflectstheextentofneuroaxonaldamage,asdescribedina previousstudy[30].
4. Conclusion
We validateda UHPLC–MS/MSmethodfor thesimultaneous quantitativeestimationofTRPandits11mostimportantmetabo- litesderivedviabothKPandSEROpathways(SERO,KYN,3-HANA, 5-HIAA,ANA, KYNA,3-HK,XA,MELA,PICA,andQUIN).Theval- idated chromatographic method is accurate and applicable to humanCSFandserum.Although3metabolites(3-HK,PICA,and QUIN) were analyzed in derivatized forms, theywere assessed togetherwith 9 underivatized metabolitesin a singlerun. The
chromatographicmethodwasinsilicooptimizedusingDryLab®4.
Selectivity,linearity,LOD,LOQ,precision,accuracy,andrecovery valuesuponvalidationwerewithintheacceptablerangesrecom- mendedbytheICHandFDAguidelines[17,18].Theapplicability of the chromatographic method wasproved by comparing the describedconcentrationsobtainedusingbiologicalmatriceswith literaturedata.
Thisstudyprovidesa referencefortheclinicalandscientific researchofmultiplesclerosis.Ourresultssuggestthatratiosofdif- ferentTRPmetabolitescouldbeputativebiomarkersofthisdisease.
Tothebestofourknowledge,thisisthefirststudytoquantitatively estimatederivatized3-HK,PICA,andQUINsimultaneouslywith9 otherTRPmetabolitesinhumanserumandCSF.
DeclarationofCompetingInterest
Theauthorsdeclarethattheyhavenoknowncompetingfinan- cialinterestsorpersonalrelationshipsthatcouldhaveappearedto influencetheworkreportedinthispaper.
CRediTauthorshipcontributionstatement
FerencTömösi:Methodology, Investigation,Formal analysis, Writing-originaldraft,Visualization.GáborKecskeméti:Method- ology,Investigation,Formalanalysis,Writing-originaldraft.Edina Katalin Cseh: Writing - original draft. Elza Szabó: Resources.
Cecília Rajda: Writing - original draft. Róbert Kormány: Data curation,Software.ZoltánSzabó:Formalanalysis,Datacuration.
LászlóVécsei:Conceptualization,Supervision,Fundingacquisition.
TamásJanáky:Conceptualization,Supervision,Fundingacquisi- tion,Writing-review&editing.