Capillary Electrophoresis-Mass Spectrometry at Trial by Metabo- Ring: E ff ective Electrophoretic Mobility for Reproducible and Robust Compound Annotation
Nicolas Drouin,*
,#Marlien van Mever,
#Wei Zhang, Elena Tobolkina, Sabrina Ferre, Anne-Catherine Servais, Marie-Jia Gou, Laurent Nyssen, Marianne Fillet,
Guinevere S.M. Lageveen-Kammeijer, Jan Nouta, Andrew J. Chetwynd, Iseult Lynch, James A. Thorn, Jens Meixner, Christopher Lößner, Myriam Taverna, Sylvie Liu, N. Thuy Tran, Yannis Francois, Antony Lechner, Reine Nehmé, Ghassan Al Hamoui Dit Banni, Rouba Nasreddine, Cyril Colas, Herbert H. Lindner, Klaus Faserl, Christian Neusüß, Manuel Nelke, Stefan Lämmerer, Catherine Perrin, Claudia Bich-Muracciole, Coral Barbas, A ́ ngeles López Gonzálvez, Andras Guttman, Marton Szigeti, Philip Britz-McKibbin, Zachary Kroezen, Meera Shanmuganathan, Peter Nemes, Erika P. Portero, Thomas Hankemeier, Santiago Codesido, Víctor González-Ruiz, Serge Rudaz, and Rawi Ramautar*
Cite This:Anal. Chem.2020, 92, 14103−14112 Read Online
ACCESS
Metrics & More Article Recommendations*
sı Supporting InformationABSTRACT: Capillary zone electrophoresis-mass spectrometry (CE-MS) is a mature analytical tool for the efficient profiling of (highly) polar and ionizable compounds. However, the use of CE-MS in comparison to other separation techniques remains underrepresented in metabolomics, as this analytical approach is still perceived as technically challenging and less reproducible, notably for migration time. The latter is key for a reliable comparison of metabolic profiles and for unknown biomarker identification that is complementary to high resolution MS/MS. In this work, we present the results of a Metabo-ring trial involving 16 CE-MS platforms among 13 different laboratories spanning two continents. The goal was to assess the reproducibility and identification capability of CE-MS by employing effective electrophoretic mobility (μeff) as the key parameter in comparison to the relative migration time (RMT) approach. For this purpose, a representative cationic metabolite mixture in water, pretreated human plasma, and
urine samples spiked with the same metabolite mixture were used and distributed for analysis by all laboratories. Theμeff was determined for all metabolites spiked into each sample. The background electrolyte (BGE) was prepared and employed by each participating lab following the same protocol. All other parameters (capillary, interface, injection volume, voltage ramp, temperature, capillary conditioning, and rinsing procedure, etc.) were left to the discretion of the contributing laboratories. The results revealed that the reproducibility of theμefffor 20 out of the 21 model compounds was below 3.1% vs 10.9% for RMT, regardless of the huge heterogeneity in experimental conditions and platforms across the 13 laboratories. Overall, this Metabo-ring trial demonstrated that CE-MS is a viable and reproducible approach for metabolomics.
T
he state-of-the-art MS instrumentation used in metab- olomics typically provides a read-out of thousands of molecular features in a given biological sample within a single run when rigorous datafiltering is not applied to reject a large fraction of spurious signals, redundant ions, and background contaminants.1 The annotation of these features to specific compounds is currently one of the key challenges in metabolomics and is often performed using library-based approaches, corresponding to annotation at various confidence levels according to international guidelines (e.g., Metabolomics Society).2−5Ideally, only parameters presenting good reprodu- cibility and low bias, such as exact mass, should be used andcrossed to reach high identification confidence.3,6 However, other important parameters, such as retention time in LC, may lack consistency from one laboratory to another due to the difficulty to standardize all the operating parameters. This is
Received: July 22, 2020 Accepted: September 22, 2020 Published: September 22, 2020
Article pubs.acs.org/ac
Derivative Works (CC-BY-NC-ND) Attribution License, which permits copying and redistribution of the article, and creation of adaptations, all for non-commercial purposes.
Downloaded via 193.6.47.12 on February 26, 2021 at 11:23:42 (UTC). See https://pubs.acs.org/sharingguidelines for options on how to legitimately share published articles.
particularly the case for the analysis of polar compounds using HILIC conditions where the chemistry and the age of the column, as well as the injection solvent and sample matrix including the preparation of the mobile phase, may yield variable conditions in separation. To tackle this challenge, several laboratories have resorted to experimentally building metab- olomic libraries for compound identification purposes in house, an often time-consuming and relatively expensive effort.
Capillary zone electrophoresis (CE) coupled to mass spectrometry (MS) is highly suited for the profiling of polar and charged metabolites, notably for compound classes such as nucleotides, sugar phosphates, organic acids, nucleosides, and amino acids.7−13 In metabolomics, the use of CE-MS is considerably underrepresented in comparison to other analytical techniques.14,15Over the past few years, various research groups have shown the utility of CE-MS for biomarker discovery studies using both large and small sample sets. For example, Harada et al. assessed the long-term performance of CE-MS for metabolic profiling of more than 8000 human plasma samples from the Tsuruoka Metabolomics Cohort Study over a 52-month period.16Mischak and co-workers have profiled native peptides in more than 20,000 human urine samples by CE-MS with an acceptable interlaboratory reproducibility.17−20 Onjiko et al.
used CE-MS to phenotype cell types in single cells of developing frog embryos.21Very recently, CE-MS has shown good mutual agreement (mean bias < 15%) for reliable quantification of various plasma/serum metabolites and fatty acids as compared to reversed-phase LC-MS and GC-MS.22,23 Overall, all these studies demonstrate the usefulness and added value of CE-MS in the field of metabolomics. However, the separation science community still perceives this analytical technique as technically challenging and less reproducible, especially in terms of migration time among comparative metabolic profiling studies using gas and liquid chromatography.24−26
Migration-time reproducibility is of utmost importance for reliable metabolomics. It aids comparison of metabolic profiles, including scrutinizing samples for subtle changes in profiles/
patterns in comparative metabolomics studies, and facilitates the identification of unknown metabolites. In CE-MS analysis, variability in migration time arises from fluctuations in the electro-osmotic flow (EOF), temperature, physicochemical properties of solvents and the capillary, often due to frequently matrix-induced capillary surface interactions, among other factors. In contrast to chromatographic-based separation techniques, (open-access or commercial) software tools for effectively correcting shifts in migration times are still lacking, despite a high need to improve overall data robustness for enhancing analytical robustness. Nemes et al. employed nonlinear time warping to reduce relative errors from ∼5− 10% to ∼0.3% for migration times, thus substantially aiding metabolite identifications.27More recently, González-Ruiz et al.
tackled this challenge by developing a software, called ROMANCE, which converts the migration time scale into an effective electrophoretic mobility (μeff) scale.28The approach demonstrated effective correction of EOF-caused shifts in migration times, albeit in a small cohort of samples, thus being able to improve the reproducibility of the migration index below 1.5%. The use of μeff raises the potential to aid compound identification in biological samples, notably when using metabolite libraries of electrophoretic mobilities. Such chemical libraries prove especially useful in CE, where migration times may exhibit higher variability.
In 2018, Drouin et al. published thefirstμeffdatabase for 458 endogenous metabolites,29 as well as its use to identify compounds across different laboratories. However, the utility of this approach was examined only by a single individual responsible for preparing the BGE and analyzing the samples in two different laboratories. On the basis of this study, we present the results of the Metabo-ring study in whichμeffon migration- time reproducibility and identification capability in CE-MS- based metabolomics was assessed. The study encompassed 13 independent laboratories from academia and companies spanning 11 countries of 2 continents. All participants used the same batch of samples, consisting of a representative metabolite mixture, human plasma and urine (both matrices used at zero-,five- and 10-fold diluted form) spiked with the same representative metabolite mixture. Each participating lab prepared and employed the same background electrolyte (BGE) on the basis of a protocol. All other parameters (capillary, interface, injection volume, voltage ramp, temperature, type of instrument used, and capillary conditioning and rinsing procedures, etc.) were left to the discretion of the participating laboratories. The key parameters assessed by this Metabo-ring were the reproducibility of relative migration time (RMT) and the μeff across the laboratories, which was determined for a representative set of cationic metabolites in each sample.
■
EXPERIMENTAL SECTIONChemicals. Acetonitrile (MeCN) and dichloromethane were purchased from Actu-All Chemicals (Oss, The Nether- lands) and Biosolves (Valkenswaard, The Netherlands), respectively. Spermine, thiamine, choline, tryptamine, creatine, L-neopterin, trans-4-hydroxy-L-proline, and inosine were obtained from Sigma-Aldrich (Steinheim, Germany).L-arginine,
L-isoleucine, L-leucine,L-tryptophan,L-proline, L-glutamine, L- lysine, histamine, adenosine and procaine were supplied from Fluka (Buchs, Switzerland). Agmatine, adenine, and serotonin were purchased from Alfa Aesar (Kandel, Germany). Para- cetamol and nicotine were obtained from Dr. Ehrenstorfer (Augsburg, Germany) and Carl Roth (Karlsruhe, Germany), respectively. MS-grade water was provided through a Milli-Q Advantage A10 water purification system (Merck, Darmstadt, Germany).
Study Design. The goal of this study was to assess the migration-time reproducibility of CE-MS for metabolomics and determine the most suitable approach for metabolite annotation by comparing RMT versus μeff in standardized condition of BGE. Changes in BGE composition (and thus pH and ionic strength) are one of the main sources of variability in separation in CE across laboratories. BGE in CE-MS-based metabolomics studies often use volatile buffers such as ammonium acetate/
formate, acetic acid, and formic acid.30−32Over the past few years, the use of 10% acetic acid gained interest for the efficient profiling of cationic metabolites by CE-MS.33−35This BGE is relatively easy to prepare and does not require pH adjustment.
Moreover, in comparison to formic acid based BGE, it generates low CE currents, making it more suitable for the sheathless interface and also interesting for anionic metabolic profiling due to its slightly higher pH.36,37Though it is not a strict buffer solution, this BGE can be used the whole day for analyses.
Although the replenishment of the BGE is recommended before each analysis batch,38it has been shown that 10% acetic acid can be conserved over an extended period, giving consistentμeff.28 Therefore, the present work adopted 10% acetic acid (pH∼2.2)
as the BGE, which was prepared independently in each participating laboratory.
For maximal impact, this interlaboratory study involved 20 different CE-MS platforms across 17 different laboratories. Each laboratory was provided with a set of 7 samples, including one cationic mix of 23 compounds in water (21 cationic metabolites and 2 internal standards,Table S1) and six samples prepared by mixing the standard solution with different levels of matrices extracted from human plasma and urine subjected to null, 5- and 10-fold dilution, separately. All the samples included para- cetamol and procaine as markers for EOF time. To facilitate adoptability, our goal was to minimize or avoid modifications to routine practices of each lab by providing a freedom in experimental conditions and CE-MS instruments used, thereby making this study design unique in comparison to previous ring trials.39−41
Becauseμeffis only dependent on the BGE composition, its preparation and the hydrodynamic injection mode without stacking were imposed to every participant. Stacking in CE is performed by changing the sample and/or separation conditions to induce a change in analyte velocity. In this study, all participants have been requested to use CE-MS separation conditions without implementing a stacking procedure, including the use of electrokinetic injection (the latter being selective to high-mobility compounds). Other parameters, such as capillary length, capillary diameter, voltage, pressure, or ESI source parameters, were left to the discretion of each group. For minimal statistical treatment, every sample was analyzed in technical triplicates, and the injection order was at the discretion of the participants. The nature of each sample (i.e., matrix composition and a neutral marker for EOF time) was communicated to the different groups to guide procedures in capillary rinsing between runs and total acquisition time.
Samples. Stock solutions of the analyte standards were prepared in water at a concentration of 1 mg/mL. Paracetamol was included at 3 mg/mL to aid signal detection for marking the EOF time. The stock solutions were stored at −20 °C until usage. The standards were prepared by diluting the stock solutions in water to 20μg/mL for every compound, except paracetamol (30μg/mL). Pooled human plasma was obtained from Sanquin (Amsterdam, The Netherlands). In 2 mL Eppendorf tubes with 500μL plasma, 1000μL of MeCN was added for protein precipitation, assisted by shaking for 5 min at 12000g on an orbital shaking table. After centrifugation at 12000g for 5 min at 4°C, 1800 μL of supernatant was later collected from each tube and combined together. The combined supernatant was then split into aliquots of 1800μL, which were evaporated to dryness using a SpeedVac and reconstituted with 600μL of the standard solution. Dichloromethane (400μL) was mixed with 500μL of the reconstituted samples. After agitation for 5 min, 450μL of the aqueous phase was collected andfiltered through centrifugal ultrafilters with a 3 kDa cutoffmembrane from Millipore (Milford, MA, USA) at 12,000gfor 2 h at 4°C.
Thefiltrates from different tubes were combined together. The resulting contaminant’s concentrations (excluding lipids and proteins) of this solution were supposed to be identical to the raw plasma. Five- and ten-time dilutions of this filtrate were prepared via dilution using the water-based standard solution.
Finally, the three samples containing different levels of extracted plasma matrix were split into 100μL aliquots and stored at−80
°C until shipment over dry ice.
The pooled urine samples were obtained from a group of healthy volunteers. In order to produce a sufficient number of
samples, multiple aliquots were prepared in parallel. Briefly, 1000 μL of pooled urine was evaporated to dryness with a SpeedVac and then reconstituted with the standard solution in water. The reconstituted samples were ultrafiltrated through a 3 kDa cutoffmembrane at 12,000gfor 2 h at 4°C, followed by the merging of all the filtered solutions. The resulting solution contains the same contaminant content as raw urine. Five- and ten-time dilutions were prepared similarly as plasma-based samples via dilution in the standard solution. Finally, the three urine-based samples were split into 100μL aliquots and stored at
−80°C until shipment in dry ice.
BGE Preparation.Every participating laboratory used 10%
acetic acid as the BGE, prepared following the same protocol to aid reproducibility. Briefly, approximately 80 mL of MS grade water wasfirst added in a 100 mL volumetricflask, followed by the addition of 10.00 mL acetic acid (MS grade). The BGE preparation was completed by further adding water until the gauge line.
Instrumentation.Seventeen laboratories, with 20 different CE-MS platforms in total, were involved in this interlaboratory study, of which 11 systems employed a sheath−liquid (SL) interface and 9 employed a sheathless interface for coupling CE to MS. Among them, 10 platforms used a sheath−liquid interface based on a coaxial tube interface from Agilent Technologies. Except for one platform using CESI 8000 plus capillary electrophoresis system with a sheathless CE−ESI interface, all the other platforms with a coaxial sheath-flow ESI interface used a custom-built CE-ESI platform or the Agilent 7100 capillary electrophoresis system (Agilent Technologies, Waldbronn, Germany). The SL interface was compatible with a large variety of operational conditions, therefore a variety of protocols were used during this study. Fused silica capillary with internal diameters of 40 or 50μm and different lengths (from 60 to 105 cm) were used with the sheath−liquid interface across the laboratories. During this study, each lab used their own (preferred) sheath−liquid composition and flow-rate. The sheath−liquid-based CE systems were coupled to various types of mass spectrometers from different manufacturers, namely, the 6510, 6540, 6550, 6560 QTOF, 6230 TOF, and 6490 QqQ from Agilent (Santa Clara, CA) as well as the Impact HD and maXis-3G QTOFMS from Bruker (Bremen, Germany).
The other CE-MS system consisted of a homemade CE system and a custom-built low-flow sheath−liquid interface coupled to a Bruker Impact HD QTOF (Bremen, Germany). On this platform a fused silica capillary of 40μm internal diameter and 105 cm length was used,42,43and theflow-rate of the sheath− liquid was 0.6μL/min, whereas in commercial sheath−liquid interfaces, the sheath−liquid is typically provided at aflow rate in the range from 3 to 10μL/min.
The remaining 9 platforms made use of a sheathless interface with a porous tip, which was coupled to MS via a Nanospray source. This interface obtained from AB Sciex (Brea, CA), employed a silica capillary with a 30μm internal diameter and a 91 cm length and required a CESI 8000 plus capillary electrophoresis system also provided by AB Sciex. The CESI interface is compatible with a large variety of nanoESI sources.
Consequently, in addition to AB Sciex mass spectrometers (TripleTOF 6600, 5600, QTrap 6500, 6500 plus QQQ), the CESI interface has been used during this study on some other MS brands, such as Bruker (MicrOTOF-Q II and Impact quadrupole time-of-flight) and Thermo Fisher (Q-Exactive HF). Whereas the sheath−liquid interfaces were used with short ramp up of voltage (from 1 to 0.5 min), due to its original design,
the sheathless interface required longer voltage ramps for the sake of current stability (from 1 to 2 min). Apart from the large variety of instrumentation used, each laboratory used their own capillary conditioning and washing procedure. Both capillary and room temperatures used during analyses by different laboratories ranged from 20 to 25°C. More details about the experimental conditions used with each platform are given in Table S2.
Data Processing.Initially, 17 groups were involved in this Metabo-ring trial. One data set was triaged as peak widths about 5 min at baseline were obtained which is unusual for capillary electrophoretic separations of small molecules. Therefore, this data set was excluded from further data processing. The primary MS data were received and centralized as manufacturer raw data and processed using Skyline.44 The data files from Bruker instruments were converted into mzML format using MSConvert45prior to their import into Skyline.
For robust and transposable results from one laboratory to another, a two-marker conversion was used for μeff determi- nation using an in-house software. Paracetamol (μeff= 0 mm2 kV−1min−2) and procaine (μeff= 1559 mm2kV−1min−1) were used as references for μeff calculation.36,46 For accurate μeff
measurements, the migration time has to be considered from the start of voltage application. Therefore, when necessary, the migration time was corrected to synchronize the MS acquisition with the voltage start. For the same purpose, the voltage ramps have also been considered during the conversion into mobility.46 RMTs were calculated using procaine as a reference compound.
Bias represents the deviation of a measured value (Xm) (here RMT orμeff) to a reference (Xr). For this purpose, the average μeff and RMT (Table S1) values measured from standard solution were used as reference or baseline value for bias calculation (eq 1).
X X
bias (%) mX r
r
= −
(1) When possible, leucine and isoleucine were processed as two distinct peaks, otherwise the same values were attributed to both compounds.
■
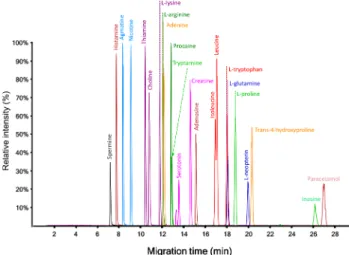
RESULTS AND DISCUSSIONSRelevance of Standardization of BGE Preparation.The present work adopted 10% acetic acid (pH∼2.2) as the BGE, which was prepared independently in each participating laboratory. Figure 1 shows an electropherogram obtained for the analysis of a standard mixture of cationic metabolites by sheath−liquid CE-MS using 10% acetic acid as BGE, clearly indicating that a high separation efficiency is provided by the use of this BGE.
Repeatability and reproducibility were quantified based on the data collected from 19 CE-MS platforms (Figure 2). The intralaboratory repeatability of the measurements of bothμeff
and RMT was typically below 1% for the test compounds in water for three consecutive analyses. The average reproducibility of these parameters was about 4.3% and 5.7%, respectively, with a maximum observed for inosine in both cases. Therefore, these findings clearly indicate the presence of a significant contribution of the interlaboratory variability, leading to higher values of relative standard deviation (RSD) for reproducibility.
To find the main source for the observed variation, we determined the bias of each compound as measured by each individual analytical platform.Figure 2reveals a relatively high
degree of variation, especially for the slower-migrating compounds (longer migration times). This is expected since for a constant measurement uncertainty, the relative error increases as the reference values get closer to 0, as it is the case in theμeffscale (Table S1).
Interestingly, three data sets presented a lowerμefffor the late- migrating compounds (i.e.,L-isoleucine,L-leucine,L-tryptophan,
L-glutamine,L-proline,L-neopterin, trans-4-hydroxyproline, and inosine) as compared to the data obtained by the other 16 CE- MS platforms (Figure 2). Sinceμeffis theoretically influenced by the physicochemical properties of the BGE only, this phenomenon was explained by variation in BGE preparation.
Indeed, slow-migrating cationic compounds usually present a low electrical charge due to their basic functions with low pKaor due to presence of an acidic function with high pKa. Consequently, their μeff is greatly influenced by any slight variation of the acidity of the BGE. Therefore, with a pKaof 2.74, inosine was the slowest compound and also the compound with Figure 1.Typical profile obtained for the analysis of a standard mixture of cationic metabolites by CE-MS (platform 19, seeTable S2) using 10% acetic acid as BGE.
Figure 2. Individual bias to the average and interlaboratory reproducibility ofμeffas obtained for the analysis of cationic metabolite standards by 19 CE-MS platforms. Green and red lines mark bias thresholds at±5 and±10%, respectively. Metabolites are presented in decreasing mobility order from left to right.
a relatively highμeffvariability. Consequently, results from these 3 platforms were triaged from further data analysis in the rest of the study (Table S2).
Effective Electrophoretic Mobility vs Relative Migra- tion Time. It is relatively feasible to mitigate variations in migration time resulting from the BGE with added control over buffer composition. While it is possible to control suction effect from the ionization source, it may be difficult to tackle the adsorption of matrix components onto the inner capillary wall.28,47,48To correct for these sources of variability, the most popular method is the use of RMT.40,49,50 This approach consists of comparing the velocity of the analyte (vanalyte) to that of an internal standard (IS) (vIS). Both velocities are explained by the electrophoretic movement of BGE and their electro- phoretic movement (μEOF and μeff, respectively) under an electricfield (E) as well as the hydrodynamic movement of the BGE (vhydrodynamic), such siphoning between the position of the inlet and the outlet of the CE capillary tip, the sheath flow surrounding of the CE capillary in theESIsource, the close-by vacuum of the atmospheric interface of the mass spectrometer, and pressure that may be applied during the separation. As expressed in eq 2, the hydrodynamic phenomena exert an additive effect instead of a proportional one and, therefore, they cannot be accurately corrected by a ratio approach, making the RMT approach intrinsically incorrect.
v v
E v
E v
RMT
( )
( )
analyte IS
eff EOF hydrodynamic
eff EOF hydrodynamic
analyte
IS
μ μ
μ μ
= =
× + +
× + +
(2) A correction based on RMT can be powerful for compounds migrating in proximity to the IS as they are subject to the same variation of the hydrodynamic phenomenon. However, this approach has limited ability to correct the migration of compounds far from the IS.28On the other hand,μeffdepends on the hydrodynamic radius (r), the ionic charge of the compounds (q), and the viscosity of the BGE (η) (eq 3).
q r
eff 6 μ = πη
(3)
Therefore, μeff is independent of BGE velocity and is only influenced by its physicochemical properties. This parameter is measurable using a neutral marker combined with the experimental conditions. In this study, we have chosen for a conversion based on two markers (c.a. procaine and para- cetamol) in order to obtainμeffvalues which are independent of the operational conditions across the laboratories, such as capillary length, electricfield, and temperature.46,51
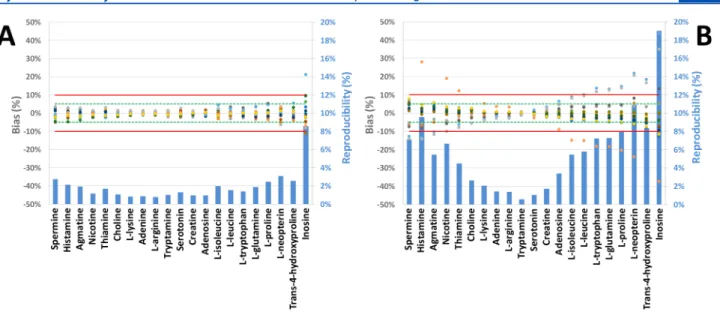
Indeed, our measurements confirmed the viability of usingμeff
as depicted inFigure 3; theμeffpresented a bias below 3.1% for all compounds except for inosine, while for the same set of metabolites, RMT showed bias up to 11%. For compounds such as tryptophan,μeffpresented a variation up to 5-times lower than the corresponding RMT. Interestingly, while the reproducibility of μeff remained stable in a range from 0.8 to 3.1% for compounds with high and medium μeff, RMTs trended with migration time. Indeed, as shown in Figure 3B, minimal dispersion of the RMT values was observed for the compounds with migration time similar to that of the IS, whereas metabolites with extreme RMT presented with a high interlaboratory variability.
As the approach using the in-house metabolite library is based on the relative error to a reference value (i.e., the averageμeff), it is important to observe the bias of each parameter. As shown in Figure 3A, excluding inosine, 98% of theμeffmeasurements are within a 5% bias limit, while 6 platforms presented RMT outside those limits (Figure 3B), with the maximal bias up to 28%. These results confirm the theoretical normalization power of theμeff
conversion of MT in comparison to RMT, especially in the context of creating an interlaboratory database.
Influence of Sample Composition. High chemical complexity in plasma and urine are known to challenge molecular identifications and quantification due to matrix effects as well as instrument performance and longevity. In CZE, it is well-known that the ionic strength in the sample zone influences the migration speed of the compounds at the start of the separation. Therefore, high salt concentrations in such complex biological samples can lead to lower signal-to-noise ratios due to peak broadening and distortions in peak shapes and shifts in migration indices (migration time, RMT, andμeff).
Figure 3.Individual bias and interlaboratory variability ofμeff(A) and RMT (B) as determined for the analysis of standard metabolite mixture by 16 CE-MS platforms. The green and red lines denote a 5% and 10% threshold, respectively. Metabolites are presented in decreasing mobility order from left to right.
While a “dilute and shoot” approach is viable for urine, deproteinization is usually necessary for plasma performed before analysis as preventive measures. Deproteinization is mostly performed in organic solvents (e.g., methanol or acetonitrile), followed by rigorous vortex shaking and an evaporation-to-dryness of the supernatant after which the
dried extract is reconstituted into an appropriate solvent and volume for the follow-up instrumental analysis.52 However, these purification steps do not adequately address high salt content in urine and plasma.
To evaluate the influence of sample conductivity, samples with different dilutions of urine and plasma matrices were Figure 4.Individual bias and interlaboratory variability ofμefffor cationic metabolites in complex biological matrixes: plasma (A, C, and E) and urine (B, D, and F) at three different concentrations (undiluted: A and B; 5-times dilution: C and D; 10-times dilution: E and F) by 16 CE-MS platforms.
Metabolites are presented in decreasing mobility order from left to right.
analyzed. These concentrations represented an equivalent of undiluted, 5- and 10-times dilution of the biologicalfluids. As shown in Figure 4, the μeff reproducibility remained globally unaffected irrespective of the type and concentration of the biological matrix. However, some trends of bias can be observed when platforms are considered individually for each metabolite.
Fast-migrating compounds (e.g., spermine, histamine, agmatine, and nicotine) presented a bias up to 18% in both undiluted plasma and urine samples (Figure 4A,B). As highlighted in Figure 4C,E and D,F for μeff and RMT, respectively, these deviations to the baseline decrease with concentration of the matrix (see the dilution factor).
We explain these variations by deformations of the peak for the 4 fastest-migrating metabolites. With migration in a close proximity to the sodium peak, these compounds experience peak broadening. In some extreme cases, the ion suppression induced by sodium can suppress a part of the peak leading to an incorrect detection of its apex (seeFigure S1). As shown inFigure 4C,E, with the exception of inosine, 15 platforms presented a bias below 5% and one with a bias below 7% in 5-times diluted plasma. Further dilution of the samples (10-times) led to bias below 5% for all platform and compounds, except for inosine due to slight variation in BGE composition as discussed above.
Concerning urine, results were highly similar to only one CE platform presenting a bias above 5% from samples diluted 5-fold, excluding inosine. However, as shown inFigure 4F, one platform presented higher deviation for spermine compared to more concentrated samples (Figure D). No explanation has been found so far to explain this deviation in the 10-fold diluted samples while no drift was observed in the 5-fold dilution of urine.
Proposed: Metabolite Identification Guidelines Based on a Common Library.This work demonstrated the utility of an interlaboratory CE-MS database to enhance metabolomics.
With the use of standardized BGE conditions (10% acetic acid here), conversion from migration times to μeff was found to efficiently normalize separation between 13 different laborato- ries with interlaboratory variability below 3.1% for 20 of the 21 compounds considered.
For sake of comparison with gold standard in feature annotation in metabolomics, collisional cross section are among the most reproducible parameters with interlaboratory variation in the range of 2%36,41,53and 5% and are usually the threshold for identification confirmation.6,54Although HILIC is a powerful method to separate polar compounds, deviation of the retention time up to 10% to in-house databases are usually considered for feature annotation.6
As afirst approach, we propose that such a scoring system can be based on different ranges of bias betweenμeffmeasurements andμeffvalues in databases (Table 1). Such databases should be built on a reliable manner, taking into consideration multiple technical replicates, performed in multiple laboratories, and involving different instruments. Using 10% acetic acid as the BGE, the deviation to the consensus value below 10% was easily
achieved for most metabolites in complex biological matrices. By using a system suitability test based on a short panel of compounds with different migration speeds, we envision it possible to test the BGE and assess whether it is performing conformed to the database. For example, our data here exemplified μeff measurements with a bias below 5%, thus provided an added piece of information to credential compounds and aid identifications (Table 1). Further, credentialing may consider electrophoretic migration for addedfidelity.
As the mobility of slow-migrating compounds is more dependent on the differences of physicochemical properties of the BGE, conversion to μeff overestimates relative bias and reproducibility. For instance, in the case of inosine, μeff
presented a considerably low absolute deviation on all platforms with a maximum deviation about±10 mm2kV−1min−1(Table S1). Therefore, the use of absolute thresholds in μeff
29 may enhance identification confidence for slow-migrating metabo- lites. In the presence of standardized experimental conditions, the normalization to and absolute use ofμeffappears to provide an added piece of compound-dependent information to aid the identification of metabolites.
Next to the μeff, this study also highlights the annotation capability of RMT, comparable to retention time in HILIC.6 Although the use of RMT shows interlaboratory variability and bias below 10% for a very large majority of the compounds and platforms, it has to be used cautiously since few platforms presented very large deviations (up to 30%).
■
CONCLUSIONSThis study encompassing 13 laboratories and 16 platforms spanning 11 countries and 2 continents found CE-MS a robust and reproducible technology for metabolomics. Despite major variations in experimental conditions, CE instruments and methods, CE-ESI ion sources, and even users, conversion of migration times intoμeffreduced variability from 10.9% on RMT to 3.1% in the μeff scale using the same BGE composition.
Tabulatingμeffunder specific BGE compositions into universal database adds another compound-dependent and reliable value, thus complementing traditional MS-MS/MS databases in metabolomics (e.g., HMDB55 and Metlin56). The use ofμeff
requires only a limited number of internal standards (e.g., two different compounds used here) while substantially enhancing compound identification in metabolomics via a targeted or untargeted approach. On the basis of these results, we propose here guidelines by using a scoring approach based on different μeff criteria to support feature annotation in metabolomics.
Although this study focused on cationic small molecules only, we anticipate that this approach also is easily extendable to anionic metabolites, including but not limited to small organic acids, nucleotides, and sugar phosphates.29 As LC-based separations are often challenged for such compounds, we anticipate this Metabo-ring trial to invigorate the use of CE-MS with theμeff-based approach in metabolomics and otherfields.
■
ASSOCIATED CONTENT*sı Supporting Information
The Supporting Information is available free of charge at https://pubs.acs.org/doi/10.1021/acs.analchem.0c03129.
(Table S1) Physicochemical properties of the metabolites of interest (*: from ChemAxon, chemicalize.com, consulted the 16th of July 2020) and (Figure S1) Table 1. Proposition of Confidence Levels for Annotation of
Features Usingμeffby CE-MS
confidence level
>100
mm2kV−1min−1 <100 mm2kV−1min−1
high <5% <10% or±10
medium 5% <x< 10% 10% <x< 20% or±20 low (rejected hypothesis) >10% >20% or >±20
extracted ion electropherograms of spermine (m/z 203.2230) in nondiluted plasma samples obtained by CE-MS across 5 different laboratories (PDF)
(Table S2) Detailed CE-MS parameters (XLSX)
■
AUTHOR INFORMATION Corresponding AuthorsNicolas Drouin−Division of Systems Biomedicine and Pharmacology, Leiden Academic Centre for Drug Research, Leiden University, 2311 G Leiden, The Netherlands;
Email:n.f.p.drouin@lacdr.leidenuniv.nl
Rawi Ramautar−Division of Systems Biomedicine and Pharmacology, Leiden Academic Centre for Drug Research, Leiden University, 2311 G Leiden, The Netherlands;
orcid.org/0000-0002-1673-4848; Phone: +31-71- 5276805; Email:r.ramautar@lacdr.leidenuniv.nl Authors
Marlien van Mever−Division of Systems Biomedicine and Pharmacology, Leiden Academic Centre for Drug Research, Leiden University, 2311 G Leiden, The Netherlands
Wei Zhang−Division of Systems Biomedicine and Pharmacology, Leiden Academic Centre for Drug Research, Leiden University, 2311 G Leiden, The Netherlands; orcid.org/0000-0002- 8320-3959
Elena Tobolkina−School of Pharmaceutical Sciences and Institute of Pharmaceutical Sciences of Western Switzerland, University of Geneva, 1211 4 Geneva, Switzerland
Sabrina Ferre−School of Pharmaceutical Sciences and Institute of Pharmaceutical Sciences of Western Switzerland, University of Geneva, 1211 4 Geneva, Switzerland
Anne-Catherine Servais−Laboratory for the Analysis of Medicines, Center for Interdisciplinary Research on Medicines (CIRM), University of Liege, B-4000 Liè ge, Belgium̀
Marie-Jia Gou−Laboratory for the Analysis of Medicines, Center for Interdisciplinary Research on Medicines (CIRM), University of Liège, B-4000 Liège, Belgium
Laurent Nyssen−Laboratory for the Analysis of Medicines, Center for Interdisciplinary Research on Medicines (CIRM) and Department of Clinical Chemistry, Center for Interdisciplinary Research on Medicines (CIRM), University of Liège, B-4000 Liège, Belgium
Marianne Fillet−Laboratory for the Analysis of Medicines, Center for Interdisciplinary Research on Medicines (CIRM), University of Liège, B-4000 Liège, Belgium
Guinevere S.M. Lageveen-Kammeijer−Leiden University Medical Center, Center for Proteomics and Metabolomics, 2300 RC Leiden, The Netherlands; orcid.org/0000-0001-7670- 1151
Jan Nouta−Leiden University Medical Center, Center for Proteomics and Metabolomics, 2300 RC Leiden, The Netherlands
Andrew J. Chetwynd−School of Geography Earth and Environmental Sciences, University of Birmingham, Edgbaston, Birmingham B15 2TT, U.K.; orcid.org/0000-0001-6648- 6881
Iseult Lynch−School of Geography Earth and Environmental Sciences, University of Birmingham, Edgbaston, Birmingham B15 2TT, U.K.; orcid.org/0000-0003-4250-4584
James A. Thorn−AB Sciex UK Ltd, Warrington, Cheshire WA1 1RX, U.K.
Jens Meixner−Agilent Technologies R&D and Marketing GmbH
&Co. KG, 76337 Waldbronn, Germany
Christopher Lößner−AB Sciex, 64293 Darmstadt, Germany Myriam Taverna−UniversitéParis-Saclay, CNRS, Institut
Galien Paris-Saclay, 92296 Chatenay-Malabry, France; Institut̂ Universitaire de France, 75231 CEDEX 05 Paris, France Sylvie Liu−UniversitéParis-Saclay, CNRS, Institut Galien Paris-
Saclay, 92296 Châtenay-Malabry, France
N. Thuy Tran−UniversitéParis-Saclay, CNRS, Institut Galien Paris-Saclay, 92296 Châtenay-Malabry, France
Yannis Francois−Laboratoire de Spectrometrie de Masse des̀ Interactions et des Systémes (LSMIS) UMR 7140 (Unistra- CNRS), Universitéde Strasbourg, 67081 CEDEX Strasbourg, France; orcid.org/0000-0002-8776-071X
Antony Lechner−Laboratoire de Spectrometrie de Masse des̀ Interactions et des Systémes (LSMIS) UMR 7140 (Unistra- CNRS), Universitéde Strasbourg, 67081 CEDEX Strasbourg, France
Reine Nehmé−Institut de Chimie Organique et Analytique (ICOA), CNRS FR 2708 - UMR 7311, Universitéd’Orléans, 45067 Orléans, France
Ghassan Al Hamoui Dit Banni−Institut de Chimie Organique et Analytique (ICOA), CNRS FR 2708 - UMR 7311, Université d’Orléans, 45067 Orléans, France
Rouba Nasreddine−Institut de Chimie Organique et Analytique (ICOA), CNRS FR 2708 - UMR 7311, Universitéd’Orléans, 45067 Orléans, France
Cyril Colas−Institut de Chimie Organique et Analytique (ICOA), CNRS FR 2708 - UMR 7311, Universitéd’Orleans,́ 45067 Orléans, France; Centre de Biophysique Moléculaire, CNRS-Universitéd’Orleans, UPR 4311, 45071 CEDEX 2́ Orléans, France; orcid.org/0000-0003-1651-6813 Herbert H. Lindner−Institute of Clinical Biochemistry,
Innsbruck Medical University, A-6020 Innsbruck, Austria;
orcid.org/0000-0003-1262-9976
Klaus Faserl−Institute of Clinical Biochemistry, Innsbruck Medical University, A-6020 Innsbruck, Austria
Christian Neusüß−Faculty of Chemistry, Aalen University, 73430 Aalen, Germany
Manuel Nelke−Faculty of Chemistry, Aalen University, 73430 Aalen, Germany
Stefan Lämmerer−Faculty of Chemistry, Aalen University, 73430 Aalen, Germany
Catherine Perrin−Institut des Biomolécules Max Mousseron (IBMM), UMR 5247-CNRS-UM-ENSCM, Universitéde Montpellier, 34093 CEDEX 5 Montpellier, France Claudia Bich-Muracciole−Institut des Biomolécules Max
Mousseron (IBMM), UMR 5247-CNRS-UM-ENSCM, Universitéde Montpellier, 34093 CEDEX 5 Montpellier, France Coral Barbas−Centre for Metabolomics and Bioanalysis
(CEMBIO), Department of Chemistry and Biochemistry, Facultad de Farmacia, Universidad San Pablo-CEU, CEU Universities, Urbanización Monteprincipe, 28660 Madrid,́ Spain; orcid.org/0000-0003-4722-491X
Ángeles López Gonzálvez−Centre for Metabolomics and Bioanalysis (CEMBIO), Department of Chemistry and Biochemistry, Facultad de Farmacia, Universidad San Pablo- CEU, CEU Universities, Urbanización Monteprincipe, 28660́ Madrid, Spain
Andras Guttman−Horváth Csaba Memorial Laboratory of Bioseparation Sciences, Research Center for Molecular Medicine, Faculty of Medicine, Doctoral School of Molecular Medicine, University of Debrecen, H-4032 Debrecen, Hungary; Translation Glycomics Group, Research Institute of Biomolecular and Chemical Engineering, University of Pannonia, Veszprem H-
8200, Hungary; orcid.org/0000-0002-7838-082X Marton Szigeti−Horváth Csaba Memorial Laboratory of
Bioseparation Sciences, Research Center for Molecular Medicine, Faculty of Medicine, Doctoral School of Molecular Medicine, University of Debrecen, H-4032 Debrecen, Hungary; Translation Glycomics Group, Research Institute of Biomolecular and Chemical Engineering, University of Pannonia, Veszprem H- 8200, Hungary; orcid.org/0000-0001-5136-8479 Philip Britz-McKibbin−Department of Chemistry and
Chemical Biology, McMaster University, Hamilton, Ontario L8S 4M1, Canada; orcid.org/0000-0001-9296-3223
Zachary Kroezen−Department of Chemistry and Chemical Biology, McMaster University, Hamilton, Ontario L8S 4M1, Canada
Meera Shanmuganathan−Department of Chemistry and Chemical Biology, McMaster University, Hamilton, Ontario L8S 4M1, Canada
Peter Nemes−Department of Chemistry&Biochemistry, University of Maryland, College Park, Maryland 20742, United States; orcid.org/0000-0002-4704-4997
Erika P. Portero−Department of Chemistry&Biochemistry, University of Maryland, College Park, Maryland 20742, United States
Thomas Hankemeier−Division of Systems Biomedicine and Pharmacology, Leiden Academic Centre for Drug Research, Leiden University, 2311 G Leiden, The Netherlands;
orcid.org/0000-0001-7871-2073
Santiago Codesido−School of Pharmaceutical Sciences and Institute of Pharmaceutical Sciences of Western Switzerland, University of Geneva, 1211 4 Geneva, Switzerland
Víctor González-Ruiz−School of Pharmaceutical Sciences and Institute of Pharmaceutical Sciences of Western Switzerland, University of Geneva, 1211 4 Geneva, Switzerland; Swiss Centre for Applied Human Toxicology (SCAHT), 4055 Bâle, Switzerland; orcid.org/0000-0001-7204-2363
Serge Rudaz−School of Pharmaceutical Sciences and Institute of Pharmaceutical Sciences of Western Switzerland, University of Geneva, 1211 4 Geneva, Switzerland; Swiss Centre for Applied Human Toxicology (SCAHT), 4055 Bâle, Switzerland Complete contact information is available at:
https://pubs.acs.org/10.1021/acs.analchem.0c03129 Author Contributions
#N.D. and M.v.M. contributed equally. The manuscript was written through contributions of all authors. All authors have given approval to thefinal version of the manuscript.
Notes
The authors declare no competingfinancial interest.
■
ACKNOWLEDGMENTSThe Vidi grant scheme of The Netherlands Organization of Scientific Research (NWO Vidi 723.016.003) is acknowledged for thefinancial support of a part of this Metabo-ring study and for thefinancial support of M.v.M. and W.Z. N.D. acknowledges the financial support from Horizon 2020 Marie Sklodowska- Curie CO-FUND (Grant Agreement no: 707404). P.N.
acknowledges support from the National Science Foundation (award IOS-1832968), the National Institute of Health (R35GM124755), and the Arnold and Mabel Beckman Foundation (Young Investigator Grant). A.J.C., I.L., and J.A.T. acknowledge the European Commission via Horizon 2020 project ACEnano (Grant H2020-NMBP-2016-720952).
P.B.-M. acknowledges funding from the Natural Sciences and Engineering Research Council of Canada and Genome Canada.
M.S. and A.G. gratefully acknowledge the grants of the National Research, Development and Innovation Office (NN127062, 2018-2.1.17-TÉT-KR-2018-00010). This work was also spon- sored by the BIONANO_GINOP-2.3.2-15-2016-00017 proj- ect. This is contribution #173 from the Horvath Csabá Memorial Laboratory of Bioseparation Sciences. A.L. would like to acknowledge the CNRS (UMR 7140), University of Strasbourg. G.A.H.D.B., C.C., and R.N. would like to thank the Region Centre Val de Loire and the Labex SynOrg (ANR-11-́ LABX-0029) forfinancial support. Á.L.G. and C.B. acknowledge the Ministry of Science, Innovation and Universities of Spain and FEDER funds (MICINN) (ref. RTI2018-095166-B-I00), and the Autonomous Community of Madrid (NOVELREN- CM. ref: B2017/BMD3751). S.C. greatly acknowledges the Swiss National Science Foundation through Grant 31003A_166658. F.G. is acknowledged for technical assistance and for her help with shipment of the samples. AB Sciex and Agilent Technologies are acknowledged for their technical support.
■
(1) Mahieu, N. G.; Patti, G. J.REFERENCES Anal. Chem.2017,89, 10397−10406.(2) van Rijswijk, M.; Beirnaert, C.; Caron, C.; Cascante, M.;
Dominguez, V.; Dunn, W. B.; Ebbels, T. M. D.; Giacomoni, F.;
Gonzalez-Beltran, A.; Hankemeier, T.; Haug, K.; Izquierdo-Garcia, J.
L.; Jimenez, R. C.; Jourdan, F.; Kale, N.; Klapa, M. I.; Kohlbacher, O.;
Koort, K.; Kultima, K.; Le Corguille, G.; et al.F1000Research2017,6, 1649.
(3) Rochat, B.J. Am. Soc. Mass Spectrom.2017,28, 709−723.
(4) Damont, A.; Olivier, M.-F.; Warnet, A.; Lyan, B.; Pujos-Guillot, E.;
Jamin, E. L.; Debrauwer, L.; Bernillon, S.; Junot, C.; Tabet, J.-C.;
Fenaille, F.J. Mass Spectrom.2019,54, 567−582.
(5) Nash, W. J.; Dunn, W. B.TrAC, Trends Anal. Chem.2019,120, 115324.
(6) Bergé, M.; Pezzatti, J.; González-Ruiz, V.; Degeorges, L.; Mottet- Osman, G.; Rudaz, S.; Viollier, P. H.eLife2020,9, 9.
(7) Soga, T.; Ohashi, Y.; Ueno, Y.; Naraoka, H.; Tomita, M.; Nishioka, T.J. Proteome Res.2003,2, 488−494.
(8) Soga, T.; Baran, R.; Suematsu, M.; Ueno, Y.; Ikeda, S.; Sakurakawa, T.; Kakazu, Y.; Ishikawa, T.; Robert, M.; Nishioka, T.; Tomita, M.J.
Biol. Chem.2006,281, 16768−16776.
(9) Barbas, C.; Moraes, E. P.; Villasenor, A.J. Pharm. Biomed. Anal.
2011,55, 823−831.
(10) Baidoo, E. E.; Benke, P. I.; Neususs, C.; Pelzing, M.; Kruppa, G.;
Leary, J. A.; Keasling, J. D.Anal. Chem.2008,80, 3112−3122.
(11) Britz-McKibbin, P.Methods Mol. Biol.2011,708, 229−246.
(12) Zhang, W.; Guled, F.; Hankemeier, T.; Ramautar, R.Electro- phoresis2020,41, 360−369.
(13) Drouin, N.; Pezzatti, J.; Gagnebin, Y.; Gonzalez-Ruiz, V.;
Schappler, J.; Rudaz, S.Anal. Chim. Acta2018,1032, 178−187.
(14) Kuehnbaum, N. L.; Britz-McKibbin, P.Chem. Rev.2013,113, 2437−2468.
(15) Miggiels, P.; Wouters, B.; van Westen, G. J. P.; Dubbelman, A.- C.; Hankemeier, T.TrAC, Trends Anal. Chem.2019,120, 115323.
(16) Harada, S.; Hirayama, A.; Chan, Q.; Kurihara, A.; Fukai, K.; Iida, M.; Kato, S.; Sugiyama, D.; Kuwabara, K.; Takeuchi, A.; Akiyama, M.;
Okamura, T.; Ebbels, T. M. D.; Elliott, P.; Tomita, M.; Sato, A.; Suzuki, C.; Sugimoto, M.; Soga, T.; Takebayashi, T. PLoS One 2018, 13, No. e0191230.
(17) Klein, J.; Bascands, J. L.; Mischak, H.; Schanstra, J. P.Kidney Int.
2016,89, 539−545.
(18) Boizard, F.; Brunchault, V.; Moulos, P.; Breuil, B.; Klein, J.;
Lounis, N.; Caubet, C.; Tellier, S.; Bascands, J. L.; Decramer, S.;
Schanstra, J. P.; Buffin-Meyer, B.Sci. Rep.2016,6, DOI: 10.1038/
srep34453.
(19) Siwy, J.; Zurbig, P.; Argiles, A.; Beige, J.; Haubitz, M.; Jankowski, J.; Julian, B. A.; Linde, P. G.; Marx, D.; Mischak, H.; Mullen, W.; Novak, J.; Ortiz, A.; Persson, F.; Pontillo, C.; Rossing, P.; Rupprecht, H.;
Schanstra, J. P.; Vlahou, A.; Vanholder, R.Nephrol., Dial., Transplant 2017,32, 2079−2089.
(20) Pontillo, C.; Mischak, H.Clin. Kidney J.2017,10, 192−201.
(21) Onjiko, R. M.; Moody, S. A.; Nemes, P.Proc. Natl. Acad. Sci. U. S.
A.2015,112, 6545−6550.
(22) Azab, S.; Ly, R.; Britz-McKibbin, P.Anal. Chem.2019,91, 2329−
2336.
(23) Wild, J.; Shanmuganathan, M.; Hayashi, M.; Potter, M.; Britz- McKibbin, P.Analyst2019,144, 6595−6608.
(24) Buscher, J. M.; Czernik, D.; Ewald, J. C.; Sauer, U.; Zamboni, N.
Anal. Chem.2009,81, 2135−2143.
(25) Begou, O.; Gika, H. G.; Wilson, I. D.; Theodoridis, G.Analyst 2017,142, 3079−3100.
(26) Coulier, L.; Bas, R.; Jespersen, S.; Verheij, E.; van der Werf, M. J.;
Hankemeier, T.Anal. Chem.2006,78, 6573−6582.
(27) Nemes, P.; Knolhoff, A. M.; Rubakhin, S. S.; Sweedler, J. V.Anal.
Chem.2011,83, 6810−6817.
(28) González-Ruiz, V.; Gagnebin, Y.; Drouin, N.; Codesido, S.;
Rudaz, S.; Schappler, J.Electrophoresis2018,39, 1222−1232.
(29) Drouin, N.; Pezzatti, J.; Gagnebin, Y.; Gonzalez-Ruiz, V.;
Schappler, J.; Rudaz, S.Anal. Chim. Acta2018,1032, 178−187.
(30) Rojo, D.; Barbas, C.; Lopez-Gonzalvez, A.Methods Mol. Biol.
2019,1859, 253−260.
(31) González-Ruiz, V.; Codesido, S.; Rudaz, S.; Schappler, J.
Electrophoresis2018,39, 853−861.
(32) Kuehnbaum, N. L.; Kormendi, A.; Britz-McKibbin, P. Anal.
Chem.2013,85, 10664−10669.
(33) Sánchez-López, E.; Kammeijer, G. S. M.; Crego, A. L.; Marina, M. L.; Ramautar, R.; Peters, D. J. M.; Mayboroda, O. A.Sci. Rep.2019, 9, DOI: 10.1038/s41598-018-37512-8.
(34) Drouin, N.; Rudaz, S.; Schappler, J.J. Pharm. Biomed. Anal.2018, 159, 53−59.
(35) van Mever, M.; Segers, K.; Drouin, N.; Guled, F.; Heyden, Y. V.;
Van Eeckhaut, A.; Hankemeier, T.; Ramautar, R.Microchem. J.2020, 156, 104949.
(36) Drouin, N.; Mielcarek, A.; Wenz, C.; Rudaz, S.Electrophoresis, 2020.
(37) Gulersonmez, M. C.; Lock, S.; Hankemeier, T.; Ramautar, R.
Electrophoresis2016,37, 1007−1014.
(38) Zhang, W.; Gulersonmez, M. C.; Hankemeier, T.; Ramautar, R.
Journal of visualized experiments: JoVE,2016.
(39) Dispas, A.; Marini, R.; Desfontaine, V.; Veuthey, J. L.; Kotoni, D.;
Losacco, L. G.; Clarke, A.; Muscat Galea, C.; Mangelings, D.; Jocher, B.
M.; Regalado, E. L.; Plachká, K.; Nováková, L.; Wuyts, B.; François, I.;
Gray, M.; Aubin, A. J.; Tarafder, A.; Cazes, M.; Desvignes, C.; et al.J.
Pharm. Biomed. Anal.2018,161, 414−424.
(40) Wenz, C.; Barbas, C.; Lopez-Gonzalvez, A.; Garcia, A.;
Benavente, F.; Sanz-Nebot, V.; Blanc, T.; Freckleton, G.; Britz- McKibbin, P.; Shanmuganathan, M.; de l’Escaille, F.; Far, J.; Haselberg, R.; Huang, S.; Huhn, C.; Pattky, M.; Michels, D.; Mou, S.; Yang, F.;
Neusuess, C.; et al.J. Sep. Sci.2015,38, 3262−3270.
(41) Hernández-Mesa, M.; D’Atri, V.; Barknowitz, G.; Fanuel, M.;
Pezzatti, J.; Dreolin, N.; Ropartz, D.; Monteau, F.; Vigneau, E.; Rudaz, S.; Stead, S.; Rogniaux, H.; Guillarme, D.; Dervilly, G.; Le Bizec, B.
Analytical chemistry2020,92, 5013−5022.
(42) Portero, E. P.; Nemes, P.Analyst2019,144, 892−900.
(43) Onjiko, R. M.; Moody, S. A.; Nemes, P.Proc. Natl. Acad. Sci. U. S.
A.2015,112, 6545.
(44) MacLean, B.; Tomazela, D. M.; Shulman, N.; Chambers, M.;
Finney, G. L.; Frewen, B.; Kern, R.; Tabb, D. L.; Liebler, D. C.;
MacCoss, M. J.Bioinformatics2010,26, 966−968.
(45) Adusumilli, R.; Mallick, P.Methods Mol. Biol.2017,1550, 339−
368.
(46) Codesido, S.; Drouin, N.; Ferre, S.; Schappler, J.; Rudaz, S.;
González-Ruiz, V.ChemRxiv,2020.
(47) Nowak, P. M.; Woźniakiewicz, M.; Gładysz, M.; Janus, M.;
Kościelniak, P.Anal. Bioanal. Chem.2017,409, 4383−4393.
(48) Lee, R.; Ptolemy, A. S.; Niewczas, L.; Britz-McKibbin, P.Anal.
Chem.2007,79, 403−415.
(49) Sugimoto, M.; Hirayama, A.; Robert, M.; Abe, S.; Soga, T.;
Tomita, M.Electrophoresis2010,31, 2311−2318.
(50) Sugimoto, M.; Kikuchi, S.; Arita, M.; Soga, T.; Nishioka, T.;
Tomita, M.Anal. Chem.2005,77, 78−84.
(51) Li, X.-F.; Ren, H.; Le, X.; Qi, M.; Ireland, I. D.; Dovichi, N. J.
Journal of Chromatography A2000,869, 375−384.
(52) Drouin, N.; Rudaz, S.; Schappler, J.Analyst2018,143, 16−20.
(53) Stow, S. M.; Causon, T. J.; Zheng, X.; Kurulugama, R. T.;
Mairinger, T.; May, J. C.; Rennie, E. E.; Baker, E. S.; Smith, R. D.;
McLean, J. A.; Hann, S.; Fjeldsted, J. C.Anal. Chem.2017,89, 9048−
9055.
(54) Reisdorph, R.; Michel, C.; Quinn, K.; Doenges, K.; Reisdorph, N.
Methods Mol. Biol.2020,2084, 55−78.
(55) Wishart, D. S.; Feunang, Y. D.; Marcu, A.; Guo, A. C.; Liang, K.;
Vazquez-Fresno, R.; Sajed, T.; Johnson, D.; Li, C.; Karu, N.; Sayeeda, Z.; Lo, E.; Assempour, N.; Berjanskii, M.; Singhal, S.; Arndt, D.; Liang, Y.; Badran, H.; Grant, J.; Serra-Cayuela, A.; et al.Nucleic Acids Res.
2018,46, D608−D617.
(56) Smith, C. A.; Maille, G. O.; Want, E. J.; Qin, C.; Trauger, S. A.;
Brandon, T. R.; Custodio, D. E.; Abagyan, R.; Siuzdak, G.Ther. Drug Monit.2005,27, 747−751.