Article
Di ff erences in Mineral Phase Associated Soil Organic Matter Composition due to Varying Tillage Intensity
Gergely Jakab1,2,3,* , Tibor Filep1, Csilla Király1, Balázs Madarász1,4 , Dóra Zacháry1 , Marianna Ringer1, Anna Vancsik1, Lilla Gáspár1and Zoltán Szalai1,3
1 Geographical Institute, Research Centre for Astronomy and Earth Sciences, 1112 Budapest, Hungary;
filep.tibor@csfk.mta.hu (T.F.); kiraly.csilla@csfk.mta.hu (C.K.); madarasz.balazs@csfk.mta.hu (B.M.);
zachary.dora@csfk.mta.hu (D.Z.); ringer.marianna@csfk.mta.hu (M.R.); vancsik.anna@csfk.mta.hu (A.V.);
gaspar.lilla@csfk.mta.hu (L.G.); szalai.zoltan@csfk.mta.hu (Z.S.)
2 Institute of Geography and Geoinformatics, University of Miskolc, 3515 Miskolc, Hungary
3 Department of Environmental and Landscape Geography, ELTE University, 1117 Budapest, Hungary
4 Department of Soil Science and Water Management, Faculty of Horticultural Science, Szent István University, 1118 Budapest, Hungary
* Correspondence: jakab.gergely@csfk.mta.hu
Received: 27 September 2019; Accepted: 28 October 2019; Published: 30 October 2019
Abstract:The volume of soil organic matter (SOM) changes, owing to variations in tillage systems.
Conservation tillage (CT) is a useful method for recovering the SOM content of crop fields. However, little is known about the SOM composition of silt- and clay-associated and aggregate-occluded organic matter (OM). The present study aimed at determining the SOM compositions of various SOM fractions in the same Luvisol in a native forest and under ploughing and CT. SOM fractions (silt and clay associated; sand and aggregates associated; restricted OM) were characterized using diffuse reflectance Fourier transform infrared (FTIR) spectroscopy. The size of both the aggregate-occluded and resistant SOM pools increased, owing to the shift in the tillage system to CT for 15 years. As a general trend, the soil organic carbon content was inversely proportional to aromaticity under both crop fields, which supported the preferential mineralization of aliphatic components in each fraction.
The shift in the tillage system could trigger rapid qualitative changes even in the stable restricted carbon pools; nevertheless, it was difficult to distinguish between the role of OM and the mineral composition in the FTIR spectra. In particular, the clay-related organic-mineral complexes could trigger difficulties in the traditional interpretation methods.
Keywords: conservation tillage; ploughing tillage; aromaticity; carbon pools; Fourier transform infrared spectroscopy
1. Introduction
Soil organic matter (SOM) is a mixture of organic components at various degrees of decomposition in the soil. It mainly originates from plant residues and secondary products of the microbiome [1].
As SOM has the highest specific surface area among soil components, it determines numerous physical and chemical properties of the soil [2]. SOM is the primary driver of the cation exchange capacity, aggregate stability, soil structure, hydraulic properties, buffer capacity, and nutrient holding capacity of most mineral soils [3].
The high soil organic carbon (SOC) content of native soils significantly decreases owing to cultivation [4]. Intensive crop production decreases the organic matter (OM) input as it removes the main parts of the plant by harvesting, and directly oxidizes SOM by applying intensive inversion tillage [5–7]. In soil, OM is mineralized by the microbiome, the process of which is generally limited by
Agronomy2019,9, 700; doi:10.3390/agronomy9110700 www.mdpi.com/journal/agronomy
the degree of available oxygen. A large amount of SOM can be mineralized within a decade owing to frequent intensive cultivation [8,9]. Reduced tillage parallel with other conservation techniques is effective in SOM recovery; however, the detailed mechanism is not fully understood [10–12].
SOM consists of various functional pools in terms of carbon stabilization mechanisms [13]. Beyond microbiological activity inhibition through oxygen, moisture, and heat availability, physical protection also can shield SOM against oxidation. This protection is believed to occur via direct organic-mineral complex formation. SOM is stabilized on the surfaces of phyllosilicates, Fe-, Al-, and Mn-oxides, metals, and other clay-sized minerals, thereby creating a quasi-protected SOM pool [13]. This pool is not homogeneous; SOM that reaches the interlayer of clays [14] is much more resistant than that associated with quartz fragments. The other main SOM stabilization process occurs within the aggregates as shelters excluding oxygen from inner OM without direct organic–mineral bonds [15]. This carbon pool is presumed to be less stable compared with the direct mineral-associated SOM; however, the most mobile solid phase SOM is poorly degraded plant tissue without mineral association, which is often called particulate organic matter (POM) or the light fraction. Moreover, since POM mainly consists of fresh decomposed plant litter, its chemical composition is known [16]. In contrast, the composition of aggregate-occluded and mineral phase-associated SOM is not fully known. Previous studies have indicated that clay-associated SOM is generally composed of small molecular weight components and that the aggregate-occluded pool is generally composed of complex macromolecules [16–18].
As aromatic components are more resistant, their enrichment can refer to the increasing residence time of SOM [19] in the generalized order of free POM<occluded SOM<mineral-associated SOM [20].
However, not all the measured data are directly comparable with each other owing to the different methodological approaches. Early studies focused on alkali or water SOM extraction characterization, but these extractions were incomplete and did not represent all the SOM of the pool [21,22]. Therefore, in situ characterization using carbon-13 nuclear magnetic resonance or Fourier transform infrared (FTIR) spectroscopy has often been employed in recent research.
Diffuse reflectance infrared Fourier transform spectroscopy (DRIFT) is a widely used method for determining the OM composition. The method has been tested for peats, composts, isolated humic and fulvic acids, and other relatively well-defined pure organic substances [23,24]. DRIFT is suitable for the analysis of mixed materials, such as soils [25,26], even though the overlapping of peaks triggered by organic–mineral complexes may cause difficulties during interpretation [27]. Beyond qualitative identification, DRIFT is useful for quantitative analysis, as there is no direct relationship between peak intensity and OM concentration; therefore, the various chemical compounds are detectable separately [23]. Thermogravimetry is also a widespread method for OM characterization, but it is mainly used for organic soils because mineral soils do not contain enough OM for reliable qualitative predictions [28]. In contrast, DRIFT is suitable for characterizing the degree of humification of SOM even in mineral soils with low organic carbon content [29]. Even though there is an increasing number of publication that deal with in situ SOM characterization, the role of cultivation on varying soil and climatic conditions is not fully understood.
The present study aimed to determine the SOM compositions of various SOM fractions in the same Luvisol in a native forest (NF) and under ploughing and conservation tillage (CT) based on FTIR spectroscopy. An additional goal was to compare the results with those obtained by water extractions from the same soil fractions provided by Rieder et al. [18]. Our hypotheses were: (i) Shifts in tillage-triggered differences in the in situ SOM composition of the fractions; and (ii) these differences are not the same as those was provided by water extractions.
2. Materials and Methods
2.1. Study Site
The Szentgyörgyvár research site was established in western Hungary (46◦44054.1”N, 17◦08048.4”E) in 2003 to compare ploughing tillage (PT) (on two 1200 m2plots; cultivation based on fall moldboard
plowing) and CT (on two 1200 m2plots; reduced cultivation without inversion leaving at least 30%
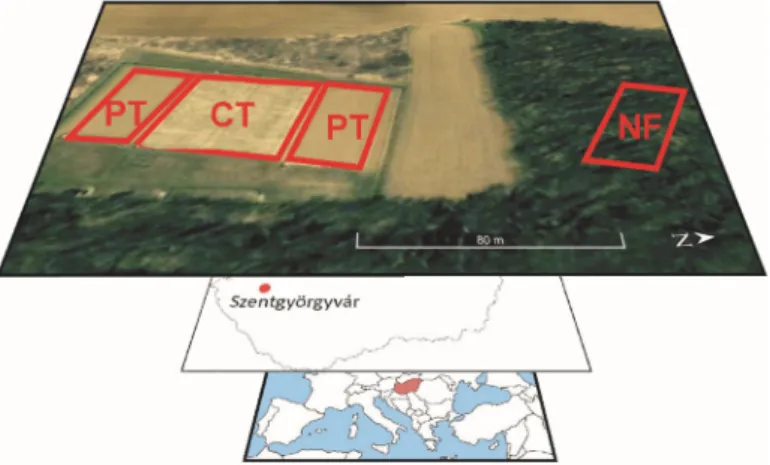
of the plant residues on the surface) at the field scale [30] (Figure1). A NF next to the plots was also sampled as a control. Soil samples were taken from the uppermost soil layer (0–15 cm) of a haplic Luvisol (free of carbonates) formed on sandy loess. The steepness of the plots was 9% to 10%, thereby resulting in a uniform slope. Three composite samples were collected from each land use type, including subsamples from upslope, middle slope, and downslope. A detailed description of the soil properties and tillage operations in the cultivated sites plus the forest site characteristics was presented by Rieder et al. [18]. The climate is subhumid, with a mean annual temperature of 11◦C and precipitation of 628 mm.
Figure 1.Location of the study site with ploughing tillage (PT) and conservation tillage (CT) plots and the native forest (NF) site.
2.2. Soil Fractionation
Soil samples were fractionated according to the method of Zimmermann et al. [31] modified by Poeplau et al. [32]. For this procedure, ultrasonic dispersion was applied with 22 J mL−1of the bulk soil sample (<2 mm) followed by wet sieving to separate grains smaller and larger than 63µm. The fraction
<63µm contained the silt and clay-sized particles (s+c), whereas the grains>63µm were divided in terms of specific weight. particles<1.8 g cm−3were the POM fraction and particles>1.8 g cm−3were considered the sand and aggregates (S+A) fraction. In addition to this physical fractionation, the SOM of the s+c fraction was divided into further fractions based on its chemical reactivity. To oxidize the reactive part of the s+c-related SOM, 6% NaOCl was used repeatedly, thereby obtaining chemically and biologically resistant carbon (rSOC).
2.3. Analytical Measurements
The SOC content was measured by applying dry combustion at 900◦C [33] using a Shimadzu TOC-L with an SSM 5000A Solid Sample Combustion Unit (Shimadzu Corp., Tokyo, Japan). Particle size distribution was measured after 0.5 M Na4P2O7treatment and 15 min of ultrasonic disaggregation using laser diffraction. A Fritsch Analysette 22 MicroTec Plus (Fritsch GmbH, Idar-Oberstein, Germany) device was used in the range of 0.2–2000.0µm. Particle sizes were calculated by applying the Mie theory with a refractive index of 1.45 [34]. To compare the particle size distribution results of this study with those measured by the pipette method, the higher boundary of the clay fraction was chosen as 5µm [35].
The SOM composition was measured by FTIR spectroscopy (Vertex 70, Bruker Optics Ltd., Coventry, UK) in DRIFT mode using an RT-DLaTGS detector. Soil samples were air dried and passed through a 2 mm sieve. Each sample was measured with 64 scans between 4000 and 400 cm−1, with a spectral resolution of 4 cm−1. From each fraction, three parallel samples (approximately 200 mg) were placed into the sample holder cup after 24 h of drying at 60◦C [36]. The spectra were corrected for H2O and CO2using Bruker Opus 7 software (Bruker Optics Ltd., Coventry, UK), corrected for
baseline shifts, and then smoothed (factor of 11). All spectra were analyzed for peak intensities of the representative wavenumbers and measured as vertical distances from the baseline. Nine wavenumbers typical in the samples (814, 1420, 1531, 1612, 1794, 1865, 2848, 2918, and 3400 cm−1) were investigated and interpreted as proxies for various bond types or functional groups [23,25,37–40]. The single peak heights referring to a wavenumber were presented as the relative absorbance (rA; rA of a certain wavenumber is equal to the percentage of the sum of all nine peak heights). Indexes with the comparison of the absorbance values at two distinct wavenumbers are widespread [41]. To quantify the value of aromaticity, the aromaticity index (absorbance at 1612 cm−1divided by the absorbance at 2918 cm−1[19]) was calculated, as the efficiency of this index was proved by carbon-13 nuclear magnetic resonance measurements [42]. Estimation of the mineralogical composition of the fractions parallel with the FTIR-DRIFT measurements was conducted using the same device equipped with an attenuated total reflectance (ATR) attachment, as this method is more applicable for pure mineral phase identification [43]. The applied settings and calculations were the same as those used for the DRIFT method. An index representing the clay mineral/quartz ratio was introduced by dividing the absorbances at 916 cm−1(representing the OH−deformation linked to Al3+) by the absorbances at 780 cm−1(representing the quartz content) [44].
2.4. Applied Statistical Tests
To compare the rA values with the calculated index values, a one-way ANOVA was used with a post-hoc Tukey test at the 95% significance level. For wavenumber determination of the representative peaks, the second derivatives of each absorbance spectrum were calculated using Bruker Opus 7 software.
The correlations among the investigated rA values, organic carbon content, and particle size distribution were measured by the Pearson correlation coefficient. In order to identify the wavenumber-related absorbances and additional soil properties (sand (20–200µm), silt (5–20µm), clay (<5µm), and organic carbon contents of the fractions) that most affected the classification of the samples, a principal component analysis (PCA) was conducted by applying the second derivatives of each measured wavenumber using IBM SPSS Statistic for Windows (version 22, IBM Corp., Armonk, NY, USA).
3. Results and Discussion
3.1. Particle Size Distribution and Soil Organic Carbon Content Results
Changes in the particle size distribution among land uses within the investigated time scale may reflect the intensive weathering or erosion/sedimentation processes [45,46], which would make it harder to compare the SOM distribution. All the physical fractions and bulk soils revealed similar sized particles among land uses (Table1), as the unified particle size distributions of the fractions were the results of the fractionation procedure. Consequently, the largest particles were in the S+A fractions, and the particles had the same size distribution in the s+c and rSOC fractions since these were the same size fractions before and after oxidation.
Land use changes triggered significant differences in the SOC content of the bulk soil (Table1) even in this short period, which was also presented by Guzmán et al. [47]. The highest value was found under the NF (40.60±0.61 mg g−1), whereas under PT, the SOC content decreased to 10.50± 0.02 mg g−1. Owing to 15 years of CT, the SOC increased to 13.70±1.23 mg g−1. In contrast to the traditional SOC dynamic models [48], the SOC content of the slow pools, such as the s+c-associated pool and rSOC, also decreased owing to cultivation. Then, the SOC content of these pools increased significantly because of reduced tillage during this short period, as reported by Rieder et al. [18]
(Table1). The highest SOC loss was in the occluded SOM within the aggregates, which decreased to 19% of the original content owing to PT. Shifting to CT in 2003 resulted in the current doubled volume of aggregate-occluded SOC. The highest SOC increase was detected in the rSOC fraction owing to CT (Table1), which exceeded the original values of rSOC under the NF. The reason for this phenomenon is not known; however, it suggested that the SOC saturation of soil was not directly related to the fine
fraction, as also revealed by Beare et al. [49]. As a result, the SOC ratio among the pools became diverse.
Most of the SOC under the NF was silt- and clay-associated while under CT the aggregate-occluded SOC was dominant and under PT the SOC content was regulated by fresh POM. The reduced tillage intensity triggered the dominance of aggregate-occluded SOC (Figure2a).
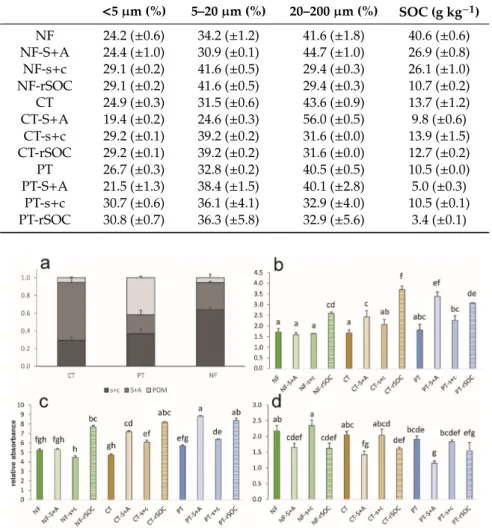
Table 1.Particle size distribution and total organic carbon content of the investigated fractions under various land use types (SOC: soil organic carbon; NF: native forest; CT: conservation tillage; PT:
ploughing tillage). Standard deviations are in brackets.
<5µm (%) 5–20µm (%) 20–200µm (%) SOC (g kg−1)
NF 24.2 (±0.6) 34.2 (±1.2) 41.6 (±1.8) 40.6 (±0.6) NF-S+A 24.4 (±1.0) 30.9 (±0.1) 44.7 (±1.0) 26.9 (±0.8) NF-s+c 29.1 (±0.2) 41.6 (±0.5) 29.4 (±0.3) 26.1 (±1.0) NF-rSOC 29.1 (±0.2) 41.6 (±0.5) 29.4 (±0.3) 10.7 (±0.2) CT 24.9 (±0.3) 31.5 (±0.6) 43.6 (±0.9) 13.7 (±1.2) CT-S+A 19.4 (±0.2) 24.6 (±0.3) 56.0 (±0.5) 9.8 (±0.6)
CT-s+c 29.2 (±0.1) 39.2 (±0.2) 31.6 (±0.0) 13.9 (±1.5) CT-rSOC 29.2 (±0.1) 39.2 (±0.2) 31.6 (±0.0) 12.7 (±0.2) PT 26.7 (±0.3) 32.8 (±0.2) 40.5 (±0.5) 10.5 (±0.0) PT-S+A 21.5 (±1.3) 38.4 (±1.5) 40.1 (±2.8) 5.0 (±0.3)
PT-s+c 30.7 (±0.6) 36.1 (±4.1) 32.9 (±4.0) 10.5 (±0.1) PT-rSOC 30.8 (±0.7) 36.3 (±5.8) 32.9 (±5.6) 3.4 (±0.1)
Figure 2. Total organic carbon distribution of the investigated Luvisol under various land uses (a).
The aromaticity index (b), the relative absorbance at 1794 cm-1referring to the oxidation degree (c), the clay/quartz index (d), and values of the fractions. Different letters above the bars indicate the significant difference atp<0.05 (CT: conservation tillage; PT: ploughing tillage; NF: native forest; S+A:
sand and aggregates; s+c: fine fraction (<20µm); POM: particulate organic matter; rSOC: resistant part of organic carbon attached to s+c).
3.2. Results of the Fourier Transform Infrared Measurements
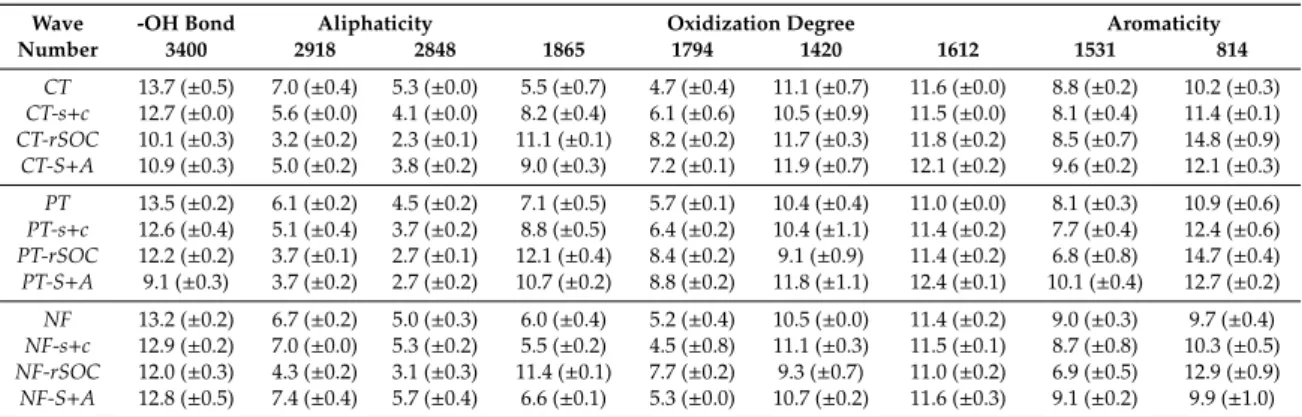
The FTIR-DRIFT spectra showed the same pattern for each investigated fraction. The main peaks were observed at the nine wavenumbers defined in the methods (Table2).
Table 2. Mean relative absorbances at the investigated wavenumbers in the soil fractions; standard deviations are in brackets (CT: conservation tillage; PT: ploughing tillage; NF: native forest; S+A: sand and aggregates; s+c: fine fraction (<20µm); rSOC: resistant part of organic carbon attached to s+c (n=3).
Wave -OH Bond Aliphaticity Oxidization Degree Aromaticity
Number 3400 2918 2848 1865 1794 1420 1612 1531 814
CT 13.7 (±0.5) 7.0 (±0.4) 5.3 (±0.0) 5.5 (±0.7) 4.7 (±0.4) 11.1 (±0.7) 11.6 (±0.0) 8.8 (±0.2) 10.2 (±0.3) CT-s+c 12.7 (±0.0) 5.6 (±0.0) 4.1 (±0.0) 8.2 (±0.4) 6.1 (±0.6) 10.5 (±0.9) 11.5 (±0.0) 8.1 (±0.4) 11.4 (±0.1) CT-rSOC 10.1 (±0.3) 3.2 (±0.2) 2.3 (±0.1) 11.1 (±0.1) 8.2 (±0.2) 11.7 (±0.3) 11.8 (±0.2) 8.5 (±0.7) 14.8 (±0.9) CT-S+A 10.9 (±0.3) 5.0 (±0.2) 3.8 (±0.2) 9.0 (±0.3) 7.2 (±0.1) 11.9 (±0.7) 12.1 (±0.2) 9.6 (±0.2) 12.1 (±0.3) PT 13.5 (±0.2) 6.1 (±0.2) 4.5 (±0.2) 7.1 (±0.5) 5.7 (±0.1) 10.4 (±0.4) 11.0 (±0.0) 8.1 (±0.3) 10.9 (±0.6) PT-s+c 12.6 (±0.4) 5.1 (±0.4) 3.7 (±0.2) 8.8 (±0.5) 6.4 (±0.2) 10.4 (±1.1) 11.4 (±0.2) 7.7 (±0.4) 12.4 (±0.6) PT-rSOC 12.2 (±0.2) 3.7 (±0.1) 2.7 (±0.1) 12.1 (±0.4) 8.4 (±0.2) 9.1 (±0.9) 11.4 (±0.2) 6.8 (±0.8) 14.7 (±0.4) PT-S+A 9.1 (±0.3) 3.7 (±0.2) 2.7 (±0.2) 10.7 (±0.2) 8.8 (±0.2) 11.8 (±1.1) 12.4 (±0.1) 10.1 (±0.4) 12.7 (±0.2) NF 13.2 (±0.2) 6.7 (±0.2) 5.0 (±0.3) 6.0 (±0.4) 5.2 (±0.4) 10.5 (±0.0) 11.4 (±0.2) 9.0 (±0.3) 9.7 (±0.4) NF-s+c 12.9 (±0.2) 7.0 (±0.0) 5.3 (±0.2) 5.5 (±0.2) 4.5 (±0.8) 11.1 (±0.3) 11.5 (±0.1) 8.7 (±0.8) 10.3 (±0.5) NF-rSOC 12.0 (±0.3) 4.3 (±0.2) 3.1 (±0.3) 11.4 (±0.1) 7.7 (±0.2) 9.3 (±0.7) 11.0 (±0.2) 6.9 (±0.5) 12.9 (±0.9) NF-S+A 12.8 (±0.5) 7.4 (±0.4) 5.7 (±0.4) 6.6 (±0.1) 5.3 (±0.0) 10.7 (±0.2) 11.6 (±0.3) 9.1 (±0.2) 9.9 (±1.0)
To quantify the amount of aromatic components in the SOM of the fractions, the aromaticity index was calculated (Figure2b). No differences were found among the bulk soils under various land uses concerning aromaticity, even though forest litter is much more aromatic than cultivated crop tissue [25]. The most aromatic SOM was identified in the restricted fraction (rSOC) in all cases. This may reflect the traditional argument that microbiota prefer aliphatic components, which is why the biologically inactive rSOC is enriched in aromatics [16]. Moreover, tillage intensity seemed to be the driver of increasing aromaticity in the aggregate-occluded SOM. This was also in line with the results of Helfrich et al. [20], namely the increasing SOM mineralization due to oxidization (tillage) is fed by aggregate-related aliphatic compounds. Nonetheless, Tivet et al. [26] reported significant changes in aromatic and aliphatic compounds in aggregate classes under no tillage, but without tendency, which underlines the ambiguities. Furthermore, under PT where the soil disturbance was most effective, the silt- and clay-related SOM became more aromatic as well. The oxidation degree of the SOM fractions revealed the same pattern (Figure2c; rA at 1794 cm−1). In general, higher values were reported for the rSOC fractions, which was presumably the result of the hypochlorite oxidation conducted as one step of the Zimmermann [31] fractionation, even though the SOM within the aggregates of the ploughed plots had the highest rate of oxidization. This suggested that the tillage-induced mineralization surplus primarily originated from the S+A-related fraction, whereas the fine fraction-related SOC source was secondary. Contrarily, there was no difference among the oxidation degrees except for the rSOC fractions of the undisturbed soil under the NF. The clay/quartz ratio was significantly higher in the fine fraction compared with that in the respective S+A fraction under each land use type (Figure2d), thereby indicating the quartz dominance of the larger particles. On the other hand, the hypochlorite oxidization triggered a significant decrease in the clay/quartz ratio under the NF. As the s+c and rSOC fractions had the same mineralogical composition, the measured difference was presumably related to the OM associations with the clay minerals. The organic substance coatings, which create complexes even in the interlayer surfaces within clay minerals [14], could have caused differences in the mineral phase quantifications. The OM-covered minerals might have remained hidden, as suggested by Hrachova et al. [50]. This theory was supported by the highest s+c-associated SOC content under the NF shown in Figure2a because under the other land uses with much lower s+c-related SOC content, and thus less SOM coatings on the mineral surfaces, the hypochlorite oxidation did not result in significant changes in the clay/quartz ratio.
3.3. Soil Organic Matter Composition of the Soil Fractions
In general, the investigated wavenumbers were correlated with each other, except for 1612, 1531, and 1420 cm−1, which were correlated only within this range (Table3). There were weak positive correlations between the SOC content and the aliphatic components while the SOC content and the aromatic compounds were mostly not correlated (Table3). This proved the preferential mineralization
of the aliphatic compounds and the role of the fractions in changing aromaticity. The same finding was published by Tivet et al. [26], who reported that the amount of aliphatic compounds decreased with depth in the soil profile, whereas the mass of aromatic components was independent of depth.
Table 3.Correlation values among the relative absorbances and the investigated wavenumbers, carbon content, and particle size distribution data (n=58; w.n.: wavenumber; SOC: soil organic carbon). Green and red colors refer to positive and negative correlations respectively. Saturation indicates the degree of correlation.
w.n. SOC <5µ 5–20µ >20µ
(cm−1) 3400 2918 2848 1865 1794 1612 1531 1420 814 (m/m) (%) (%) (%)
3697 0.87** 0.68** 0.65** –0.62** –0.76** –0.77** –0.40* –0.46** –0.59** 0.52** 0.40* 0.22 –0.33*
3400 0.77** 0.74** –0.65** –0.80** –0.67** –0.41* –0.52** –0.60** 0.42* 0.27 –0.11 –0.06
2918 1.00** –0.94** –0.94** –0.28 0.20 –0.03 –0.91** 0.68** –0.18 –0.29 0.27
2848 –0.94** –0.93** –0.26 0.23 –0.01 –0.91** 0.69** –0.20 –0.30 0.28
1865 0.95** 0.11 –0.36* –0.23 0.89** –0.69** 0.23 0.28 –0.29
1794 0.29 –0.09 –0.02 0.81** –0.67** 0.00 0.19 –0.12
1612 0.69** 0.75** 0.15 –0.16 –0.58** –0.28 0.46**
1531 0.84** –0.42* 0.26 –0.76** –0.38* 0.61**
1420 –0.14 0.06 –0.51** –0.29 0.44**
814 –0.66** 0.35* 0.27 –0.34*
SOC –0.14 –0.06 0.10
<5µ 0.60** –0.85**
5–20µ –0.93**
* indicates significance at 95% probability. ** indicates significance at 99% probability.
The rA at 3400 cm−1, which referred to kaolinite, was positively correlated with aliphatic compounds and negatively correlated with aromatic compounds. According to Calderón et al. [51], absorbance at 3400 cm−1could also indicate the light fraction, which was supported by the present results owing to the SOM composition mentioned in Section3.2. Moreover, the predicted aromaticity (at 1612 cm−1and 1531 cm−1) and the degree of oxidization (at 1420 cm−1) were positively correlated with the sand content and negatively correlated with the clay content. Nevertheless, these correlations were mostly weak, which suggested that aromaticity was related to the coarse particles while the aliphatic components were more concerned with clay-sized particles. This was in line with the findings of Wattel-Koekkoek et al. [52], who concluded the kaolinite preference in aliphatic SOM stabilization, even though they also reported aromatic SOM enrichment on smectite surfaces. This underlined the role of organic minerals in aliphatic SOM protection and could refer to the increase in aromaticity within the aggregates in smectite-free soils.
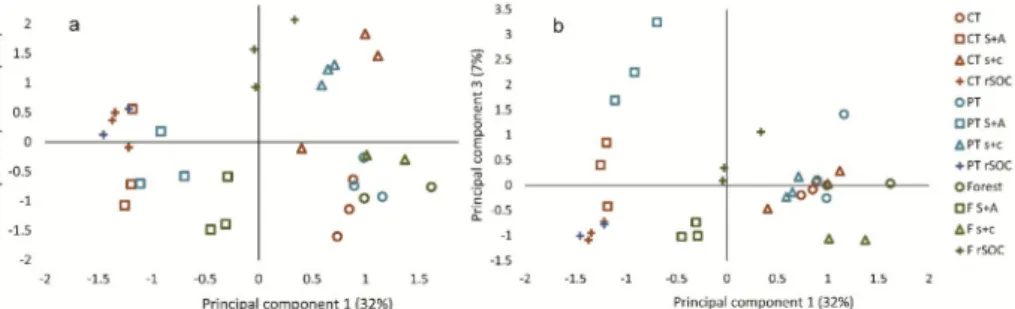
The explained variance by the first three principal components (PCs) was 49%. Based on the loadings, PC1 represented wavenumbers regarding the aliphatic components and OH bonds of the clay minerals, PC2 reflected changes in aromaticity, and PC3 was related to a single range around 2100 cm−1referring to the triple carbon bond. The samples created well-defined groups along the first two components (Figure3a). The SOC content, particle size distribution, and clay/quartz ratio obtained from the ATR measurements did not affect the PCA results.
The S+A and rSOC fractions of both cultivations were characterized by the lack of aliphatic SOM components. On the other hand, the s+c fractions and bulk samples were rich in aliphatic SOM, which was also reported by Parfitt et al. [53]. The NF S+A and rSOC fractions were situated in the middle with moderate aliphatic SOM. The clear difference between all S+A and bulk samples was presumed to be due to the absence/presence of clay minerals.
The differences along PC2 suggested the highest aromaticity in the NF rSOC and tilled s+c fractions.
The hypochlorite oxidation increased the aromaticity of the fine fraction under the NF, whereas no relevant changes were detected under tillage. This suggested the dominance of non-aromatic SOM in the fine fraction, which was highly vulnerable to oxidization under the NF. The differences along PC3 were small, with the enrichment of alkynes in the ploughed S+A fraction. This could have been the result of the highest tillage-induced SOM loss in this fraction.
Figure 3.Data distribution along principal components 1 and 2 (a) and 1 and 3 (b). CT: conservation tillage; PT: ploughing tillage; NF: native forest; S+A: sand and aggregates; s+c: fine fraction (<20µm);
POM: particulate organic matter; rSOC: resistant part of organic carbon attached to s+c.
Rieder et al. [18] presented OM composition results of the same soil fractions as those investigated in this study, and applied the dynamic light scattering method in water extractions. Their results did not show univocal tendencies, and suggested that ploughing triggered an increase in the dissolved OM molecular size in both the occluded and fine fraction-related OM. Moreover, they did not find larger dissolved OM molecules within the aggregates compared with the dissolved OM of the fine fraction, which is in contrast with the general view [54] and the results of the present study. Accordingly, the water-soluble SOM composition differed from in situ SOM, which was presumably due to the higher ratio of recent microbial-originated OM in the former [55].
4. Conclusions
The size of both the aggregate-occluded and restricted SOM pools increased owing to the conversion of PT to CT 15 years ago. As a general trend, the SOC content was inversely proportional to aromaticity under crop fields, which supported the preferential mineralization of aliphatic components in each fraction. The results were not fully consistent with the well-documented particle size dependence of the SOM content and compounds. The shift in the tillage system could trigger rapid changes even in the stable, restricted carbon fractions; nevertheless, it was difficult to distinguish between the role of OM and the mineral composition in the FTIR spectra. In the comparison of bond types with molecular sizes, no direct linkage was found. Relevant changes were detected within fractions in combination with land use; however, these differences were difficult to distinguish and interpret. FTIR spectroscopy for in situ soil characterization resulted in complex spectra in which the single wavenumbers or bonds were difficult to interpret. In particular, the clay-related organic–mineral complexes could trigger difficulties in traditional interpretation methods.
Author Contributions: Conceptualization and writing, G.J.; methodology, T.F., C.K., and B.M.; data curation, D.Z.; investigation, M.R., L.G., and A.V.; supervision, Z.S.
Funding:This research was funded by the National Research Development and Innovation Office of Hungary (grant number 123953). Support of the Bolyai János Research Scholarship of the Hungarian Academy of Sciences (B.M.) is gratefully acknowledged.
Conflicts of Interest: The authors declare no conflict of interest. The funders had no role in the design of the study, in the collection, analyses, or interpretation of the data, in the writing of the manuscript, or in the decision to publish the results.
References
1. Kögel-Knabner, I.; Ekschmitt, K.; Flessa, H.; Guggenberger, G.; Matzner, E.; Marschner, B.; von Lützow, M.
An integrative approach of organic matter stabilization in temperate soils: Linking chemistry, physics, and biology.J. Plant Nutr. Soil Sci.2008,171, 5–13. [CrossRef]
2. Blume, H.-P.; Brümmer, G.W.; Fleige, H.; Horn, R.; Kandeler, E.; Kögel-Knabner, I.; Kretzschmar, R.; Stahr, K.;
Wilke, B.-M.Scheffer/Schachtschabel Soil Science; Springer: Heidelberg, Germany, 2016; p. 618.
3. Weil, R.R.; Brady, N.C.The Nature and Properties of Soils; Pearson: Boston, MA, USA, 2017; p. 1071.
4. Hassink, J. The capacity of soils to preserve organic C and N by their association with clay and silt particles.
Plant Soil1997,191, 77–87. [CrossRef]
5. Cates, A.M.; Ruark, M.D.; Hedtcke, J.L.; Posner, J.L. Long-term tillage, rotation and perennialization effects on particulate and aggregate soil organic matter.Soil Tillage Res.2016,155, 371–380. [CrossRef]
6. Xue, Z.; An, S. Changes in Soil Organic Carbon and Total Nitrogen at a Small Watershed Scale as the Result of Land Use Conversion on the Loess Plateau.Sustainability2018,10, 4757. [CrossRef]
7. Rodrigo-Comino, J.; Neumann, M.; Remke, A.; Ries, J.B. Assessing environmental changes in abandoned German vineyards. Understanding key issues for restoration management plans.Hung. Geogr. Bull.2018, 67, 319–332. [CrossRef]
8. Tiessen, H.; Stewart, J.W.B. Particle-size Fractions and their Use in Studies of Soil Organic Matter: II.
Cultivation Effects on Organic Matter Composition in Size Fractions.Soil Sci. Soc. Am. J.1983,47, 509–514.
[CrossRef]
9. Yang, S.; Sheng, D.; Adamowski, J.; Gong, Y.; Zhang, J.; Cao, J. Effect of Land Use Change on Soil Carbon Storage over the Last 40 Years in the Shi Yang River Basin, China.Land2018,7, 11. [CrossRef]
10. Kämpf, I.; Hölzel, N.; Störrle, M.; Broll, G.; Kiehl, K. Potential of temperate agricultural soils for carbon sequestration: A meta-analysis of land-use effects.Sci. Total Environ.2016,566–567, 428–435. [CrossRef]
11. Du, Z.; Angers, D.A.; Ren, T.; Zhang, Q.; Li, G. The effect of no-till on organic C storage in Chinese soils should not be overemphasized: A meta-analysis.Agric. Ecosyst. Environ.2017,236, 1–11. [CrossRef]
12. Horel,Á.; Tóth, E.; Gelybó, G.; Dencs˝o, M.; Potyó, I. Soil CO2and N2O Emission Drivers in a Vineyard (Vitis vinifera) under Different Soil Management Systems and Amendments.Sustainability2018,10, 1811.
[CrossRef]
13. von Lützow, M.; Kögel-Knabner, I.; Ekschmitt, K.; Matzner, E.; Guggenberger, G.; Marschner, B.; Flessa, H.
Stabilization of organic matter in temperate soils: Mechanisms and their relevance under different soilconditions—A review.Eur. J. Soil Sci.2006,57, 426–445. [CrossRef]
14. Liu, H.; Yuan, P.; Qin, Z.; Liu, D.; Tan, D.; Zhu, J.; He, H. Thermal degradation of organic matter in the interlayer clay–organic complex: A TG-FTIR study on a montmorillonite/12-aminolauric acid system.
Appl. Clay Sci.2013,80–81, 398–406. [CrossRef]
15. Tisdall, J.M.; Oades, J.M. Organic matter and water-stable aggregates in soils.Eur. J. Soil Sci.2012,63, 8–21.
[CrossRef]
16. Six, J.; Guggenberger, G.; Paustian, K.; Haumaier, L.; Elliott, E.T.; Zech, W. Sources and composition of soil organic matter fractions between and within soil aggregates.Eur. J. Soil Sci.2002,52, 607–618. [CrossRef]
17. Marschner, B.; Brodowski, S.; Dreves, A.; Gleixner, G.; Gude, A.; Grootes, P.M.; Hamer, U.; Heim, A.; Jandl, G.;
Ji, R.; et al. How relevant is recalcitrance for the stabilization of organic matterin soils?J. Plant Nutr. Soil Sci.
2008,171, 91–110. [CrossRef]
18. Rieder,Á.; Madarász, B.; Szabó, J.A.; Zacháry, D.; Vancsik, A.; Ringer, M.; Szalai, Z.; Jakab, G. Soil organic matter alteration velocity due to land-use change: A case study under conservation agriculture.Sustainability 2018,10, 943. [CrossRef]
19. Chefetz, B.; Hatcher, P.; Hadar, Y.; Chen, Y. Chemical and biological characterization of organic matter during composting of municipal solid waste.J. Environ. Qual.1996,25, 776–785. [CrossRef]
20. Helfrich, M.; Ludwig, B.; Buurman, P.; Flessa, H. Effect of land use on the composition of soil organic matterin density and aggregate fractions as revealed by solid-state13C NMR spectroscopy.Geoderma2006, 136, 331–341. [CrossRef]
21. Lehman, J.; Kleber, M. The contentious nature of soil organic matter.Nature2015,528, 60–68. [CrossRef]
22. Schmidt, M.W.I.; Torn, M.S.; Abiven, S.; Dittmar, T.; Guggenberger, G.; Janssens, I.A.; Kleber, M.;
Kögel-Knabner, I.; Lehmann, J.; Manning, D.A.C.; et al. Persistence of soil organic matter as an ecosystem property.Nature2011,478, 49–56. [CrossRef]
23. Niemeyer, J.; Chen, Y.; Bollag, J.M. Characterization of humic acids, composts and peat.Soil Sci. Soc. Am. J.
1992,56, 135–140. [CrossRef]
24. Amir, S.; Jouraiphy, A.; Meddich, A.; El Gharousb, M.; Wintertonc, P.; Hafidi, M. Structural study of humic acids during composting of activated sludge-green waste: Elemental analysis, FTIR and13C NMR.
J. Hazard. Mater.2010,177, 524–529. [CrossRef] [PubMed]
25. Haberhauer, G.; Gerzabek, M.H. Drift and transmission FT-IR spectroscopy of forest soils: Anapproach to determine decomposition processes of forest litter.Virational Spectrosc.1999,19, 413–417. [CrossRef]
26. Tivet, F.; de Moraes Sá, J.C.; Lal, R.; Milori, D.M.B.P.; Briedis, C.; Letourmy, P.; Pinheiro, L.A.; Borszowskei, P.R.;
da Cruz Hartman, D. Assessing humification and organic C compounds by laser-induced fluorescence and FTIR spectroscopies under conventional and no-till management in Brazilian Oxisols.Geoderma2013, 207–208, 71–81. [CrossRef]
27. Margenot, A.J.; Calderón, F.J.; Parikh, S.J. Limitations and Potential of Spectral Subtractions in Fourier-Transform Infrared Spectroscopy of Soil Samples.Soil Sci. Soc. Am. J.2015. [CrossRef]
28. Fernandez, J.M.; Plante, A.F.; Leifeld, J.; Rasmussen, C. Methodological considerations for using thermal analysis in the characterization of soil organic matter.J. Therm. Anal. Calorim.2011,104, 389–398. [CrossRef]
29. Gerzabek, M.H.; Antil, R.S.; Kögel-Knabner, I.; Knicker, H.; Kirchmann, H.; Haberhauer, G. How are soil use and management reflected by soil organic matter characteristics: A specroscopic approach.Eur. J. Soil Sci.
2006,57, 485–494. [CrossRef]
30. Madarász, B.; Juhos, K.; Ruszkiczay-Rüdiger, Z.; Benke, S.; Jakab, G.; Szalai, Z. Conservation tillage vs.
conventional tillage: Long-term effects on yields in continental, sub-humid Central Europe, Hungary.Int. J.
Agric. Sustain.2016,14, 408–427. [CrossRef]
31. Zimmermann, M.; Leifeld, J.; Schmidt, M.W.I.; Smith, P.; Fuhrer, J. Measured soil organic matter fractions can be related to pools in the RothC model.Eur. J. Soil Sci.2007,58, 658–667. [CrossRef]
32. Poeplau, C.; Dona, A.; Dondini, M.; Leifeld, J.; Nemod, R.; Schumacher, J.; Senapati, N.; Wiesmeier, M.
Reproducibility of a soil organic carbon fractionation method to derive RothC carbon pools.Eur. J. Soil Sci.
2013,64, 735–746. [CrossRef]
33. Schumacher, B.A. Methods for the Determination of Total Organic Carbon (TOC) In Soils and Sediments;
EPA/600/R-02/069 US EPA; U.S. Environmental Protection Agency: Washington, DC, USA, 2002; p. 25.
34. Centeri, C.; Szalai, Z.; Jakab, G.; Barta, K.; Farsang, A.; Szabó, S.; Bíró, Z. Soil erodibility calculations based on different particle size distribution measurements.Hung. Geogr. Bull.2015,64, 17–23. [CrossRef]
35. Makó, A.; Tóth, G.; Weynants, M.; Rajkai, K.; Hermann, T.; Tóth, B. Pedotransfer functions for converting laser diffraction particle-size data to conventional values.Eur. J. Soil Sci.2017,68, 769–782. [CrossRef]
36. Stumpe, B.; Weihermüller, L.; Marscner, B. Sample preparation and selection for qualitative and quantitative analyses of soil organic carbonwith mid-infrared reflectance spectroscopy.Eur. J. Soil Sci.2011,62, 849–862.
[CrossRef]
37. Hesse, A.; Thomas, H.; Höcker, H. Zero-AOX Shrinkproofing Treatment for Wool Top and Fabric: Part I:
Glow Discharge Treatment.Text. Res. J.1995,65, 355–361. [CrossRef]
38. Knadel, M.; Stenberg, B.; Deng, F.; Thomsen, A.; Greve, M.H. SOC and clay determination using three vis-NIR spectrometer.J. Near Infrared Spectrosc.2013,21, 67–80. [CrossRef]
39. Spence, A.; Kelleher, B.P. FT-IR Spectroscopic Analysis of Kaolinite-Microbial Interactions.Vib. Spectrosc.
2012,61, 151–155. [CrossRef]
40. Türker-Kaya, S. A Review of Mid-Infrared and Near-Infrared Imaging: Principles, Concepts and Applications in Plant Tissue Analysis.Molecules2017,22, 168. [CrossRef]
41. Inbar, Y.; Chen, Y.; Hadar, Y. Solid-state Carbon-13 nuclear magnetic resonance and infrared specroscopy of composted organic matter.Soil Sci. Soc. Am. J.1989,53, 1695–1701. [CrossRef]
42. Dick, P.D.; Knicker, H.;Ávila, L.G.; Indra, A.V., Jr.; Giasson, E.; Bissani, C.A. Organic matter in constructed soils from a coal mining area in southern Brazil.Org. Geochem.2006,37, 1537–1545. [CrossRef]
43. Madejová, J. FTIR techniques in clay mineral studies.Vib. Spectrosc.2003,31, 1–10. [CrossRef]
44. Madejová, J.; Gates, W.P.; Petit, S. IR Spectra of Clay Minerals. InDevelopments in Clay Science; Gates, W.P., Kloprogge, J.T., Madejová, J., Bergaya, F., Eds.; Elsevier: Amsterdam, The Netherlands, 2017; pp. 107–149.
[CrossRef]
45. Szalai, Z.; Jakab, G.; Szabó, J.; Kovács, J.; Mészáros, E.; Albert, G.; Centeri, C.; Szabó, B.; Madarász, B.;
Zacháry, D. Redistribution of erosion triggered soil organic carbon at the field scale under subhumid cilmate.
Pedosphere2016,26, 652–665. [CrossRef]
46. Sklar, L.S.; Riebe, C.S.; Marshall, J.A.; Genetti, J.; Leclere, S.; Lukens, C.L.; Merces, V. The problem of predicting the size distribution of sediment supplied by hillslopes to rivers.Geomorphology2017,277, 31–49.
[CrossRef]
47. Guzmán, G.; Perea-Moreno, A.-J.; Gómez, J.A.; Cabrerizo-Morales, M.Á.; Martínez, G.; Giráldez, J.V. Water Related Properties to Assess Soil Quality in Two Olive Orchards of South Spain under Different Management Strategies.Water2019,11, 367. [CrossRef]
48. Bonde, T.A.; Rosswall, T. Seasonal Variation of Potentially Mineralizable Nitrogen in Four Cropping Systems.
Soil Sci. Soc. Am. J.1987,51, 1508–1514. [CrossRef]
49. Beare, M.H.; McNeill, S.J.; Curtin, D.; Parfitt, R.L.; Jones, H.S.; Dodd, M.B.; Sharp, J. Estimating the organic carbon stabilisation capacity and saturation deficit of soils: A New Zealand case study.Biogeochemistry2014, 120, 71–87. [CrossRef]
50. Hrachova, J.; Komadel, P.; Chodak, I. Natural rubber nanocomposites with organo-modified bentonite.
Clays Clay Miner.2009,57, 444–451. [CrossRef]
51. Calderón, F.J.; Reeves, J.B.; Collins, H.P.; Paul, E.A. Chemical differences in soil organic matter fractions determined by diffuse-reflectance mid-infrared spectroscopy. Soil Sci. Soc. Am. J.2011, 75, 568–579.
[CrossRef]
52. Wattel-Koekkoek, E.J.W.; van Genuchten, P.P.L.; Buurman, P.; van Lagen, B. Amount and composition of clay-associated soil organic matter in a range of kaolinitic and smectitic soils. Geoderma2001,99, 27–49.
[CrossRef]
53. Parfitt, R.L.; Theng, B.K.G.; Whitton, J.S.; Shepherd, T.G. Effects of clay minerals and land use on organic matter pools.Geoderma1997,75, 1–12. [CrossRef]
54. Manzoni, S.; Porporato, A. Soil carbon and nitrogen mineralization: Theory and models across scales.
Soil Biol. Biochem.2009,41, 1355–1379. [CrossRef]
55. Chantigny, M.H. Dissolved and water-extractable organic matter in soils: A review on the influence of land use and management practices.Geoderma2003,113, 357–380. [CrossRef]
©2019 by the authors. Licensee MDPI, Basel, Switzerland. This article is an open access article distributed under the terms and conditions of the Creative Commons Attribution (CC BY) license (http://creativecommons.org/licenses/by/4.0/).