Postal address: ESZTER HOFMANN, Institute of Environmental and Earth Sciences, Faculty of Forestry, University of Sopron. H-9400 Sopron, Bajcsy-Zsilinszky u. 4. Hungary.
E-mail: hofmann.eszter@uni-sopron.hu
Thermal analysis of soils formed on limestone in the Bükk Mountains, North Hungary
1E.HOFMANN,2,3T.NÉMETH,1A.BIDLÓ
1Institute of Environmental and Earth Sciences, University of Sopron, Sopron
2Department of Mineralogy, Eötvös Loránd University, Budapest
3Research Centre for Astronomy and Earth Sciences, Institute for Geological and Geochemical Research, Hungarian Academy of Sciences, Budapest
Abstract
The present article discusses the applicability of thermoanalytical methods in the analysis of Hungarian soils formed on carbonate rocks. Up to now only limited mineralogical and soil chemical research has been done on these soils. Soils from the Bükk Mountains, the most varied limestone region in Hungary, were used for the investigations. The aim was to extend our incomplete knowledge on the mineral composition and formation processes of these soils and to demonstrate the possibilities and evaluation potential of thermoanalytical techniques. All the soils investigated were formed on limestone and had different surface soil thickness, influenced by the accumulation of silicate debris and the microterrain. The results of soil mineralogical analysis revealed an extraordinarily high proportion of quartz compared to that of other minerals (especially calcite), indicating that these soils could not have originated solely from the weathering of the limestone bedrock. The results also showed that thermoanalytical methods could complement classical chemical and instrumental (XRPD) methods in research on the genesis of soils formed on limestone.
Keywords: Limestone, soil, Bükk Mountains, thermoanalysis, mineral composition Introduction
Soil is a complex physical, chemical and biological system, the investigation of which is extremely important from both ecological and economic aspects.
Among the many instrumental methods available for soil analysis thermoanalytical methods have been pushed into the background recently. Thermal analysis is suitable for the identification and quantitative assessment of the mineral constituents of rocks, but although minerals were the first compounds to be investigated with thermal analysis, its potential for geology has mostly remained untapped up to now (FÖLDVÁRI,2008). Since thermoanalytical measurements have only been used as a complementary tool for the assessment of the mineralogical composition of soils if at all. The aim of the present study was to demonstrate of the
potential of thermal methods and how to interpret and utilize thermoanalytical curves.
Thermoanalytical methods were first applied for the investigation of soils in the 1930s. Ross (1931) and Kerr (1934) used thermogravimetric methods to measure soil moisture content and to study soil minerals (halloysite, allophane, kaolinite). Kelley et al. published the thermoanalytical (TG) curves of soil colloids (VAN DER PLAS &VAN REEUWIJK,1974). As both the grain size of the organic and inorganic constituents and the physical, chemical and biological properties of soils are quite variable, it is necessary to specify whether the analysis was made on fine earth (<2 mm grain) or on soil fractions with a given grain size range. The thermal analysis of original soil samples is only feasible if the clay content is high and the organic content sufficiently low (<1%) (TAN et al., 1986). So most of the research conducted in Hungary has been limited to the thermal analysis of such soil samples.
The thermoanalytical studies of FEKETE et al. (2008) and FEKETE (2010) on the mineral composition of Hungarian red soils provided useful data on the composition of the clay content in these samples. In investigations on the poorly weathered/mineralized layers of soils from the Gerecse Mountains (typical basic rock: Dachstein Limestone) the transformed zone was indicated by the weakened bonding structure of calcites, detected as the lower decomposition temperatures of the calcites using thermoanalytical methods (DEÁK et al.,2002).
Thermal analysis is one of the most commonly used methods for the determination of soil moisture content. FÖLDVÁRI & KOVÁCS-PÁLFFY (2002), MARSI et al. (2004) and FÖLDVÁRI (2008) used thermogravimetric curves to construct a weathering curve (indirectly a palaeoclimate curve) for a loess section, based on the measurement of the molecular water and hydroxide water content of the samples.
The present work investigated soils found under natural forests and formed on limestone basic rock. Detailed, comprehensive research on soils formed on limestone in Hungary has not yet been reported. The results previously published for these soils focused primarily on leaching effects, the thickness and structure of the surface soil and changes in organic matter content (STEFANOVITS, 1992;
SZENDREI, 1998; JÁRÓ, 1999; STEFANOVITS et al., 1999). A recent study on the formation of these soils by NÉMETH et al. (2014) focused on the detailed examination of their mineral composition using thermal analysis and X-ray powder diffraction methods, but only provided preliminary results. Other studies have discussed the classification of these soils using the new soil classification systems (MICHÉLI et al.,2006;BARTA et al., 2009; MICHÉLI 2011; MICHÉLI et al., 2015).
The aim of this study was to assess the applicability of thermal analysis as a technique for the study of soils, focusing especially on the mineralogy of soils formed on limestone basic rock, as knowledge on the mineral composition of these soils is incomplete. Samples were collected from the Bükk Mountains, which have the most varied limestone structure in Hungary and are also the highest karst highland. The results were compared to other chemical and mineralogical soil data, and conclusions were drawn on the genesis of the soils, on their relationship with the basic rock, and on the parameters influencing soil formation processes.
Materials and methods Samples
The study area is located in the karst of the Bükk Mountains, which is part of the North Hungarian Mountain Range. Soil profiles were taken from the central region of the Bükk Mountains, a 60,000 ha area with 82% forest coverage (HALÁSZ, 2006). The highest point is the Bükk Highlands, the highest karst highland in Hungary (DÖVÉNYI,2010). The heat and water supplies of the highland are moderately cold/cold and moderately humid/humid, the annual mean temperature is 6.0 °C (HALÁSZ, 2006) and the average mean precipitation is 800 mm (DÖVÉNYI, 2010). The study area is a closed forest where the forest associations range fairly continuously from the Turkey oak-sessile oak forest climate zone to the montane beech forest climate zone (VOJTKÓ,1995).
The triassic limestone covering the surface of the territory can reach a thickness of 1000 m and belongs to the Bükkfennsík Limestone Formation with carbonate platform facies (Figure 1) (LESS et al.,2005).
Figure 1
Geology of the study area /1:50 000/ (Source: http://loczy.mfgi.hu/fdt100/) and location of the profiles studied. A: Bükkfennsík Limestone Formation: Late Triassic limestone – carbonate platform facies. B: Felsőtárkány Limestone Formation, Late Triassic limestone –
pelagic intrashelf basin facies.
A total of 10 representative soil profiles were taken from typical plots (in terms of terrain and vegetation) on the Bükk Highland, with various soil depths, slope angles and exposures. All the profiles were located above solid limestone basic rock under weakly eroded or erosion free close-to-nature forest associations
(mostly montane beech forests) not affected by excess water. In order to trace changes between the layers, soil profiles were sampled from diagnostic horizons representative of soil formation processes.
The soil samples were dried at 105 oC and visible organic parts were removed.
They were then ground to pass through a 2 mm sieve. The prepared soil fractions (fine earth fractions) served as the basic material for laboratory analysis.
Basic physical and chemical measurements
The basic physical and chemical soil properties analysed included the pH of aqueous and KCl soil extracts (Hungarian standard MSZ-08-0206-2:1978), the calcium carbonate content (Scheibler-type calcimeter, MSZ-08-0205:1978), the grain size distribution (GSD) (MSZ 18094-14:1986) and the total organic matter (humus) content (FAO1990;BELLÉR 1997).
Thermoanalysis
The thermoanalytical investigation of the mineralogical composition of the samples was carried out using a Mettler Toledo TGA/DSC 1 instrument. The measurements were performed in Al2O3 crucibles in a synthetic air atmosphere using a 10 oC/min heating rate. Thermogravimetric (TG), differential thermogravimetric (DTG) and heat flow (HF) curves were recorded. The heat flow represented the flow of heat between sample and control crucibles and indicated the endothermic (valley) or exothermic (peak) processes at given temperatures. The thermal curves were evaluated with TA STARe software. Besides the fine earth fractions (<2mm), various other grain fractions, separated by grain size distribution measurements (MSZ 18094-14:1986), were also analysed. In this case, sample preparation was modified to omit sodium hexametaphosphate in order to keep the carbonate minerals unchanged.
X-ray powder diffraction (XRPD) measurements
The mineral composition of the soil samples was determined with a Philips PW 3710/PW 1050 parafocusing Bragg-Brentano goniometer using Cu-Kα radiation (λ = 0.15418 nm), equipped with a graphite monochromator and a proportional counter. The quantitative evaluation of the digitally recorded XRPD scans was done using a full profile fit method with corrections for preferred orientation and microabsorption.
The mineral composition of the basic rocks was determined with a Siemens D5000 diffractometer equipped with a graphite monochromator using Cu-Kα radiation at 40 kV and 40 mA. The step size was 0.05o for 2 sec from 3° to 70° 2Θ. The quantitative mineral composition was determined with the Rietveld full profile fitting method using Siroquant V4 software.
Results and discussion
Analysis of fine earth fractions
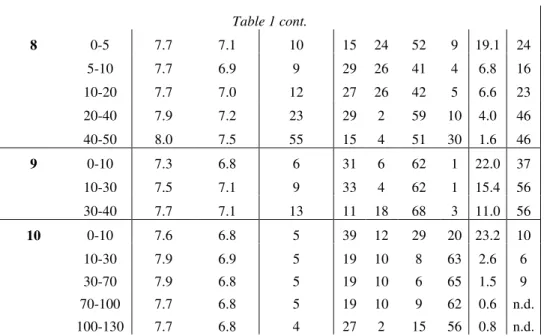
The pH values of the soil samples were neutral to slightly alkaline (pHH2O: 6.5 – 8.1; pHKCl: 5.8 – 7.5). The upper soil layers were found to contain lower levels of calcium carbonate compared to the deeper layers, which were closer to the basic rock. The GSD measurements showed that the fine sand and clay-silt fractions were dominant in most of the samples. Although the leaf litter layers and organic parts were removed during sample collection and preparation, samples with extremely high humus contents were also found. These were probably organic layers containing already decomposed leaf litter that could not be detected and separated during sample processing. The results are summarized in Table 1.
Table 1
Basic chemical and physical properties of the soil samples. pHH2O: pH of the aqueous soil extract; pHKCl: pH of the KCl soil extract; CaCO3: calcium carbonate content; grain size distribution: C% − clay (<0.002 mm), S% − silt (0.002 – 0.02 mm), Fs% – fine sand (0.02 –
0.2 mm) and Cs – coarse sand (0.2-2 mm); H%: humus content; SP%: skeletal part; n.d. = not detected.
Soil profile
Depth
cm pH H2O pH KCl CaCO3 % C
% S
% Fs
% Cs
% H
% SP
%
1 0-5 6.9 6.6 n.d. 13 30 53 4 27.8 n.d.
5-20 6.9 6.6 n.d. 23 38 35 4 21.9 7
2 0-10 7.1 6.6 10 7 26 66 1 51.4 37
10-20 7.3 6.9 9 11 26 62 1 37.0 35
3 0-10 6.5 6.1 7 15 22 62 1 76.3 39
10-20 7.3 6.7 7 27 18 54 1 33.7 29
4 0-20 7.3 6.8 5 13 6 80 1 49.0 56
20-50 7.5 7.0 7 9 24 63 4 32.3 67
5 0-10 6.8 6.2 6 17 2 76 5 34.7 11
10-30 7.4 6.8 7 43 22 32 3 18.7 42
30-60 7.9 7.1 35 27 42 21 10 7.4 61
6 0-10 6.8 6.1 4 37 30 32 1 20.4 36
10-20 6.8 5.8 4 49 24 26 1 12.1 4
20-30 7.6 6.7 7 39 32 28 1 11.3 13
7 0-10 7.2 6.5 5 33 26 40 1 22.9 6
10-30 7.6 7.0 12 39 32 26 3 10.9 27
30-50 8.0 7.3 20 19 18 38 25 2.7 34
50-70 8.1 7.4 23 15 24 31 30 1.6 49
Table 1 cont.
8 0-5 7.7 7.1 10 15 24 52 9 19.1 24
5-10 7.7 6.9 9 29 26 41 4 6.8 16
10-20 7.7 7.0 12 27 26 42 5 6.6 23
20-40 7.9 7.2 23 29 2 59 10 4.0 46
40-50 8.0 7.5 55 15 4 51 30 1.6 46
9 0-10 7.3 6.8 6 31 6 62 1 22.0 37
10-30 7.5 7.1 9 33 4 62 1 15.4 56
30-40 7.7 7.1 13 11 18 68 3 11.0 56
10 0-10 7.6 6.8 5 39 12 29 20 23.2 10
10-30 7.9 6.9 5 19 10 8 63 2.6 6
30-70 7.9 6.8 5 19 10 6 65 1.5 9
70-100 7.7 6.8 5 19 10 9 62 0.6 n.d.
100-130 7.7 6.8 4 27 2 15 56 0.8 n.d.
Thermal analysis of the fine earth fractions revealed lower peak temperatures than were expected, which was explained by the poor crystallinity of the soil minerals, though the heating rate and sample amount could also have influenced the results. As repeated temperature calibration of the instrument gave the same thermoanalytical curves with different heating rates, it was concluded that poor crystallinity was a characteristic trait of the soil samples investigated, and of the minerals and phases in the soils. The thermal decomposition of smaller particles commences at lower temperatures than that of larger particles, so the onset temperature of the transformation processes is determined by smaller particles (FÖLDVÁRI, 1986). As the grain size distribution of the soil is heterogeneous, decreasing particle size results in the shifting of peak temperatures towards lower values (BUZÁS,1993). Moreover, the proportion of amorphous and organic phases may have been high in these samples, thus changing the positions of clay minerals, iron minerals and carbonates on the thermoanalytical curves compared to data in the literature. The characteristic endothermic peaks of clay minerals may be shifted to 250–400 oC or even up to 500–600 oC during the thermal analysis of fine earth fractions containing high amounts of organic substances. This was typical of the upper soil layers, which had high humus content (Figure 2) and was less pronounced in the deeper layers of the profiles, which had thermoanalytical curves with pronounced endothermic peaks for the minerals (Figure 3).
Figure 2
The influence of high organic matter content is apparent even up to 500−600 oC
Figure 3
Thermoanalytical curves of deeper soil layers with lower amounts of organic matter, showing characteristic endothermic peaks for minerals
Endothermic dehydration occurs between 50 and 100 oC. Smectite-type minerals were present in almost all the soil samples, except for the topmost layers, giving peaks between 50 and200 oC on the thermoanalytical curves (characteristic endothermic peak of water loss and adjacent inflexion, corresponding to the loss of the water bound to interlayer cations). Smectites in soils lose their interlayer free water at lower temperatures than typical smectites (FÖLDVÁRI,2011).Soils usually contain various types of clay minerals, so the dehydroxylation peaks of smectites may overlap with those of other clay minerals (kaolinite, illite), making the precise identification of minerals within the smectite group difficult. Endothermic peaks between 500 oC and 600 oC usually indicate the dehydroxylation reactions of clay minerals, but peaks below 600 oC may also be interpreted as the second peak of chlorites. Quartz appears in the HF curve between 570–580 oC, while calcite has a varying peak temperature between 650–850 oC. The low temperature decomposition of calcite was detected for all the profiles investigated. The weathering of carbonate minerals results in lower onset temperatures for decomposition during thermal analysis, which can be explained by the smaller grain size or crystalline size of calcite or by cation substitution (DEÁK et al., 2002;
FÖLDVÁRI,2011). Ca is most frequently substituted by Mg, but other metals, e.g. Fe or Mn, may also occur (SZAKÁLL, 2007). Mg and Fe were probably the most frequent in the samples investigated, leading to lower decomposition temperatures.
The results of thermal analysis on the fine earth fractions are summarized in Table 2.
Table 2
Results of thermoanalytical measurements: moisture contents and the composition of mineral phases in the soil layers. H2O% – molecular water content; OH% – structural water
content; CM% – total clay mineral content; Sm% – smectite content; Kao% – kaolinite content; Ill% – illite content; Chl% – possible chlorite content; Goe% – goethite content;
Fh% – “ferrihydrite” content; Cal% – calcite content; Dolo% – dolomite content; Org% – organic matter content; Q – quartz; +: present based on TG, DTG and HF curves; -: not
present based on TG, DTG, HF curves; tr: in traces).
Soil profile Layer
cm H2O
% OH
% CM
% Sm
% Kao
% Ill
% Chl
% Goe
% Fh
% Cal %
Dolo
% Org
% Q
1 0-5 8.82 - - - - - - - + 2 - <34% -
5-20 7.37 - - - - - - - + 2 - <25% -
2 0-10 9.21 - - - - - + - + 6 - <50% -
10-20 7.87 0.58 - - - - + - + 7 - <36% -
3 0-10 8.96 - - - - - - - + 4 - <65% -
10-20 8.37 0.60 - + - - + - + 3 - <32% -
4 0-20 9.49 - - - - - - - + 5 - <42% -
20-50 7.83 - - + - - - - + 6 - <30% -
5 0-10 8.29 - - - - - - - + 4 - <34% -
10-30 6.45 0.37 - + - - - - + 5 - <19% - 30-60 3.66 1.51 27-36 21-25 0-3 1-15 0-4 + + 37 - <7% -
6 0-10 5.58 - - + - - - - + 1 - <21% +
10-20 5.17 2.71 46-64 25-34 0-8 4-39 0-11 - + 1 - <13% - 20-30 5.36 2.77 47-65 26-35 0-8 4-39 0-11 - + 4 - <11% - 7 0-10 5.67 2.90 48-68 28-38 0-9 1-41 0-11 - + 2 - <20% - 10-30 4.26 2.09 36-49 22-29 0-6 1-28 0-7 - + 8 - <11% (+) 30-50 2.27 1.60 24-37 7-15 0-6 4-30 0-8 >24 >14 17 - <2% + 50-70 1.85 1.41 20-33 5-12 0-6 1-28 0-7 >14 >8 20 - <1% +
8 0-5 6.79 - - + - - - - + 6 6 <20% -
5-10 4.06 3.62 47-84 6-27 0-17 3-78 0-22 + + 17 25 <9% - 10-20 5.32 2.54 44-60 27-36 0-7 1-32 0-9 + + 3 11 <5% - 20-40 3.26 2.70 36-63 7-21 0-12 3-56 0-15 + + 10 28 <4% - 40-50 0.63 11.00 83-90 - + + + >11 >6 23 57 <1% - 9 0-10 7.02 0.49 - + - - - - + 2 tr <21% + 10-30 6.12 0.58 - + - - - - + 5 - <15% + 30-40 5.61 0.57 - + - - - - + 9 tr <12% - 10 0-10 7.86 0.30 - + - - - - + 2 - <21% - 10-30 3.65 3.47 43-81 4-24 0-17 2-77 - + + - - <3% + 30-70 3.50 3.72 44-87 0-23 0-19 2-86 - + + - - <2% + 70-100 3.23 3.40 41-79 1-21 0-17 3-79 - >13 >8 - - <1% + 100-130 3.35 3.53 42-82 1-22 0-18 2-82 - >16 >9 - - <2% + Analysis of other soil fractions
Other soil fractions were also analysed for all the samples from the soil profiles investigated. The thermoanalytical properties of the different fractions: clay (<0.002 mm), fine sand (0.02–0.2 mm) and coarse sand (0.2–2mm), are summarized below for all the samples, but because of the large number of samples thermoanalytical curves are only presented for selected samples.
The dehydration water loss of clay fractions typically occurs between 70 and 100 oC. In the majority of the samples the typical inflexion peaks of the smectite group minerals also appeared around 170 oC. The characteristic exothermic peak at 300 oC could be explained by the presence of organic or other amorphous matter, strongly bound to the clay minerals, and very resistant to decomposition. The endothermic peaks of dehydroxylation reactions are characteristically found at 500
oC and around 600–700 oC. When calcite mineral was also present in a clay fraction, its peak was observed on the DTG curve between 700 and 800 oC.
Endothermic and exothermic processes were also characteristic of the clay fractions above 900 oC, indicating the phase transitions of the clay minerals. Figure 4 depicts the thermoanalytical curves of the clay fraction sedimented from the 20–40 cm layer of soil profile No. 8. Dehydration occurred at 81 oC, while the inflexion peak of the smectite group minerals appeared at 173 oC. The presence of organic and/or amorphous (“ferrihydrite”) phases was evidenced by the weak exothermic process starting at around 300 oC. The dehydroxylation of clay minerals was noted at 503
oC, followed by smaller flat, extenuated peaks at 592 oC and 644 oC (clay minerals/chlorites) on the DTG curve. Finally, the decomposition of calcite took place at 717 oC. The calcite content of the sample was 5% based on the mass loss.
Figure 4
Thermoanalytical curves of the clay fraction sedimented from the 20-40 cm layer of soil profile No. 8.
Dehydration of the fine sand fraction takes place at very low temperatures, between 50 and 100 oC. On the HF curve of some of the fractions a larger or smaller exothermic peak could be observed around 300 oC, which may indicate the presence of “ferrihydrite” and/or goethite. Endothermic peaks around 500 oC and 650 oC (characteristic of clay minerals/chlorites) only appeared on the HF curve of a few fractions, but were not typical of the majority of fine sand fractions. The presence of carbonate minerals was detected above 700 oC. The most characteristic mineral in the fine sand fractions was quartz, appearing on the HF curve at 570 oC.
Figure 5 illustrates the thermoanalytical curves of the fine sand fraction sedimented from the 20–50 cm layer of soil profile No. 4. Dehydration took place at 74 oC,
while amorphous “ferrihydrite” and/or goethite phases were indicated by a small exothermic reaction with an onset temperature of 300 oC. Quartz gave a peak at 570
oC. The decomposition of calcite took place at 780 oC, and the calcite content of the sample was 25%.
Figure 5
Thermoanalytical curves of the fine sand fraction sedimented from the 20-50 cm layer of soil profile No. 4.
The dehydration of the coarse sand fraction also took place at very low temperatures of 50–80 oC. A small exothermic peak at around 300 oC indicated the presence of “ferrihydrite” and/or goethite. The majority of the coarse sand fractions were characterized by small endothermic peaks at 450–500 oC and 600–700 oC (clay minerals/chlorites), but the proportion of these minerals was quite low even in these fractions. Calcite appeared above 700 oC and in some of the samples dolomite was also detected. Quartz was highly characteristic of the coarse sand fractions (570–575 oC).
Figure 6
Macroscopic appearance and thermoanalytical curves of coarse sand grains consisting of goethite and a small amount of clay mineral
Figures 6–10 illustrate different types of grains separated macroscopically from the coarse sand fraction of the 30–50 cm layer of profile No. 7. The figures also include the thermoanalytical curves of the respective grain types.
The dark yellow/brown rounded, longish grains shown in Figure 6 had the characteristic appearance of goethite. A certain amount of clay mineral could also be detected on the thermoanalytical curves at 500 °C. Dehydration occurred at 64
oC, and the endothermic peak at 298 oC was characteristic of goethite. The goethite content of the sample was 75% based on the mass loss.
The grains shown in Figure 7 were transparent and were of various sizes, which are characteristic traits of quartz. Quartz was also suggested by the endothermic peak at 570 oC on the HF curve. Calcite was also indicated (825 oC) with a content of 23%. Based on this data the quartz content was estimated as 77%.
Figure 7
Macroscopic appearance and thermoanalytical curves of coarse sand grains consisting of quartz and calcite
The grains in Figure 8 were whitish-yellow with a roundish shape. Some of the grains were apparently crystalline. Based on their appearance, they were thought to be calcite, which was confirmed by thermal analysis. Calcite decomposition had a peak temperature of 862 oC. The content of calcite was estimated as 84%.
Figure 8
Macroscopic appearance and thermoanalytical curves of coarse sand grains consisting of calcite
The set in Figure 9 consisted of whitish-yellow grains with cavities containing iron deposits. Based on their appearance they were identified as weathered calcite.
Both the slightly widening peak on the DTG curve and the second derivative curve (DDTG) indicated dolomite. Peak temperatures were found at 805 oC and 866 oC for dolomite and calcite respectively. The dolomite content of the sample was 31%
and the calcite content 17% based on the mass loss.
Figure 9
Macroscopic appearance and thermoanalytical curves of coarse sand grains consisting of calcite and dolomite
The white and grey microcrystalline grains in Figure 10 had the characteristic appearance of calcite. Thermoanalytical curves evidenced the presence of high purity (97–98%) calcite. Peak decomposition temperatures of 876 oC and 857 oC were found for the grey and white calcite, respectively.
Figure 10
Macroscopic appearance and thermoanalytical curves of coarse sand grains consisting of grey calcite (upper figure) and white calcite (lower figure).
Based on the results of thermal analysis the most characteristic clay mineral in the fine earth fractions was smectite, but they also included kaolinite, (chlorite), illite, calcite, dolomite and quartz. Besides organic substances, amorphous
“ferrihydrite” and/or goethite was also present in some samples. The minerals which could be determined best, both qualitatively and quantitatively, were calcite and dolomite. Surprisingly, calcite was not found in all the samples.
The detailed analysis of the other soil fractions showed that clay minerals and
“ferrihydrite” were enriched to a greater extent in the small-grained (clay) fractions, while quartz, calcite and dolomite were found predominantly in larger-grained (fine and coarse sand) fractions. It is well known that calcite may be of primary or secondary origin (SZENDREI,1994). The calcite and dolomite occurring in the sand fractions (primary calcites) originated from the physical weathering of the parent material. Calcite may also be present in low amounts in the fine clay fractions, formed in situ by precipitation from soil solutions (secondary calcites) (HORVÁTH, 2005). The presence of goethite in the clay fraction in association with amorphous/organic substances can only be presumed. In the fine and coarse sand fractions, however, goethite often occurs together with amorphous “ferrihydrite”, as was evidenced by the shape of the thermoanalytical curves. The thermal analysis of the grains macroscopically separated from the coarse sand fraction enabled the minerals to be precisely identified both qualitatively and quantitatively.
Figure 11
Relationship between the amounts of organic matter content determined by thermal analysis and by the FAO method
The total content of organic substances was also estimated during thermal analysis and compared to the humus contents determined with basic chemical analysis. A strong significant correlation was found between the two methods for all the samples investigated (Figure 11). The values determined using thermal analysis were somewhat higher than the respective humus contents, which was attributed to the presence of amorphous phases bound to organic matter. The application of
thermoanalytical methods allows the organic matter content of the soil to be determined without the use of chemicals.
Table 3
Absolute contents of mineral phases in the fine earth fractions, calculated by correcting the phase percentage values of minerals determined by XRPD with the total organic matter content measured with thermal analysis. *Including illite (illite/montmorillonite interlayer structures); n.d.: not detected; Q: quartz; Ill: illite; Mm: montmorillonite; Kao: kaolinite; Pl:
plagioclase; Ort: orthoclase; Goe: goethite; Calc: calcite; Dolo: dolomite; Chl: chlorites.
Soil Profile
Layer cm
Q
% Ill
% Mm
% Kao
% Pl
% Ort
% Goe
% Cal
% Dolo
% Chl
%
1 0-5 30 11 n.d. 8 11 2 3 2 n.d. n.d.
5-20 36 14 n.d. 11 5 4 4 2 n.d. n.d.
2 0-10 20 3 3 8 3 3 3 8 n.d. 3
10-20 29 3 3 3 8 3 2 10 n.d. 3
3 0-10 18 - 9* n.d. n.d. n.d. n.d. 7 n.d. n.d.
10-20 34 - 17* 4 3 3 n.d. 7 n.d. n.d.
4 0-20 29 - 9* 9 7 2 n.d. 2 n.d. n.d.
20-50 35 - 8* 7 11 3 n.d. 5 1 n.d.
5 0-10 26 5 3 10 7 7 n.d. 8 n.d. n.d.
10-30 37 7 4 7 8 7 4 8 1 n.d.
30-60 23 5 5 9 5 5 5 37 n.d. n.d.
6 0-10 44 4 4 10 8 4 2 n.d. n.d. 4
10-20 39 4 9 9 12 7 3 n.d. n.d. 4
20-30 34 4 9 11 13 4 3 7 n.d. 4
7 0-10 40 6 4 12 5 5 4 n.d. n.d. 4
10-30 37 6 5 11 7 4 4 9 n.d. 4
30-50 34 10 5 8 8 8 5 15 n.d. 6
50-70 34 10 5 8 8 6 5 17 n.d. 6
8 0-5 36 - 12* 5 6 2 n.d. 3 16 n.d.
5-10 14 - 5* 5 7 7 n.d. 7 46 n.d.
10-20 28 - 11* 5 8 2 8 9 24 n.d.
20-40 24 - 8* 5 3 2 5 12 38 n.d.
40-50 3 - 2* 3 2 n.d. n.d. 10 79 n.d.
9 0-10 44 - 16* 4 8 6 n.d. n.d. 2 n.d.
10-30 47 - 10* 4 9 7 n.d. 9 n.d. n.d.
30-40 44 5 9* 4 9 5 n.d. 9 3 n.d.
10 0-10 48 10 n.d. 16 n.d. n.d. 4 2 n.d. n.d.
10-30 58 5 10 15 n.d. n.d. 10 n.d. n.d. n.d.
30-70 49 5 10 24 n.d. n.d. 10 n.d. n.d. n.d.
70-100 44 12 10 23 n.d. n.d. 10 n.d. n.d. n.d.
100-130 44 10 10 25 n.d. n.d. 10 n.d. n.d. n.d.
XRPD analysis of the fine earth fractions
In most cases thermal analysis only provides an estimation of the amounts of the mineral phases (except for calcite and dolomite). Thus, the XRPD analysis of the fine earth fractions was also carried out to verify the calculated data. It was
found that the ratios of the individual crystalline phases in the samples did not always add up to 100 %. This was explained by the amorphous matter content of the samples, which could not be determined precisely by XRPD. Thus, the calculated phase percentages are not absolute values, but relative values compared to the sum (100%) of the crystalline phases. The simultaneous application of thermoanalytical and XRPD methods enables soil phases to be studied in more detail. Thermoanalytical methods are suitable for qualitative assessment and for the precise quantitative estimation of organic/amorphous soil phases in the presence of various crystalline phases.
The relative percentage values of the crystalline phases determined with XRPD were corrected using the organic matter content measured with thermal analysis to obtain the absolute concentrations of minerals in the soil samples. The results are detailed in Table 3.
Recalculating the results of XRPD measurements using the organic matter contents determined by thermal analysis had the greatest effect on the calcite and quartz contents. Both methods are suitable for the quantitative determination of calcite, but the results of XRPD need to be corrected with the organic matter content, which requires supplementary measurements. With thermal analysis the calcite content can be determined directly in a single measurement.
Thermoanalytical methods are thus better suited for the determination of calcite content than the XRPD method. Summarizing the results of the XRPD measurements the following mineral phases were found in the samples: quartz, illite, montmorillonite, illite/montmorillonite interlayer structures, kaolinite, feldspars, goethite, calcite, dolomite and chlorites. Besides the mineral phases the samples also contained significant quantities of organic matter and amorphous material.
XRPD analysis of the basic rock
The results of XRPD analysis on the basic rock (Table 4) indicated high purity calcite, proving that the large amounts of silicates in the soil samples could not be the product of the weathering of the basic rock.
Both thermoanalysis and XRPD analysis yielded new results on the relatively unexplored mineral composition of soils formed in limestone on the Bükk Highlands. The silicate and quartz contents in the soil samples were very high, suggesting that these soils could not have originated solely from the weathering of the limestone basic rock. A comparison of different methods for determining calcite content (Scheibler-type calcimeter, thermal analysis, XRPD) revealed that thermoanalysis is probably the most suitable method, as the accurate determination of calcite content with the other two methods is influenced by the presence of organic substances. Thermal analysis is therefore a useful supplementary technique for mineralogical research, especially as regards the carbonate contents of soils formed on limestone, in spite of the fact that this technique has been pushed into the background recently compared to other instrumental analytical techniques.
Table 4
Mineral composition of the basic rock (that of soil profile 1 was not measured). n.d. = not detected
Soil profile Quartz % Calcite % Dolomite %
1 - - -
2 n.d. 100 n.d.
3 n.d. 100 n.d.
4 1 99 n.d.
5 1 99 n.d.
6 n.d. 100 n.d.
7 0.5 99.5 n.d.
8 0.5 65 34.5
9 3 83 14
10 0.5 99.5 n.d.
Acknowledgements
This research was funded by the EFOP-3.6.1-16-2016-00018 project:
“Improving the role of research + development + innovation in the higher education through institutional developments assisting intelligent specialization in Sopron and Szombathely”. Thanks are due to Mária Anna Keresztes for technical assistance with the XRPD analysis of the basic rock samples, to Dr. István Sajó for his help with the XRPD analysis of the soil samples and to Dr. Mária Földvári for her help with thermal analysis.
References
BARTA, K., TANÁCS, E., SAMU, A. & KEVEI-BÁRÁNY, I., 2009. Mapping of Hungarian rendzinas in the WRB, the international soil classification systems.
Agrokémia és Talajtan. 58. (1) 7–18.
BELLÉR, P., 1997. Methods of Soil Investigation. (In Hungarian) Dept. of Soil Site Survey, Faculty of Forestry, University of Sopron. Sopron.
BUZÁS,I. (ed.), 1993. Manual of Soil and Agrochemical Analysis 1. (In Hungarian) INDA 4321 Kiadó. Budapest. pp. 317–340.
DEÁK,F.,FÖLDVÁRI,M.&MINDSZENTY,A.,2002.A new tool to detect exposure surfaces in shallow water carbonates depositional environments. Acta Geologica Hungarica. 45. (3) 301–317.
DÖVÉNYI, Z. (ed.), 2010. Register of microregions of Hungary, 2nd revised and extended edition. (In Hungarian) Magyar Tudományos Akadémia, FKI.
Budapest. pp. 736–745.
FAO, 1990. Guidelines for Soil Description. 3rd Ed. Soil Resources, Management and Conservation Service, Land and Water Development Division. FAO.
Rome.
FEKETE,J.,CSIBI,M.,&STEFANOVITS,P.,2008. Significance and characteristics of Hungarian red clays. (In Hungarian) Talajvédelem. Special edition. 585–594.
FEKETE,J.,2010.Red clays and red soils of Hungary. (In Hungarian) Tájökológiai Lapok. 8. (2) 223–388.
FÖLDVÁRI, M., 1986. Thermoanalytical methods in soil research. (In Hungarian) Módszertani Közlemények. IX. (1) MÁFI. Budapest.
FÖLDVÁRI, M., 2008. Thermal decomposition system of the minerals and the application of thermogravimetry in the earth science. Annual Report of the Geological Institute of Hungary 2006. MÁFI. Budapest. 169-183.
FÖLDVÁRI,M., 2011. Handbook of thermogravimetric system of minerals and its use in geological practice. Occasional Papers of the Geological Institute of Hungary. 213. Budapest.
FÖLDVÁRI,M.& KOVÁCS-PÁLFFY,P.,2002. Mineralogical study of the Tengelic Formation and the loess complex of Tolna Hegyhát and Mórágy Hills areas.
Acta Geologica Hungarica. 45. (3) 247–263.
HALÁSZ, G. (ed.), 2006.Silvicultural regions of Hungary. (In Hungarian) Állami Erdészeti Szolgálat. Budapest.
HORVÁTH,T.,2005.Assessment of trace element and mineral composition of soils with X-ray analytical methods. (In Hungarian) PhD thesis. University of Veszprém. Veszprém.
JÁRÓ, Z., 1999. Soil site survey. (In Hungarian) Agrárszakoktatási Intézet.
Budapest.
LESS,G.,KOVÁCS,S.,PELIKÁN,P.,PENTELÉNYI,L.&SÁSDI,L.,2005.Geology of the Bükk Mountains. Interpretation of the geological map of the Bükk Mountains (1:50 000). (In Hungarian) Magyar Állami Földtani Intézet.
Budapest.
MARSI,I.,DON,G.,FÖLDVÁRI,M.,KOLOSZÁR,L.,KOVÁCS-PÁLFFY,P.,KROLOPP, E., LANTOS,M., NAGY-BODOR, E. & ZILAHI-SEBESS, L., 2004. Quarternary sediments of the north-eastern Mórágy Block. Annual Report of the Hungarian Geological Institute 2003. 343–370.
MICHÉLI, E., 2011. Expression of soil-forming processes in soil classifications based on diagnostic principles. Agrokémia és Talajtan. 60. (1) 17–32.
MICHÉLI,E.,FUCHS,M.,HEGYMEGI,P.&STEFANOVITS,P., 2006. Classification of the major soils of Hungary and their correlation with the World Reference Base for Soil Resources (WRB). Agrokémia és Talajtan. 55. (1) 19–28.
MICHÉLI,E., FUCHS, M.,LÁNG, V., SZEGI, T.,DOBOS,E.& SZABÓNÉ KELE, G., 2015. Proposal for the reformation of the Hungarian classification: basic principals, systems, fundamental units. (In Hungarian) Agrokémia és Talajtan.
64. (1) 285–297.
MSZ 08-0205:1978. Investigation of the physical properties and moisture balance of soils. (In Hungarian)
MSZ 08-0206-2:1978. Investigation of some chemical properties of soils.
Laboratory investigations. (In Hungarian)
MSZ 18094-14:1986. Investigation of soil corrosion. Determination of grain size distribution. (In Hungarian)
NÉMETH,E.,SAJÓ,I.&BIDLÓ,A.,2014.Mineral composition as indicator of the origin of soils formed on carbonate rocks in the Bükk Highland (NE Hungary).
Agrokémia és Talajtan. 63. (1) 39–48.
STEFANOVITS,P., 1992. Soil Science. (In Hungarian) Mezőgazda Kiadó. Budapest.
STEFANOVITS, P., FILEP, G. & FÜLEKY, G., 1999. Soil Science. (In Hungarian) Mezőgazda Kiadó. Budapest.
SZAKÁLL,S.,2007.Structural classification of minerals, 2nd edition. (In Hungarian) Miskolci Egyetemi Kiadó. Miskolc.
SZENDREI,G., 1994. Minerals in soils. (In Hungarian) Módszertani Közlemények.
MÁFI. 14. (1) Budapest.
SZENDREI,G., 1998. Soil Science. (In Hungarian) ELTE Eötvös Kiadó. Budapest.
TAN,K.H., HAJEK,B.F. &BARSHAD,I.,1986. Thermal analysis techniques. IN: KLUTE, A. (ed.), 1986: Methods of Soil Analysis, Part I. Physical and Mineralogical Methods. Agronomy Monograph. 9. American Society of Agronomy, Madison, WI, pp. 151–183.
VAN DER PLAS,L.&VAN REEUWIJK,L.P.,1974. From mutable compounds to soil minerals. Geoderma. 12. 385–405.
VOJTKÓ,A., (eds.), 1995. Vegetational map of the Nagy-fennsík. (In Hungarian) IN: PELIKÁN,P.(ed.),2002. Geological map of the Bükk Mountains. 1:50 000.
MÁFI. Budapest.