Introduction
Soil organic matter (SOM) is an important component of soil. As a result of input (mainly plant residuals) and output (miner- alization) SOM is an ever-changing holistic system that is complex and spatially diverse, therefore cannot be described or modelled adequately still today even though it is a key parameter of sustainability (Jancsovszka, P.
2016). The first, widely accepted theory was the humus concept (Kononova, M.M. 1966), which separated SOM to single molecules based on their extent and polymerization.
Main components were classified as humic, fulvic substances and humin that belonged to
colloid size and polymerisation range of an increasing order respectively (Stevenson, F.J.
1982). According to this theory the stability of a certain SOM molecule is proportional of molecular extent, polymerisation and aro- maticity. This way the process of humifica- tion was presumed to be constructed more complex molecular structures to be more resistant against mineralisation. The proxies applied to measure SOM composition, there- fore based on humic substance solubility in various solvents (Kononova, M.M. 1966).
In recent times studies proved that SOM highly interacted with the mineral phase of the soil, creating various types of complexes that affected SOM stability more than mo-
Soil organic matter characterisation by photometric indices or photon correlation spectroscopy: are they comparable?
Gergely JAKAB1, Ádám RIEDER2, Anna Viktória VANCSIK1 and Zoltán SZALAI1
Abstract
Soil organic matter (SOM) is a complex component of soil that acts as basis for most of the soil forming pro- cesses. SOM characteristics, including quantity, spatial distribution, molecular size and composition, are the results of environmental effects. SOM is definitely hard to be measured in situ, therefore most investigations are based on incomplete SOM extractions or other proxies. Even though, the traditional humus concept that polymerisation degree of SOM molecules are proportional to their stability are refuted, the concerning proxies for SOM composition predictions are still in use. These are mainly based on the photometric investigations of alkali extractions. However, this extraction method received many rightful critiques, it still could be a possible alternative, since it is quite simple, cheap and represented much more SOM than water extractions. This study aimed to compare SOM composition results based on carbon-nitrogen ratio and alkali extractions measured by UV-vis spectrometry and photon correlation spectrometry on the same soil used as forest and crop field.
SOM composition proxies provided inconsistent results using the NaOH extraction method compared with photon correlation. Therefore, the application of organo-mineral SOM protection theory in association with the photometric proxies seems to be difficult in the case of the investigated Luvisol. On the other hand, photon correlation spectroscopy provided results in line with the published results of the organo-mineral stabilization theory that suggested alkali extraction with special care could be a useful alternative. However, due to the known imperfections of it, the application of in situ measurement methods would be preferable.
Keywords: organic matter composition, tillage, soil carbon, dynamic light scattering
1 Geographical Institute, Research Centre for Astronomy and Earth Sciences of the Hungarian Academy of Sciences. H-1112 Budapest, Budaörsi út 45. E-mails: jakab.gergely@csfk.mta.hu, vancsik.anna@csfk.mta.hu, szalai.zoltan@csfk.mta.hu
2 University of Leeds, Earth Surface Science Institute, LS2 9JT Leeds, UK. E-mail: eeari@leeds.ac.uk
lecular composition alone (Zimmermann, M. et al. 2007; Schmidt, M.W.I. et al. 2011).
Accordingly, SOM could not be clearly clas- sified on the basis of the humus concept (Lehman, J. and Kleber, M. 2015). However, according to this theory stable SOM was di- rectly related to the fine particles of the soil (Hassink, J. 1997; Wiesmeier, M. et al. 2014) the role of aggregates was less clear. Six, J.
et al. (2002) revealed that SOM takes a major role in forming and stabilizing these aggre- gates, which are thus considered to be stor- age vessels for SOM by protecting it from decomposition (Meng-Yun, L. et al. 2014;
Jakab, G. et al. 2016). Therefore, in general, SOM is classified to i) mineral phase asso- ciated, recalcitrant pool with long turnover time; ii) aggregate associated chemically and biologically active pool with short turnover time; iii) particulate organic matter (often called light fraction), which consists slightly degraded plant tissue and iv.) water soluble pool (Filep, T. et al. 2015). Moreover, nowa- days, the application of highly intact biochar in soils is coming to the focus (Kása, I. et al.
2016; Dencső, M. et al. 2017).
Natural SOM systems can be disturbed by physical and chemical effects, such as agri- cultural land use. Many studies have shown that cultivation can change the structure of SOM by affecting aggregate size and stability (Spaccini, R. and Piccolo, A. 2013), carbon/
nitrogen (C/N) ratios (John, B. et al. 2005;
Rieder, Á. et al. 2018) and soil organic carbon (SOC) quantity and distribution (Falkengren- Gerup, U. et al. 2006). Meng-Yun, L. et al.
(2014) demonstrated that easily oxidisable organic carbon tended to be enriched in macro-aggregates instead of within micro- aggregates, and in addition their data con- firmed aggregate breakdown in farmlands.
These combined effects can lead to massive SOC loss in regions of cultivated land (Plaza- Bonilla, D. et al. 2014; Bilandžija, D. et al.
2017). In contrast, Rabbi, F.S.M. et al. (2014) demonstrated that SOC mineralization rates and protection was irrespective of aggregate size. The effect is clearer under tropical con- ditions while not always so obvious in the
temperate zone, where the influence of global warming (Mika, J. and Farkas, A. 2017) makes the picture more complex.
Zimmermann, M. et al. (2007) published a fast procedure to separate SOM pools, that combines physical and chemical fractiona- tion techniques, such as density separation and NaOCl oxidation. As Poeplau, C. et al.
(2013) pointed out in their study, this method is likely to become widely used.
Parallel with the conceptual development, the investigation methods and technics were also improved. X-ray spectromicroscopy as an important part of in situ investigations of organo-mineral interactions became more available (Lehman, J. et al. 2008). Increasing number of published studies are based on other in situ technics such as Raman spec- troscopy and Fourier transform infrared spectroscopy, nano scale secondary ion mass spectrometry (Mueller, C.W. et al. 2017) even though they are less widespread for routine measurements because of financial reasons.
This could be the reason why humus concept proxies based on SOM solubility are still in progress. Moreover, using these extractions, more up-to-date analytical methods such as static (SLS) and dynamic light scattering (DLS) can be used to measure molecular weight and size values of SOM. Despite its efficiency, only a few studies (Palmer, N.E.
and Wandruszka, R. 2001; Esfahani, M.R. et al. 2015) have applied this method. However, NaOH extraction method has received many critiques (Rice, J.A. 2001; Lehman, J. and Kleber, M. 2015) it is still widely applied (Wang, K. and Xing, B. 2005; Chaudhuri, S.
et al. 2013; Reddy, S. et al. 2014). Therefore, it is still a question whether the NaOH extrac- tion based photometric proxies developed for the humus concept are applicable in com- bination with the organo-mineral theory.
This study aims to compare SOM com- position results gained by the fractionation method of Zimmermann, M. et al. (2007) in combination with alkali extraction as a proxy of the humus concept. Our hypothesis is that traditional photometry based results are comparable to those received using photon
correlation spectroscopy. Reaching this aim the same soil under different land uses were investigated in order to determine how land use change affects SOC content and SOM composition of the various pools.
Materials and methods Study site
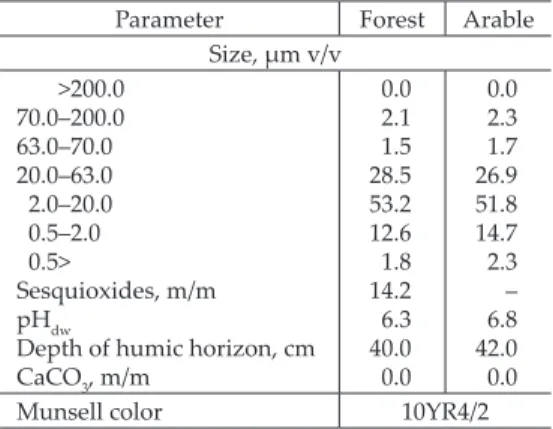
Soil samples were taken in 2015 near Kis- bárkány, Hungary 48°00’55.3”N; 19°40’24.5”E (Figure 1), where the mean annual tempera- ture is between 9–12 °C and precipitation is 600 mm (Dövényi, Z. 2010). This site was a typical example of forest clearance during the 18th century as it was widespread in the hilly parts of Hungary at that time (Szalai, Z. et al. 2016). Two quite similar, slightly eroded soil profiles were sampled and described as a haplic Luvisol (IUSS WG WRB, 2015) on Oligocene siltstone (Table 1).
Fig. 1. Location of the sampling sites under forest and arable field Google Earth
Table 1. Main parameters of the investigated topsoil*
Parameter Forest Arable
Size, µm v/v >200.0
70.0–200.0 63.0–70.0 20.0–63.0 2.0–20.0 0.5–2.0 0.5>
Sesquioxides, m/m pHdw
Depth of humic horizon, cm CaCO3, m/m
0.02.1 28.51.5 53.212.6 14.21.8 40.06.3 0.0
0.02.3 26.91.7 51.814.7 2.3– 42.06.8 0.0
Munsell color 10YR4/2
*Partly based on Németh, T. and Sipos, P. 2006.
Sampling sites were chosen on flat areas (slope steepness < 3%). Mineralogy of the soil was characterised by 40–70 per cent quartz and 5–15 per cent feldspars (Sipos, P.
2004). The predominating clay mineral was smectite (Németh, T. and Sipos, P. 2006).
100 m
0 50
Kisbárkány Kisbárkány H U N G ARY
The first profile was situated in a forest which has existed for more than 120 years, while the second was in an area which had been converted to an arable field before the 19th century according to the Third Military Survey of Hungary (1869–1887). Forest was dominated by Quercus robur with the appear- ance of Ulmus campestris < 10 per cent. Crop production on the arable field was based on autumn ploughing tillage with < 5 kg ha per year nitrogen fertilizer application in spring as an average of 20 years. Main crops were wheat, maize, rape and sunflower.
Sampling
One sample from the forest and one sample from the crop field as composites of 9 sub- samples taken from the diagonals of two 100 m2 squares were collected from the 0–10 cm layer of the topsoil (Rowel, D.L. 1994). Sub- samples were mixed in order to create a spa- tially representative sample. Samples were dried and crushed, after which the > 2,000 µm particles were removed by dry-sieving.
Soil fractionation
The Zimmermann fractionation method was improved by Poeplau, C. et al. (2013) and in its present form widely used and accepted.
The authors decided to use this method for compatibility reasons to the RothC model (Coleman, K. and Jenkinson, D.S. 1996) for possible further application. Fractionation procedures were as follows, 30 g of each sam- ple were taken to 150 ml of distilled water then ultrasonic dispersion with 22 J/ml was applied. Then the samples were wet-sieved over a 63 µm screen in order to separate the sand, aggregate and particulate organic mat- ter (POM) fraction from the rest of the sam- ple. Particles < 63 mm were centrifuged (at 3,500 RPM for 15 min) in order to separate the silt and clay (s+c) and the dissolved (DOC
< 0.45 mm) fraction (Popleau, C. et al. 2013).
After the centrifugation the liquid compo-
nent including DOC was decanted, whereas the solid phase was considered as s+c frac- tion. 1 g of the s+c fraction was oxidized with 6 per cent NaOCl in order to determine the resistant SOC (rSOC) content. Finally, the >63 mm fraction was separated by density. The heavy fraction (> 1.8 g cm-3) contained the sand and aggregates (S+A), while the light fraction (< 1.8 g per cm3) was POM.
UV-Vis spectroscopy
For SOM extraction the most traditional al- kali solution method was applied since this was quite simple and therefore, still in use in recent studies (Nierop, K.G.J. et al. 2001). 40 mL 0.5 M NaOH were added to 4 g of sample, which were then shaken for 24 h according to the method of Galantini, J. A. et al. (2004) under non reductive conditions. Following this step, the solvent was centrifuged at 3,500 RPM for 15 min (Szalai, Z. et al. 2016) and right after that measured by photometry in order to avoid oxidation and recombination.
A Shimadzu UV-3,600 spectrophotometer was used to measure the absorbance values of the extractions depending on the wavelength.
The total spectrum was recorded from 180 nm to 1,000 nm wherein the E2/E3 (245/265 nm), E4/E6 (400/600 nm) and Ultraviolet Absorbance Ratio Index URI (210/254 nm) ratios were calculated as they are in connec- tion with SOM composition (Tan, K.H. 2003;
Guo, M. and Chorover, J. 2003; Her, N.G.
et al. 2008; Nadi, M. et al. 2012).
Dynamic light scattering
This method was chosen since it needed the same alkali SOM extraction as the pho- tometric method did, therefore indepen- dently from extraction method the results were directly comparable with each other.
DLS measurements were made using a Mal- vern Zetasizer Nano instrument where 0.5 M NaOH was determined as the solvent and extracted SOM was determined as the
substance. Measurements were carried out right after the extraction process as it was de- scribed at photometric measurements. The resulting histograms are based on volumetric percentage of the averages of at least three repetitions. (In case of high diversity two ad- ditional repetitions were created.)
SOC, particle size and pH measurement Soil organic carbon (SOC) and total nitrogen TN data were achieved applying a Tekmar Dohrmann Apollo 9,000N instrument, which used dry combustion at 800 °C (Szalai, Z.
et al. 2016). This instrument is additionally capable of measuring solid state samples, and so there was no need for prior sample preparation (Buurman, P. et al. 1996). Particle sizes of the bulk samples were determined in a range of 0.2-2000 µm using a Fritch An- alysette 22 Microtech laser diffractometer by applying 0.5 M sodium pyrophosphate and 15 min ultrasonic treatment for disaggrega- tion (Centeri, Cs. et al. 2015). The device pro- vided 105 size classes those were grouped to 10 according to the USDA system (Table 1).
pH values were determined using a potenti- ometer according to Buurman, P. et al. (1996).
Statistical analysis
SOC, DOC and TN values were determined as three repetitions at least. If SD exceeded 10
per cent additional measurements were car- ried out. Normality of the data was checked using Shapiro-Wilks test and transformation was carried out if that was needed. Differences among the averages were tested using one-way ANOVA with post hoc Tukey test. Since POM had one order higher values this fraction was excluded from the ANOVA for SOC and TN.
Results and discussion
Sand + Aggregate fractions and SOC distribution
The most relevant component of the bulk soil was in aggregated form and was classi- fied as S+A by the fractionation under both land uses. The ratio of aggregates was higher under forest vegetation (Table 2). This ~ 10%
difference did not highlight relevant changes so we cannot conclude that it was generated by land use conversion. In contrast, there was a difference between the SOC concentration of S+A, POM and bulk soil under forest and arable land, as under forest the SOC concen- tration is twice as much as under arable land use in all these fractions.
It is in accordance with the results of Falkengren-Grerup, U. et al. (2006) approxi- mately 48 per cent of the SOC has mineral- ized under arable use due to intensive cul- tivation during the last ~200 years (Table 2).
Moreover, SOC distribution among frac- tions has also varied substantially between Table 2. Carbon content and fractional distribution of the samples fractionated by the Zimmermann, M. et al. (2007) method
Soil fraction
Forest Arable
Soil mass,
%
SOC, g/kg
Proportion of SOC weighted with soil mass,
%
Soil mass,
%
SOC, g/kg
Proportion of SOC weighted with soil mass,
% S+A1
POM2 s+c3 (rSOC)4 DOC5+ (loss) Bulk soil
83.81.8 0.0 (7.3)7.2
–
182.818.8 19.7 (4.8) 0.005 (n. a.)
25.4
76.015.8 0.0 (1.4)6.8
–
71.78.8 0.0 (12.3)7.2
–
94.29.0 17.7 (10.7) 0.005 (n. a.)
13.3
39.650.7 7.81.9
–
1Sand and Aggregates, 2Particulate Organic Matter, 3silt and clay; 4resistant Soil Organic Carbon; 5Dissolved Organic Carbon; n. a. = no data.
the two land use types. Both S+A and POM fractions contained approximately half of their SOC content under arable field com- pared to the forest soil.
This changes could be the result of both mineralization and a lower degree of forma- tion (John, B. et al. 2005) beyond the potential soil erosion under both land uses. S+A had a much higher SOC loss than might be pre- dicted on the basis of decreasing aggregate stability (lower ratio of S+A), which conse- quently implies that there might be some ad- ditional/secondary aggregating agent besides SOM, such as sesquioxides (Barthes, B.G. et al. 2008). SOC content of the finest fraction (s+c) seemed to be decreasing as well because of tillage operations, even though this change was not significant (Figure 2).
In contrast, in this fraction, the volume of resistant SOC increased significantly, which suggested the overrepresentation of chemi- cally active SOC in mineralization. Moreover, tillage could improve SOM conservation on the mineral phase as it was reported by Fortuna, A. et al. (2003). SOC solubility did not change, and DOC presented less than 1 per cent under both land uses.
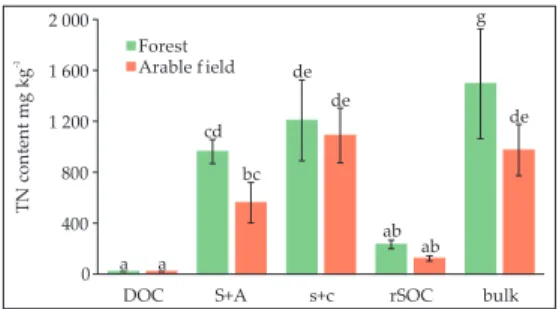
TN content of the fractions
TN distribution compared to that of SOC revealed the higher proportion (~ 40%) of dissolved component under both land uses (Table 3). The high volume of water soluble N content in topsoil of the forest does not necessarily indicate inorganic N but could be the result of increased microbiological activ- ity (Chatigny, M.H. 2003).
TN content of the bulk soils decreased (p<0.01) under cultivation, although TN re- lated to the finest size fractions (s+c, rSOC) did not changed significantly (Figure 3). This was in line with the classic SOM saturation theory of Hassink, J. (1997) and Wiesmeier, M. et al. (2014) who emphasized the role of <20µm fraction in SOM conservation.
Therefore, the TN difference of the bulk soils was solely due to the TN loss of aggregates under cultivation (Table 3) (Goebel, M. et al.
2005). The proportion of POM N increased by 5 times under cultivation, which increase is 3 times higher compared to carbon.
An additional SOM loss opportunity was detected wherein SOM was dissolved in sodium polytungstate (SPT). The potential error caused by this process is relatively unknown, although Crow, S.E. et al. (2007) estimated it to be up to 26 per cent.
Fig. 2. Differences among SOM fractionated by the Zimmermann, M. et al. (2007) method concerning soil organic carbon (SOC) content. Whiskers indi- cate standard deviation. Same letters indicate groups with no difference at p < 0.05 level. – s+c = silt and clay; rSOC = resistant soil organic carbon; DOC = dis- solved organic carbon; S+A = sand and aggregates;
bulk = bulk soil; Particulate organic matter (POM) is excluded from this figure because of a higher mag-
nitude value.
Fig. 3. Differences among SOM fractionated by the Zimmermann, M. et al. (2007) method concerning total nitrogen (TN) content. Whiskers indicate standard deviation. Same letters indicate groups with no dif- ference at p < 0.05 level. – s+c, rSOC, DOC, S+A, POM, bulk = For explanation see Fig. 2. POM is excluded from this figure because of a higher magnitude value.
C/N ratios of the fractions
Most fractions had a C/N ratio between 10 and 20, which is usual for temperate SOM (Bronick, C.J. and Lal, R. 2005). As it was ex- pected lowest values were related to the water soluble components, while outstanding high C/N values were found in the POM (of forest’s soil) and rSOC (of arable field’s soil) fractions (Figure 4), even though significant differences at p<0.05 were only found under forest.
Due to the lower C/N values of crops com- pared to those of the forest litter (Cools, N. et al. 2014), C/N arable field POM was lower, since this fraction referred to the most recent non degraded SOM. The most extreme value was
found in the rSOC fraction of the arable field, which could not be interpreted adequately.
Photometric indexes
The absorbance value at 280 nm revealed a consistent pattern that highlighted only the quantitative difference between each pair (Figure 5). Absorbance values normalized to SOC content prove that absorbance is not a direct function of SOC content. Since this property would be a proxy of aromaticity, the results suggested the same order of frac- tions under both land use types which was in contrast with both the results of C/N ratio of Table 3. Nitrogen content and fractional distribution of the samples fractionated
by the Zimmermann, M. et al. (2007) method Soil fraction
Forest Arable
Soil mass,
%
g/kgTN,
Proportion of TN weighted with
soil mass, %
Soil mass,
%
g/kgTN,
Proportion of TN weighted with soil
mass, % S+A1
POM2 s+c3 (rSOC)4 DOC5+ (loss) Bulk soil
83.81.8 0.0 (7.3)7.2
–
0.94.5 1.2 (0.2) 0.1 (n. a.)
1.4
51.75.2 0.0 (37.7)5.6
–
71.78.8 0.0 (12.3)7.2
–
0.54.1 1.1 (0.1) 0.1 (n. a.)
1.0
27.724.8 42.15.4 –
1Sand and Aggregates, 2Particulate Organic Matter, 3silt and clay; 4resistant Soil Organic Carbon; 5Dissolved Organic Carbon; n. a. = no data.
Fig. 4. C/N values of the SOM fractionated by the Zimmermann, M. et al. (2007) method under various land uses. Same letters indicate groups with no dif- ference at p < 0.05 level. – s+c, rSOC, DOC, S+A, bulk,
POM = For explanation see Fig. 2.
Fig. 5. Absorbance values of SOM solutions (in 0.5 M NaOH) at 280 nm fractionated by the Zimmermann, M. et al. (2007) method. Abs/SOC is the absorbance value normalized to the SOC content of the sample.
– s+c, rSOC, S+A, POM = For explanation see Fig. 2.
this study and the SOM stabilization theory of Schmidt, M.W.I. et al. (2011) and Lehmann, J. and Kleber, M. (2015). Moreover, Lützow, M. et al. (2006) pointed out that aromaticity is not necessarily indicative of higher resistance against degradation, especially in the most resistant clay associated fraction.
URI revealed different results compared to the E2/E3 and E4/E6 indexes. The only signifi- cant tendency regarding the URI is that the S+A fraction has the highest value under both land uses, which could refer to the higher pro- portion of aliphatic SOM components within the aggregates (Figure 6). The reason of ex- tremely high value at arable S+A is unknown.
The trend of E2/E3 and E4/E6 were different, even though both of them were presumed to be a proxy of SOM polymerisation degree. E4/ E6 indicated that the average polymerization degree of SOM is the highest in POM and low- est in the finest mineralogical fraction. This is in accordance with the traditional humus con- cept (Kononova, M.M. 1966), but contradicts the results of Chaudhuri, S. et al. (2013) who reported a tendentious decrease in E4/E6 value with maturation. Almost similar but they have got different values, which was also reported by Nadi, M. et al. (2012). E2/E3 did not indi- cate relevant differences among the fractions.
Moreover, there was no considerable differ- ence between the two land use types either.
Results of molecular size distribution
Most investigated organic substances had a polydisperse molecular size distribution.
The histograms were bi-, trimodal or pos- sessed even more peaks that referred to the heterogeneous compositions of SOM in each fraction (Figure 7).
There were trimodal distribution at both land uses concerning the POM fraction. The two higher molecular sized peaks were situ- ated at the same size under both forest and crop field, whereas the lowest peak that dom- inated the forest sample was shifted upward under crop field. In general, this compari- son implied that the forest had the relatively lower molecular-sized POM composition;
however, there was no relevant difference measured by the photometric indexes.
In the aggregate fraction (S+A), the size dif- ference between the forest and arable sam- ples was the highest with a very wide range of large molecular sizes under the forest.
Moreover, under forest, as it was expected, this fraction had the highest molecular size values compared to the others as was also reported by (Tan, K.H. et al. 2003). In case of S+A, the average molecular size was sig- nificantly lower under the arable land, even though photometric indexes revealed the op- posite tendency.
However, the highest peaks indicated nearly the same modulus value in both cas- es at approximately 550–600 nm, though the distribution is obviously different regarding the s+c fraction. The arable sample seemed to be much more diverse, and was shifted to the lower size direction, although no changes were indicated by C/N ratio.
Concerning the rSOC in either case, the main peak was shifted downwards and be- came narrower compared with those of the whole s+c fraction. This suggested that oxi- dation (hypochlorite treatment for labile frac- tion removal) diminished the molecular size in both cases, however, the more intensive degra- dation occurred under the forest. Accordingly, i) oxidization could degrade SOM molecules in a wide size range; ii) molecular sizes rang- Fig. 6. Photometric index values of SOM fractionated
by the Zimmermann, M. et al. (2007) method under different land uses URI = Ultraviolet Ratio Index; E2/E3
= ratio between absorbance values at 254 and 365 nm;
E4/E6 = ratio between absorbance values at 465 and 665 nm; s+c, rSOC, S+A, POM = For explanation see Fig. 2.
ing from 300–350 nm seemed to be more resist- ant, although other narrow peaks appeared depending on land use variations.
These spectra did not substantiate the re- sults obtained from the photometric indexes, even though they were in line with the re- sults of organo-mineral theory (i.e., POM is the direct function of plant cover, and ag- gregates contain the largest SOM molecules – Manzoni, S. and Porporato, A. 2009; Burd, A.B. et al. 2015).
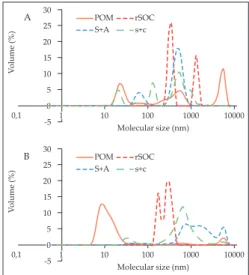
SOM compositions of the soil fractions under arable land and forest were compara- ble, but quite different (Figure 8). SOM of the crop field demonstrated substantial diver- sity, both the highest-and lowest-sized SOM molecules were associated with POM. In this case SOM molecules were found to have a more or less continuous size distribution, whereas under forest the fractions seemed to be clustered around certain size values.
Fig. 7. Soil organic matter molecular size distributions of the studied fractions (Zimmermann, M. et al. 2007) under different land uses. Spectra are averages. – s+c, rSOC, S+A, POM = For explanation see Fig. 2.
Fig. 8. SOM molecular size distribution of different fractions (Zimmermann, M. et al. 2007) under arable (A) and forest (B) land uses. – s+c, rSOC, S+A, POM =
For explanation see Fig. 2.
Conclusions
Even though OM input and land use are pre- sumed to be the primary driving forces of soil aggregation and SOM composition, no relevant difference was found in the volume of aggregation and aggregate stability due to former forest clearance and cultivation, how- ever SOC and TN concentrations decreased significantly in the investigated smectite rich Luvisol. Therefore, the binding capability of this particular soil was presumed to be the function of rather SOM composition than SOC content. In contrast silt and clay associ- ated SOM quantity did not change signifi- cantly. SOM composition proxies provided inconsistent results using the NaOH extrac- tion method. Therefore, the application of organo-mineral SOM protection theory in as- sociation with the photometric proxies seems to be difficult in the present case.
On the other hand, photon correlation spec- troscopy provided results in line with the pub- lished results of the organo-mineral stabiliza- tion theory that suggested alkali extraction with special care could be a useful alternative for such soils. However, due to the known imperfections of it, the application of in situ measurement methods would be preferable.
REFERENCES
Barthès, B.G., Kouakoua, E., Larré-Larrouy, M.C., Razafimbelo, T.M., de Luca, E.F., Azontonde, A., Neves, C.S.V.J., de Freitas, P.L. and Feller, C.L.
2008. Texture and sesquioxide effects on water- stable aggregates and organic matter in some tropi- cal soils. Geoderma 143. (1–2): 14–25.
Bilandžija, D., Zgorelec, Ž. and Kisić, I. 2017.
Influence of tillage systems on short-term soil CO2 emissions. Hungarian Geographical Bulletin 66. (1):
29–35.
Bronick, C.J. and Lal, R. 2005. Soil structure and management: a review. Geoderma 124. (1–2): 3–22.
Burd, A.B., Frey, S., Cabre, A., Ito, T., Levine, N.M., Lønborg, C., Long, M., Mauritz, M., Thomas, R.Q., Stephens, B.M., Vanwalleghem, T. and Zeng, N. 2015. Terrestrial and marine perspectives on modelling organic matter degradation pathways.
Global Change Biology 22. (1): 121–136. DOI:10.1111/
gcb.12987
Buurman, P., van Lagen, B. and Velthorst, E.J. (eds.) 1996. Manual for soil and water analysis. Leiden, The Netherlands, Backhuys Publishers.
Centeri, Cs., Jakab, G., Szabó, Sz., Farsang, A., Barta, K., Szalai, Z. and Bíró, Zs. 2015. Comparison of particle-size analysing laboratory methods.
Environmental Engineering and Management Journal 14. (5): 1125–1135.
Chatigny, M.H. 2003. Dissolved and water-extractable organic matter in soils: A review on the influence of land use and management practices. Geoderma 113. (3–4): 357–380.
Chaudhuri, S., Mcdonald, L.M., Skousen, J. and Pena-Yewtukhiw, E.M. 2013. Soil organic car- bon molecular properties: effects of time since reclamation in a minesoil chronosequence. Land Degradation & Development 26.(3): 237–248. DOI:
10.1002/ldr.2202
Coleman, K. and Jenkinson, D.S. 1996. RothC-26.3 – A Model for the turnover of carbon in soil. In Evaluation of Soil Organic Matter Models. Eds.:
Powlson, D.S., Smith, P. and Smith, J.U., NATO ASI Series I: Global Environmental Change 38.
Berlin–Heidelberg, Springer, 237–246.
Cools, N., Vesterdal, L., De Vos, B., Vanguelova, E.
and Hansen, K. 2014. Tree species is the major fac- tor explaining C:N ratios in European forest soils.
Forest Ecology and Management 311. 3–16.
Crow, S. E., Swanston, C. W., Lajtha, K., Brooks, J.R. and Keirstead, H. 2007. Density fractionation of forest soils: methodological questions and inter- pretation of incubation results and turnover time in an ecosystem context. Biogeochemistry 85. 69–90.
Dencső, M., Tóth, E., Gelybó, Gy., Kása, I., Horel, Á., Rékási, M., Takács, T., Farkas, Cs., Potyó, I. and Uzinger, N. 2017. Changes in the moisture content and respiration of a calcareous sandy soil after combined treatment with biochar and compost or mineral fertiliser. Agrokémia és Talajtan 66. (1): 79–93.
(In Hungarian with English abstract.)
Dövényi, Z. (ed.) 2010. Inventory of microregions in Hungary. Budapest, MTA FKI. (In Hungarian.) Esfahani, M.R., Stretz, H.A. and Wells, J.M.M.
2015. Abiotic reversible self-assembly of fulvic and humic acid aggregates in low electrolytic conductivity solutions by dynamic light scattering and zeta potential investigation. Science of the Total Environment 537. 81–92.
Falkengren-Grerup, U., Brink, D.J. and Brunet, J.
2006. Land use effects on soil N, P, C and pH persist over 40–80 years of forest growth on agricultural soils. Forest Ecology and Management 225. 74–81.
Filep, T., Draskovits, E., Szabó, J., Koós, S., László, P.
and Szalai, Z. 2015. The dissolved organic matter as a potential soil quality indicator in arable soils of Hungary. Environmental Monitoring and Assessment 187. 1–12.
Fortuna, A., Harwood, R.R. and Paul, E.A. 2003. The effects of compost and crop rotations on carbon turnover and the particulate organic matter frac- tion. Soil Science 168. (6). 434–444.
Galantini, J.A., Senesi, N., Brunetti, G. and Rosell, R. 2004. Influence of texture on organic matter distribution and quality and nitrogen and sulphur status in semiarid Pampean grassland soils of Argentina. Geoderma 123. (1–2): 143–152.
Goebel, M., Bachmann, J., Woche, S.K. and Fischer, W.R. 2005. Soil wettability, aggregate stability, and the decomposition of soil organic matter. Geoderma 128. (1–2): 80–93.
Guo, M. and Chorover, J. 2003. Transport and frac- tionation of DOM in soil columns. Soil Science 168.
108–118.
Hassink, J. 1997. The capacity of soils to preserve organic C and N by their association with clay and silt particles. Plant and Soil 191. 77–87.
Her, N.G., Amy, G., Sohn, J. and Gunten, U. 2008.
UV absorbance ratio index with size exclusion chromatography (URI-SEC) as an NOM property indicator. Aqua 57. (1): 35–46.
IUSS Working Group WRB 2015. World Reference Base for Soil Resources 2014, update 2015. International soil classification system for naming soils and creating legends for soil maps. World Soil Resources Reports No. 106. Rome, FAO.
Jakab, G., Szabó, J., Szalai, Z., Mészáros, E., Madarász, B., Centeri, Cs., Szabó, B., Németh, T. and Sipos, P. 2016. Changes in organic carbon concentration and organic matter compound of erosion-delivered soil aggregates. Environmental Earth Sciences 75. 144–155.
Jancsovszka, P. 2016. Sustainable development goals (SDGs). Tájökológiai Lapok 14. (2): 71–181. (In Hungarian with English abstract.)
John, B., Yamashita, T., Ludwig, B. and Flessa, H.
2005. Storage of organic carbon in aggregate and density fractions of silty soils under different types of land use. Geoderma 128. (1–2): 63–79.
Kása, I., Molnár, S. and Horel, Á. 2016. Net changes in nitrification in cultivated soil as a function of temperature and the type and concentration of biochar. Agrokémia és Talajtan 65. (2): 297–311. (In Hungarian with English abstract.)
Kononova, M.M. 1966. Soil Organic Matter. Its Nature, its Role in Soil Formation and in Soil Fertility. Oxford, Pergamon Press.
Lehmann, J. and Kleber, M. 2015. The contentious nature of soil organic matter. Nature 528. 60–68.
Lehmann, J., Solomon, D., Kinyangi, J., Dathe L., Wirick, S. and Jacobsen, C. 2008. Spatial complexity of soil organic matter forms at nanometre scales.
Nature Geoscience 1. 238–242.
Lützow, M., Kögel-Knabner, I., Ekschmitt, K., Matzner, E., Guggenberger, G., Marschner, B.
and Flessa, H. 2006. Stabilization of organic matter
in temperate soils: mechanisms and their relevance under different soil conditions – a review. European Journal of Soil Science 57. (4): 426–445. DOI:10.1111/
j.1365-2389.2006.00809.x
Manzoni, S. and Porporato, A. 2009. Soil carbon and nitrogen mineralization: Theory and models across scales. Soil Biology and Biochemistry 41. (7): 1355–1379.
Meng-Yun, L., Qing-Rui, C., Yan-Bing, Q., Jing, L. and Tao, C. 2014. Aggregation and soil organic carbon fractions under different land uses on the tableland of the Loess Plateau of China. Catena 115. 19–28.
Mika, J. and Farkas, A. 2017. Sensitivity of inland water bodies, natural vegetation and agriculture to weather extremes and to climate change.
Tájökológiai Lapok 15. (2): 85–90. (In Hungarian with English abstract.)
Mueller, C.W., Hoeschen, C., Steffens, M., Buddenbaum, H., Hinkel, K., Bockheim, J.G. and Kao-Kniffin, J.
2017. Microscale soil structures foster organic mat- ter stabilization in permafrost soils. Geoderma 293.
(l–2): 44–53.
Nadi, M., Sedaghati, E. and Fuleky, Gy. 2012.
Evaluation of humus quality of forest soils with two extraction methods. International Journal of Forest, Soil and Erosion 2. (3): 124–127.
Németh, T. and Sipos, P. 2006. Characterization of Clay Minerals in Brown Forest Soil Profiles (Luvisols) of the Cserhát Mountains (North Hungary). Agrokémia és Talajtan 55. 39–48. (In Hungarian with English abstract.)
Nierop, KGJ, van Lagen, B. and Buurman, P. 2001.
Composition of plant tissues and soil organic mat- ter in the first stages of a vegetation succession.
Geoderma 100. (1–2): 1–24.
Palmer, N.E. and Wandruszka von, R. 2001. Dynamic light scattering measurements of particle size de- velopment in aqueous humic materials. Fresenius’
Journal of Analytical Chemistry 371. 951–954.
Plaza-Bonilla, D., Alvaro-Fuentes, J. and Cantero- Martínez, C. 2014. Identifying soil organic carbon fractions sensitive to agricultural management practices. Soil & Tillage Research 139. 19–22.
Poeplau, C., Dona, A., Dondini, M., Leifeld, J., Nemod, R., Schumacher, J., Senapati, N. and Wiesmeier, M. 2013. Reproducibility of a soil or- ganic carbon fractionation method to derive RothC carbon pools. European Journal of Soil Science 64.
735–746. DOI: 10.1111/ejss.12088
Rabbi, F.S.M., Wilson, B.R., Lockwood, P.V., Daniel, H. and Young, I.M. 2014. Soil organic carbon min- eralization rates in aggregates under contrasting land uses. Geoderma 216. (1–2): 10–18.
Reddy, S., Nagaraja, M.S., Punith Raj, T.S., Police Patil, A.S. and Dhumgond, P. 2014. Elemental Analysis, E4/E6 Ratio and Total Acidity of Soil Humic and Fulvic Acids From Different Land Use Systems. Annals of Plant and Soil Research 16.
(2): 89–92.
Rice, J.A. 2001. Humin. Soil Science 166. 848–857.
Rieder, Á., Madarász, B., Szabó, J.A., Zacháry, D., Vancsik, A., Ringer, M., Szalai, Z., and Jakab, G. 2018. Soil Organic Matter Alteration Velocity due to Land-Use Change: A Case Study under Conservation Agriculture. Sustainability 10. 943.
1–11.
Rowel, D.L. 1994. Soil science: methods and applications.
London, Prentice Hall. 350 p.
Schmidt, M.W.I., Torn, M.S., Abiven, S., Dittmar, T., Guggenberger, G., Janssens, I.A., Kleber, M., Kögel-Knabner, I., Lehmann, J., Manning, D.A.C., Nannipieri, P., Rasse, D.P., Weiner, S. and Trumbore, S.E. 2011. Persistence of soil organic matter as an ecosystem property. Nature 478. 49–56.
DOI:10.1038/nature10386
Sipos, P. 2004. Geologic and pedogenic effects on heavy metal distributions in forest soils from the Cserhát Mountains and the Karancs area, NE Hungary. Acta Geologica Hungarica 47.(4): 411–429.
Six, J., Conant, R.T., Paul, E.A. and Paustian, K. 2002.
Stabilization mechanisms of soil organic matter:
implications for C-saturation of soils. Plant and Soil 241. 155–176.
Spaccini, R. and Piccolo, A. 2013. Effects of field managements for soil organic matter stabilization on water-stable aggregate distribution and aggre- gate stability in three agricultural soils. Journal of Geochemical Exploration 129. 45–51.
Stevenson, F.J. 1982. Humus Chemistry. Genesis, Compositions, Reactions. 2nd edition. New York, Wiley and Sons Inc.
Szalai, Z., Szabó, J., Kovács, J., Mészáros, E., Albert, G., Centeri, Cs., Szabó, B., Madarász, B., Zacháry, D. and Jakab, G. 2016. Redistribution of Soil Organic Carbon Triggered by Erosion at Field Scale Under Subhumid Climate, Hungary. Pedosphere 26.
(5): 652–665.
Tan, K.H. 2003. Humic Matter in Soil and the Environment Principles and Controversies. New York, Marcel Dekker Inc. USA
Wang, K. and Xing, B. 2005. Structural and sorption characteristics of adsorbed humic acid on clay min- erals. Journal of Environmental Quality 34. 342–349.
DOI:10.2134/jeq2005.0342
Wiesmeier, M., Hübner, R., Spörlein, P., Geu, U., Hangen, E., Reischl, A., Schilling, B., von Lützow, M. and Kögel-Knabner, I. 2014. Carbon sequestra- tion potential of soil in southeast Germany derived from stable soil organic carbon saturation. Global Change Biology 20. 653–665.
Zimmermann, M., Leifeld, J., Schmidt, M.W.I., Smith, P. and Fuhrer, J. 2007. Measured soil organic mat- ter fractions can be related to pools in the RothC model. European Journal of Soil Science 58. 658–667.