Soil Management and Climate Change 293 © 2018 Elsevier Inc. All rights reserved.
https://doi.org/10.1016/B978-0-12-812128-3.00019-7
C H A P T E R
19
Soil CO 2 Emissions in a Long-Term Tillage Treatment Experiment
Eszter Tóth*, Györgyi Gelybó*, Márton Dencs ő *, Ilona Kása*, Márta Birkás
†, Ágota Horel*
*Centre for Agricultural Research, Hungarian Academy of Sciences, Budapest, Hungary
†Szent István University, Gödöllő, Hungary
INTRODUCTION
Although vegetation takes up a significant amount of CO2 each year, turning the terrestrial ecosystem into a net sink of carbon (IPCC, Le Quéré et al., 2013; Janssens et al., 2003), a land use change to agriculture (Le Quéré et al., 2009) and arable lands in general are often consid- ered to be carbon sources (Janssens et al., 2009) or small sinks (Ciais et al., 2010). These land use changes are also one of the human-induced sources of greenhouse gas (GHG) emission (Ciais et al., 2010; Tian et al., 2016). A large portion of the agricultural fluxes is related to soils, as GHGs are emitted via several processes occurring under both aerobe and anaerobe conditions, such as respiration, decomposition, nitrification, and denitrification processes.
Mitigating agricultural GHG emissions is not only important to potentially influence future GHG concentrations in the atmosphere, but can also help maintain soil quality and fertility, consequently optimizing production. In Hungary, typical cropping systems do not involve the production of crops associated with high methane emissions; therefore, our main focus in this chapter is CO2 emissions and soil carbon stocks.
One of the mitigation possibilities in agriculture is to apply adequate soil management/
cultivation methods. Tillage is a series of mostly reasonable (but sometimes quite unreason- able) soil disturbances. Soil tillage is devoted to preserving or improving the soil’s biotic and abiotic environment as well as to support issues of soil protection and cropping. The appli- cation of tillage influences soil structure and soil aeration, also affecting carbon and water cycling of soils. The effects of different tillage methods on soils can be very diverse (Zhang et al., 2013; Zhu et al., 2014). Carbon loss can occur in the case of applying an inadequate tillage method, causing soil degradation and increased CO2 emissions. Therefore soil carbon stocks and CO2 emissions are important research topics in recent studies. CO2 mitigation
through anthropogenic intervention, such as choosing appropriate management, is a serious challenge nowadays (Alvaro-Fuentes and Cantero-Martinez, 2010).
Soil interventions come in a great variety of modes and depths; accordingly, there are great differences between CO2 efflux levels as well. The data drawn from different tillage- related research and studies make it possible to set up a ranking order, aiding the decision-making process concerning the best tillage technique for a given site and envi- ronmental condition, which is expected to help gain a wide acceptance of carbon preserv- ing tillage as well. There is rather extensive literature on the CO2 emissions of differently tilled agricultural soils, but the methodology of these studies is not highly consistent.
Field and/or laboratory measurements investigating CO2 efflux from soil under different management were carried out: (i) scheduled to tillage application or during vegetation period (La Scala et al., 2006, 2008; Dyer et al., 2012; Drewer et al., 2016); (ii) in long-term experiments (Shahidi et al., 2014; Kumar et al., 2014) or newly established ones (O'Dell et al., 2015); (iii) using different sampling and measurement techniques (comparing two closed dynamic system (Dantec et al., 1999); using Eddy Covariance, chamber, and gradi- ent methods (Myklebust et al., 2008); using low cost nondispersive infrared CO2 sensors (Harmon et al., 2015)); (iv) including or excluding roots; that is, measuring heterotrophic and/or autotrophic parts (Zhang et al., 2013; Carbone et al., 2016).
The objective of this study was to investigate and separate the short- and long-term effects of soil tillage on soil CO2 emissions. The study site was selected so that the differ- ences in soil CO2 emissions induced by long-term systematic tillage practice could be also detected.
METHODS Site Description
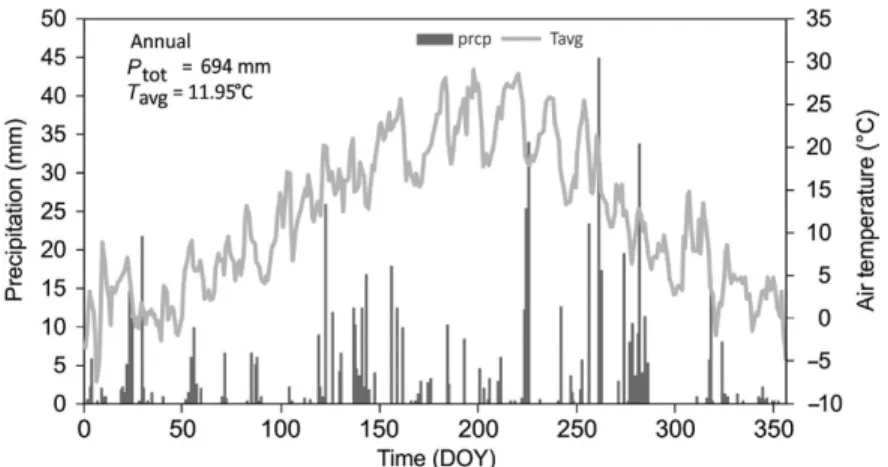
This study was carried out at the Józsefmajor Experimental and Training Farm (JETF) in 2015. The site is located in Northern Hungary nearby the city Hatvan (47° 41′31.7″N, 19°36′36.1″E; 110 m a.s.l.). The annual average precipitation (for the 1961–90 period, based on a gridded climate dataset of the Climatic Research Unit) is 560 mm, where approximately 395 mm of that falls during the vegetation period (March-October); the mean annual tempera- ture is 10.3°C, and 15°C during the vegetation period (New et al., 2002). The year 2015 was relatively humid, with a total of 694 mm precipitation (Fig. 1).
The soil type is classified as Endocalcic Chernozems (Loamic) (IUSS Working Group WRB, 2015) with a clay loam texture, which is common in this part of the country. Soil character- istics at the JETF site for the selected treatments are presented in Table 1. A long-term tillage and climate experiment was initiated at JETF in 2002, where the following six different soil tillage treatments were yearly applied: moldboard plowing + leveling (P; 26–30 cm distur- bance depth), deep cultivator (16–20 cm disturbance depth), shallow cultivator (12–16 cm disturbance depth), disking (16–20 cm disturbance depth), disking combined with deep loos- ening (16–20 cm disturbance depth in case of disking, 40–45 cm disturbance depth in case of loosening), and no tillage (NT; 0 cm disturbance depth). A crop rotation was applied at the
METHOdS 295
site, including mostly various cereal crops like maize (Zea mays L.), rye (Secale cereale L.), wheat (Triticum aestivum L.), barley (Hordeum vugare L.), oat (Avena sativa L.), and some non- cereal plants such as mustard (Sinapis alba L.) or sunflower (Helianthus annuus L.). In 2015, winter wheat was grown; prior to that sunflower was the cultivated crop. Plant residue was not removed from the site after harvest, about 80% of aboveground biomass was left at the site and incorporated in the soil in all experimental plots. The experiment was set up on a 312 m × 150 m field, where treatments were applied in four replicated stripes (13 m × 150 m each) in a randomized split plot design (Fig. 2). In the experimental study site, primary fall tillage and surface forming is usually carried out in a single tillage pass. However, in the case of wheat (as it was in the fall of 2014), seedbed preparation is normally carried out in combination with sowing shortly after primary tillage. Surface forming is advised to avoid uneven soil water content patterns leading to heterogeneity in crop emergence and also to TABLE 1 Main Soil Properties at JETF Tillage Treatment Experiment at −10 cm Soil depth
Soil Properties Plowing No Tillage
pH (KCl) 5.49 4.61
pH (H2O) 6.17 5.31
Organic carbon (%) 1.84 2.38
Total nitrogen (%) 0.19 0.24
Bulk density 0–5 cm (g cm−3) 1.20 1.38
Sand fraction (2–0.05 mm) (%) 10.20 10.27
Silt fraction (0.05–0.002 mm) (%) 53.41 55.69
Clay fraction (<0.002 mm) (%) 36.38 34.04
FIG. 1 Air temperature and precipitation at the study site in 2015 (Ptot = annual total precipitation, Tavg = annual average temperature, DOY = day of year).
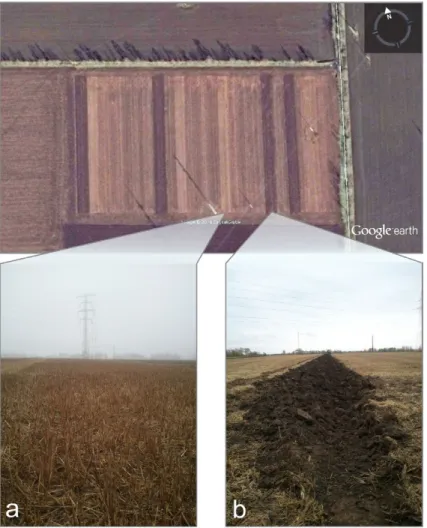
prevent excessive soil water content loss (Birkás et al., 2014). For the present study, P and NT treatments were only selected in order to represent the most and the least soil disturbance methods, respectively. Fig. 2 shows the view of the investigated treatments at JETF.
Several soil properties were measured to examine the basic condition of the site. CO2 emis- sion mainly depends on biotic and abiotic circumstances in the upper layers, thus Table 1 show the data collected only from the upper 10 cm depth of the soil.
All plots were rainfed so that the differences in their performance in various years can be monitored. Apart from the tillage type, the applied management was identical in the exper- imental plots in any other aspects (same plants sown, no irrigation, uniform fertilization, pesticide/herbicide application). Agricultural management events performed related to win- ter wheat grown in 2015 are listed in Table 2.
FIG. 2 View of (A) no-tillage (NT) treatment, (B) plowing (P) treatment during the process of plowing at JETF site and their locations on Google Earth v7.1.2.2041 (10/7/2013 data provider DigitalGlobe 2016); imagery taken on 01/16/2016 of Józsefmajor, Hungary, eye altitude 138 m.
METHOdS 297
Measurements
Soil CO2 Emissions
CO2 emission measurements on the winter wheat field were taken weekly, starting from March 11, 2015, as agricultural management events and weather permitted; therefore measure- ment timing in some cases shifted. Measurements were carried out with the static chamber technique using 20 cm × 30 cm × 20 cm sized squared chambers, where roots were not excluded.
Seven spatial replicates were applied per plot, and measurements were taken parallel in P and NT treatments. Air samples were taken weekly from the chamber headspace at t = 0 min and t = 20 min, weekly during the vegetation period with less frequent (i.e., biweekly) measurements during the dormant season. Extensive campaign measurements were scheduled right after the plowing event. During this campaign a pretreatment control measurement was made just be- fore the plowing event. Sampling was performed hourly in the first 7 h, then at 12, 18, and 24 h and 2, 3, 4, 5, and 6 days after the plowing. In all cases, gas samples were withdrawn in 10 mL vacuumed-glass vials using gas-tight 10 mL syringes (Hamilton Company, Reno, NV, USA). Air samples were subsequently analyzed in the laboratory using FISONS 8000 series gas chromato- graph (FISONS Instruments, UK) operating with a flame ionization detector (FID) equipped with a methanizer to determine CO2 concentrations. GC-FID instrument column parameters were 2 m by 3 mm (Porapak Q 80–100 mesh). The method used a splitless injection with hy- drogen carrier gas (pressure: 90 kPa; flow: 30 mL min−1) with injection volume of 250 μL. The detector temperature was 150°C, while the oven temperature was kept constant at 80°C for the duration of 180 s. The methanizer device temperature was set at 350°C. Calibration standards of 1000 mg kg−1 CO2 were run after each sample runs, containing approximately 30 samples.
Soil Temperature and Soil Water Content
To examine the environmental conditions of the site, soil water content (SWC) and soil temperature (Ts) sensors (5TM Decagon Devices Inc., Pullman, WA, USA) were installed at 5 different depths in the sampling area. SWC and Ts sensors were calibrated to the specific soil used in the field prior to installation. Meteorological data were collected nearby JETF in the TABLE 2 Management Events at JETF Tillage and Climate Experiment
Management Date (mm/dd/yyyy) Description
Fertilizer 09/29/2014 NPK 8:24:24
Tillage 10/02/2014 Application of the appropriate tillage types in the
experimental plots
Sowing 10/08/2014 Triticum aestivum L. variety: Antonius
Fertilizer 10/07/2014
04/16/2015; 05/29/2015 Basic: N:P:K 8:24:24 (200 kg ha−1)
Top dressing: 35 and 15 kg ha−1 active ingredient Pesticide/herbicide 04/16/2015; 04/30/2015; 05/29/2015 Fungicide; chemical weed control; fungicides
against head diseases
Harvest 07/08/2015 With straw chopping
Tillage 10/28/2015 Application of the appropriate tillage types in the
experimental plots
city of Heréd at a private weather station (published on http://wunderground.com). SWC and Ts data were quality controlled, filtered, and processed similar to a study done by Dorigo et al. (2012). In the case of capacitance-based SWC sensors, the effect of Ts on SWC measure- ments is a known issue (e.g., Chanzy et al., 2012), and the most common method to correct for temperature dependency is temporal averaging. The accuracy of SWC measurements and sensor calibration equations vary among soil types (Kinzli et al., 2012; Seyfried et al., 2005);
generally measurements are more accurate on sandy than on clayey soils. At JETF the soil has a clay loam texture; therefore soil-specific calibration of the SWC and Ts sensors have been carried out for the upper and lower soil layers separately for both treatments. The postpro- cessing of SWC data included filtering erroneous data affected by disturbance (removal/
reinstallation due to agricultural management), filtering peaks, plateaus, and sudden drops.
The measured time-series of SWC were corrected using the obtained site-specific calibration equations; temperature dependency was eliminated by obtaining daily average SWC data.
Plant and Soil Samplings
Root and stem dry weight and crop yield were determined upon harvest. Roots were ex- tracted from the top to approximately 30 cm depth in three replicates. Roots were carefully washed and air-dried prior to weight measurements.
For describing plant development stages, Zadoks' growth scale was used (Zadoks et al., 1974). This method is widely acknowledged in the international scientific literature and clas- sifies plant development on a 0–99 scale that defines plant development stages.
Winter wheat was sown in the fall of 2014, thus soil samples were taken in 2014 prior to sowing to examine the initial conditions. Bulk density, soil organic carbon (SOC) content, and water retention values were determined in both treatments. Undisturbed soil cores were taken in three replicates from four depths (i.e., 0–5 cm, 10–15 cm, 25–30 cm, and 40–45 cm) to deter- mine soil water retentions and bulk density. Soil chemical properties were determined from disturbed soil samples. Water retention was measured using standard MSZ-08-0205:1978. In the determination of soil organic carbon content, we followed MSZ-08-0210:1977 standard.
Values of pH were determined using the MSZ-08-0206-2:1978 standard and WTW Multi 350i and MultiLine P4 meters (WTW, Weilheim, Germany).
Statistical Analyses
A one-way ANOVA was used to analyze the difference between treatments and factorial ANOVA to further investigate interactions between Ts and SWC on CO2 production, using Statistica 13.1 software. The CO2 flux values were not normally distributed; therefore the data were log-transformed prior to analyses. Statistical significance of the data sets was deter- mined at P < 0.05 and P < 0.01. Relationship among parameters were further analyzed using Pearson correlations.
RESULTS AND DISCUSSION Overall Plant Growth and Crop Yield
After sowing winter wheat, emergence (Growth Stage (GS) 10–19 by Zadoks' growth scale (Zadoks et al., 1974)) occurred during the second part of October with different timing among
RESuLTS ANd dISCuSSION 299 the treatments, while the tillering stage (GS 20–29) lasted until next spring. No differences in plant development were observed until late April when jointing (GS 30–39) started. At that time, the average plant height was 55 cm in P and 48 cm in NT treatments. Wheat was at the heading (GS 50–59) and flowering stage (GS 60–69) between May 20–30, day of year (DOY) 140–160. Maturity was reached around June 10–July 5, when a final plant height of 125 and 100 cm was measured in the P and NT treatments, respectively. Crop yield was 4.82 and 5.70 t ha−1 in the NT and P treatments, respectively, when considering all four replicates.
These mean values were statistically significant (P < 0.01). A yield of 2015 can be characterized by relatively weak root biomass with strong stems. The shoot-to-stem ratio is dependent on available nutrients in the soil, climate, etc. (Russell, 1978). Stem dry weights were signifi- cantly different (P < 0.01) in the two treatments with values of 5.55 t ha−1 in P and 4.62 t ha−1 in NT treatments; while root dry weights were 1.15 t ha−1 and 1.10 t ha−1 (not significant, P > 0.05) in P and NT, respectively. Buyanovsky et al. (1986) found an approximately 1:1 root-to-stem ratio in winter wheat under no water limitation. Root and stem biomass were determined after harvest, which could slightly influence the results, as maximal root density is reached at flowering and decreases towards ripening (Guan et al., 2015). Other studies have found that root weight density (RWD) tends to be higher in no-tillage treatments in the upper soil layer (Buyanovsky et al., 1986). However, a temporal variation can appear, with RWD in plowing exceeding that in NT in the early growth stages (Guan et al., 2015).
Effect of Systematic Tillage Practice on Soil CO
2Emission and Hydrothermal Regime During Vegetation Season
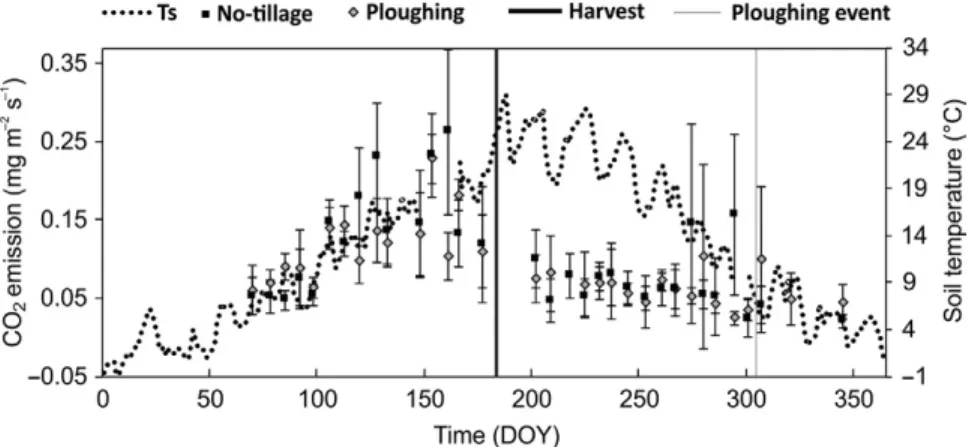
Soil CO2 emissions observed at the individual chamber measurements varied between approximately 0 and 0.35 mg CO2 m−2 s−1. The annual pattern of soil CO2 efflux was similar in both treatments, showing a summer peak and lower values at the beginning and end of the vegetation period and during the dormant season (Fig. 3). As the plant roots were not
FIG. 3 Soil CO2 emissions in the plowing (P) and no-tillage (NT) treatments. Daily average soil temperature in the upper (5–10 cm) soil layer of the NT treatment is also shown. Ts: soil temperature. Note that regarding its temporal variation, soil temperatures did not differ substantially among treatments.
excluded in the measurements (i.e., autotrophic and heterotrophic respiration are both pres- ent in the detected flux), we expected to see a determining signature of root respiration.
Out of 30 measurements in the vegetation season, 16 showed higher emissions in NT than P. However, due to the large uncertainty in the data, substantial differences were only detected in certain cases (e.g., DOY 85, 120, 161, 166). While there is a significant temporal variation in CO2 emissions over the investigated period (P < 0.01), the CO2 flux showed no significant differences among treatment types (P = 0.51) as reflected by regular measurements in the vegetation season. Regarding the timing of differences, emission values in NT tended to be higher compared to P treatment at peak growing season; between DOY 106–177, 80% of the NT measurements were higher than those in P.
Ts is known to be one of the main abiotic drivers of soil CO2 emission, especially at the upper 0–20 cm layer, where the aerobe conditions are more pronounced. Average Ts was only slightly different between the two treatments in 2015; the average of measured data at 5–10 cm depth during the entire year was 12.44°C and 12.05°C in P and NT, respectively, with a pronounced annual course. In the present study, as we expected, there is a positive correla- tion between Ts at 5–10 cm depth and soil CO2 emissions (R = 0.234; P < 0.01). The overall Ts at the time of CO2 efflux measurements (0–15 cm depth) showed less than 2°C of difference between treatments (15.55 and 13.65°C for P and NT, respectively; P = 0.380). However, when separating warmer (summer) and colder (late autumn and early spring) periods, we found that during the summer, Ts was higher in P compared to NT at almost all measuring points.
During the colder periods the upper soil layer Ts were very similar (data not shown). The slightly elevated Ts in P treatment would enhance microbial activities in the soil; however, these temperature differences in the long-term data showed no effect on CO2 emission that were most often NT higher compared to P treatment. This result confirms that the nonsignif- icant difference between the treatments' upper Ts values is not a major influencing factor for soil CO2 emission in the present study. Also, soil CO2 emissions peaked before reaching the highest Ts range in its annual course in both treatments. This can reflect the significant contri- bution of root respiration before ripening and harvest (in beginning of July; DOY 189), which suddenly decreased after harvest. Plant development varied among treatments as well, which can partly explain the observed differences between soil CO2 emission in P and NT.
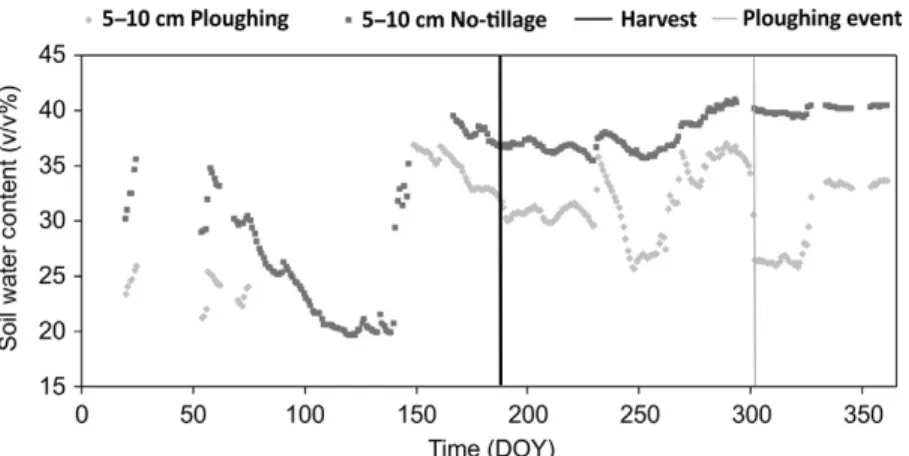
Another explanation for the timing of peak soil CO2 emission can be the higher SWC during the period (Fig. 4). In Fig. 4, the daily average SWC in the upper soil layer (5–10 cm) is plotted throughout the year. Due to recurrent technical failures, there is a data gap in the P treatment dataset, which influences the interpretation of the results. However, it can still be observed that SWC was higher in the upper soil layers starting in the summer. This finding is similar to observations in other studies. Copec et al. (2015) found that soil tillage systems had a significant effect on SWC when examining five types of tillage systems; among others they investigated conventional tillage and no-tillage systems. In each season, NT was found to have the highest SWC. Guan et al. (2015) observed higher SWC in NT compared to plowing at the jointing stage, whereas at the flowering stage, the SWC under NT, in most cases, was significantly higher than those under plowing.
According to the results of daily average SWC in different depths during the whole year, the mean SWC was higher in the upper four layers, while the average SWC in P exceeded that in NT in the 65–70 cm layer (Fig. 5). When focusing at differences at CO2 sampling dates, in the uppermost layer (5–10 cm), the average soil water content was significantly higher
RESuLTS ANd dISCuSSION 301
(P < 0.01) in NT than in P on days of CO2 samplings (not shown). Although measurement gaps can bias these results, in general, our finding is similar to results presented in the litera- ture (Guan et al., 2015; Copec et al., 2015).
The optimum SWC range for crops is between the wilting point and field capacity, de- fined as SWC at pF4.2 and 2.3, respectively. In the soil dominating the site, the optimal SWC was between 16% and 35% in the 0–15 cm soil layer as reflected by water retention capacity determined from undisturbed soil cores taken from the soil layer (defined as SWC between wilting point and field capacity). Water availability was not very limiting in 2015 as the FIG. 4 Volumetric soil water content in the 5–10 cm layer in plowing (P) and no-tillage (NT) treatments during 2015.
FIG. 5 Variation of soil water content with depth and treatments.
number of no-dry days (i.e., the number of days with average daily SWC under wilting point) were identified throughout the year including the vegetation period. We have to keep in mind, though, that data gaps occurring due to instrumental failure may bias this finding, especially in P treatment. However, considering the higher-than-average precipitation total in 2015, it strengthened our confidence in the obtained result. Overall, SWC showed no sig- nificant effect on soil CO2 emission values (P = 0.22). However, when investigating different SWC values (dry with 15%–25%, medium with 25%–35%, and wet with 35%–45% VWC soil conditions) on soil CO2 emission without considering the treatment types, we found that SWC indeed can significantly influence CO2 emissions. These findings indicate that there are favorable environmental conditions for microbial growth.
Differences in SWC can be related to differences in soil physicochemical properties (e.g., water retention, permeability, porosity, aggregation, etc.), soil cover (mulching effect in no- till) and vegetation (via canopy interception, root spatio-temporal distribution, or evapo- transpiration). SWC and soil CO2 emissions can also be dependent on the organic carbon content of the soil (Rawls et al., 2003) because it influences soil structure and porosity. SOC content in 2014, after 12 years of the experiment, was higher in NT than in P in the top 10 cm of the soil (Table 1). This phenomenon is also reported in the literature and can be caused by the accumulation of plant residue in the top layer in contrast to plowing, where plant residue is mixed in the soil. Corbeels et al. (2016) observed a strong stratification of SOC content at a lower scale in soils under no-till management. They found that SOC was significantly higher in the top 0–5 cm depth compared to the 5–10 cm located below. They explain this observa- tion as the accumulation of crop residue focused on the upper layer of the soil profile. As NT treatment had an overall 29.34% higher SOC content than P treatment (Table 1), the highest CO2 emissions in NT in most part of the peak vegetation season could be also attributed to the elevated available carbon source for aerobe microorganisms. As observed at the site, plant residue from the previous year (sunflower) was mostly decomposed in P treatment by the spring of 2015 due to a mild fall in 2014 and incorporation of plant residues into the upper 26 cm soil with plowing. However, in the NT treatment, recognizable sunflower parts were still observed in the upper soil layer and surface. Because of the higher SWC environment in NT in 2015, the available plant residues could decompose gradually during the whole veg- etation period, maintaining an elevated CO2 emission rate compared to P. Aeration can also cause the decomposition of SOC. After plowing, which has a serious soil disturbing effect, the environment can become more oxic and it facilitates microbes to use and decompose the available carbon source for maintaining their vital conditions (Necpálová et al., 2013).
Short-Term Effect of Tillage Event on Soil CO
2Emissions and Hydrothermal Regime
Following the plowing event, an increase in microbial activity can be expected, as better aeration is occurring during the process. The disturbance of soil also supports the sudden release of CO2 produced below the surface (Prior et al., 2000). According to our measure- ments after plowing, the CO2 emissions trend observed in the vegetation period changed, as plowing resulted in higher CO2 emissions in most cases (Fig. 6). Better aeration of the soil by plowing can cause enhanced microbial activities, such as dormant aerobe or facultative microorganisms in the soil that can use oxygen to oxidize substrates and grow. Plowing is a
RESuLTS ANd dISCuSSION 303
soil-inverting primary tillage technique, as the moldboard turns the furrow slice over side- ways and onto the previously cut furrow slice. If the surface layer is in furrows and contains holes, soil CO2 emission, and consequently the decomposition of SOC, is increased due to the microbial activity (Szabó, 2008). Such circumstances can be avoided by surface forming simultaneously with plowing. In the present experiment a reversible plow linked a surface consolidation element.
The plowing event resulted in significant differences in soil CO2 emissions between treat- ments during the 150 h the measurements were taken (P < 0.01).
Our findings support that the treatment type has a major influence on soil CO2 emissions for at least a week after the soil disturbance; however, this effect diminishes over a longer time period, as the previous tillage in 2014 was not reflected through the 2015 vegetation period.
However, the effects of the SWC variations within a treatment are not detectable, given that no considerable change in SWC occurred during the short time frame of the measure- ment campaign. However, when comparing management types on SWC, the differences were more pronounced. Tillage application caused a substantial difference between P and NT SWC at the upper soil layers (26.30 ± 0.23% and 39.99 ± 0.15%, respectively). The drying of the soil in the P treatment from the ~33.5% VWC before plowing was likely caused by the incorporation of plant residues into the soil, leading a bare soil surface with enhanced evaporation and the loosening of soil structure. These SWC changes alone can represent the major differences in the present data, which were directly related to soil tillage types. Temperature, on the other hand, showed relatively smaller differences be- tween treatments, as P had 9.38°C (±1.27°C) while NT had 7.86°C (±1.87°C) in the upper soil layer over the week of the study. Based on these temperature differences, we would also expect slight increases in CO2 emissions in P compared to NT. The difference in Ts can be attributed to clear sky conditions combined with a decreased albedo of the P field following the plowing event compared to NT, where the soil surface was still covered with plant residue.
In the present study, during the first four days following soil tillage we found that soil CO2 emissions in the P treatment were 52.6% higher compared to NT treatment, and 72.8%
higher than the value measured just before tillage. This value is relatively low compared FIG. 6 Soil CO2 emissions after plowing event in plowing and no-till treatments.
to the findings of other researchers; for example, Prior et al. (2000) observed emission rates that were seven times higher after tillage, with a 45 cm disturbed soil depth compared to NT emissions. This can be explained by the less aggressive (26 cm disturbance depth) soil disturbance combined with surface forming in the current study. Studies in the literature often exclusively measure CO2 emission rates right after tillage treatment, when the av- erage emission rates are overridden by sudden disturbance of soil. Kainiemi et al. (2015) found that tillage during fall affects soil CO2 emission rates for two weeks after the soil disturbance. In contrast, Hendrix et al. (1988) performed measurements in two consecutive vegetation seasons, but they did not detect a rise in soil CO2 emission induced by plowing in a conventional tillage treatment.
In the present case, soil tillage caused a sudden aeration deeper into the soil profile, which resulted in increased available oxygen concentration for the microorganisms. The highest abundance of aerobe microbial communities is mainly occurring at the top of the soil sur- face, where oxygen availability is also higher. In our previous study, we observed a micro- bial biomass almost four times higher in the NT treatment compared to P (81.9 μg C g−1 soil vs. 19.5 μg C g−1 soil, respectively; Tóth, 2011). In case of annual measurements, there were overall higher CO2 emissions in NT compared to P, likely due to a higher available carbon in the NT treatment. However, in the short term after a soil disturbance caused by plowing, the differences between organic carbon content showed less of a role in CO2 fluxes; the ma- jor cause of high emission values in the P treatment could be attributed to increased aerobe conditions. Also, disruption of aggregates enhanced by plowing creates labile organic com- pounds available for microorganisms present in the soil (Paustian et al., 2000), which might further influence CO2 emissions. Huisz et al. (2006) investigated different treatments of the current long-term tillage experiment and found that NT supported macroaggregate for- mation and stabilize organic matter, while the most soil-disturbing P treatment increased microbial breathing and decreased organic matter content in soils. Plowing degrades mac- roaggregates into separated blocks, thus sequestered CO2 can be emitted; additionally the more aerobe conditions are optimal for microbes producing CO2 (Wei et al., 2014). Panettieri et al. (2013) reported that even the quality of SOC depends on aggregates disturbed by vari- ous tillage methods because of their different oxidative environments.
Some of the flux figures recorded in literature include 0.56–6.38 mg CO2 m−2 s−1 in soils after plowing, and 0.03–0.31 mg CO2 m−2 s−1 after direct seeding (Reicosky et al., 2005;
Bauer et al., 2006; La Scala et al., 2006, 2008; Omonde et al., 2007). A number of scientists have observed that the initially intensive soil CO2 emission drops by about 60%–80%
after the passage of 12–24 h even after a deeper disturbance, plowing, or loosening. This short-term emission increase and sudden drop could be caused by the missing oxygen replenishment in the soil after plowing as the microbes use up the available oxygen, which becomes more limited with time and consequently reducing the rates of microbial respiration.
It is important to quantify emission rates induced by soil disturbance, but an integrated view can only be provided by the consideration of the long-term effect of tillage systems via regular measurements during the year. Soil tillage affects the physicochemical and biological properties of soil, hence its hydrothermal regime and soil biota are all influencing factors of SOC sequestration, decay of organic matter, and soil CO2 emissions.
REFERENCES 305
CONCLUSIONS
CO2 emissions showed no significant differences between plowed and no-tillage treat- ments throughout the vegetation season. However, NT tended to have higher emission rates at peak growing season (between DOY 106–177; from jointing to maturity stages).
An opposite result was obtained following the tillage event, when the short-term effects of soil disturbance caused higher CO2 emissions in P treatment compared to NT. Soil water content, temperature, oxygen availability, and soil organic carbon content had a major influence on soil CO2 emissions. The annual investigation suggested that higher soil organic carbon content was one of the major factors causing higher overall CO2
emissions in NT, as the soil physical factors were similar in both treatments. However, following the soil disturbance (plowing), CO2 emission rates were mainly influenced by soil physical shifts (higher aeration and breakage of soil aggregates) rather than soil chemical properties. Our findings suggest that long-term differences in CO2 emissions can diminish between treatments if no additional soil disturbance occurs.
Acknowledgements
The experiment has been supported by the VKSZ Agrarklima-2 project. This study was also supported by the Hungarian Scientific Research Fund (OTKA No. K101065, PD116084, and PD116157).
References
Alvaro-Fuentes, J., Cantero-Martinez, C., 2010. Short communication. Potential to mitigate anthropogenic CO2 emis- sions by tillage reduction in dryland soils of Spain. Span. J. Agric. Res. 8, 1271–1276.
Bauer, P.J., Frederick, J.R., Novak, J.M., Hunt, P.G., 2006. Soil CO2 flux from a norfolk loamy sand after 25 years of conventional and conservation tillage. Soil Tillage Res. 90, 205–211.
Birkás, M., Jug, D., Kisic, I., 2014. Book of Soil Tillage. Szent István University Press, Gödöllő.
Buyanovsky, G.A., Wagner, G.H., Gantzer, C.J., 1986. Soil respiration in a winter wheat ecosystem. Soil Sci. Soc. Am.
J. 50, 338–344.
Carbone, M.S., Richardson, A.D., Chen, M., Davidson, E.A., Hughes, H., Savage, K.E., Hollinger, D.Y., 2016.
Constrained partitioning of autotrophic and heterotrophic respiration reduces model uncertainties of forest ecosystem carbon fluxes but not stocks. J. Geophys. Res. 121, 2476–2492.
Chanzy, A., Gaudu, J.C., Marloie, O., 2012. Correcting the temperature influence on soil capacitance sensors using diurnal temperature and water content cycles. Sensors 12, 9773–9790.
Ciais, P., Wattenbach, M., Vuichard, N., Smith, P., Piao, S.L., Don, A., Luyssaert, S., Janssens, I.A., Bondeau, A., Dechow, R., Leip, A., Smith, P.C., Beer, C., vander Werf, G.R., Gervois, S., Van Oost, V., Tomelleri, E., Freibauer, A., Schulze, E.D., Carboeurope Synthesys Team, 2010. The European carbon balance. Part 2: croplands. Glob.
Chang. Biol. 16, 1409–1428.
Copec, K., Filipovic, D., Husnjak, S., Kovacev, I., Kosutic, S., 2015. Effects of tillage systems on soil water content and yield in maize and winter wheat production. Plant Soil Environ. 61, 213–219.
Corbeels, M., Marchão, R.L., Neto, M.S., Ferreira, E.G., Madari, B.E., Scopel, E., Brito, O.R., 2016. Evidence of limited carbon sequestration in soils under no-tillage systems in the Cerrado of Brazil. Sci. Rep. 6, 21450.
Dantec, L.V., Epron, D., Dufrêne, E., 1999. Soil CO2 efflux in a beech forest: comparison of two closed dynamic sys- tems. Plant Soil 214, 125–132.
Dorigo, W.A., Xaver, A., Vreugdenhill, M., Gruber, A., Hegyiová, A., Sanchis-Dufau, A.D., Zamojski, D., Cordes, C., Wagner, W., Drusch, M., 2012. Global automated quality control of in situ soil moisture data from the International Soil Moisture Network. Vadose Zone J. 12, 1–21.
Drewer, J., Anderson, M., Levy, P.E., Scholtes, B., Helfter, C., Parker, J., Rees, R.M., Skiba, U.M., 2016. The impact of ploughing intensively managed temperate grasslands on N2O, CH4 and CO2 fluxes. Plant Soil. https://doi.
org/10.1007/s11104-016-3023-x.
Dyer, L., Oelbermann, M., Echarte, L., 2012. Soil carbon dioxide and nitrous oxide emissions during the growing season from temperate maize-soybean intercrops season from temperate maize-soybean intercrops. J. Plant Nutr. Soil Sci. 175, 394–400.
Guan, D., Zhang, Y., Al-kaisi, M.M., Wang, Q., Zhang, M., 2015. Tillage practices effect on root distribution and water use efficiency of winter wheat under rain-fed condition in the North China Plain. Soil Tillage Res. 146, 286–295.
Harmon, T.C., Dierick, D., Trahan, N., Michael, F.A., Rundel, P.W., Oberbauer, S.F., Schwendenmann, L., Zelikova, T.J., 2015. Low-cost soil CO2 efflux and point concentration sensing systems for terrestrial ecology applications.
Methods Ecol. Evol. 6, 1358–1362.
Hendrix, P.F., Han, C.R., Groffman, P.M., 1988. Soil respiration in conventional and no-tillage agroecosystems under different winter cover crop rotations. Soil Tillage Res. 12, 135–148.
Huisz, A., Slutel, S., Tóth, T., Hofman, G., De Neve, S., Németh, T., 2006. Effect of cultivation systems on the distribu- tion of soil organic matter in different factors. Cereal Res. Commun. 34, 207–210.
IUSS Working Group WRB, 2015. World Reference Base for Soil Resources 2014, update 2015. International Soil Classification System for Naming Soils and Creating Legends for Soil Maps. World Soil Resources Reports No.
106. FAO, Rome. Available online: http://www.fao.org/3/a-i3794e.pdf.
Janssens, I.A., Freibauer, A., Ciais, P., Smith, P., Nabuurs, G.J., Folberth, G., Schlamadinger, B., Hutjes, R.W.A., Reinhart, C., Schulze, E.D., Valentini, R., Dolman, A.J., 2003. Europe’s terrestrial biosphere absorbs 7 to 12% of European anthropogenic CO2 emissions. Science 300, 1538–1542.
Janssens, A., Freibauer, A., Schlamadinger, B., Ceulemans, R., Ciais, P., Dolman, A.J., Heimann, M., Nabuurs, G.J., Smith, P., Valentini, R., Schulze, E.D., 2009. The carbon budget of terrestrial ecosystems at country-scale—a European case study. Biogeosciences 2, 15–26.
Kainiemi, V., Arvidsson, J., Katterer, T., 2015. Effects of autumn tillage and residue management on soil respiration in a long-term field experiment in Sweden. J. Plant Nutr. Soil Sci. 178, 189–198.
Kinzli, K., Manana, N., Oad, R., 2012. Comparison of laboratory and field calibration of a soil-moisture capacitance probe for various soils. J. Irrig. Drain. Eng. 138, 310–321.
Kumar, S., Nakajima, T., Kadono, A., Lal, R., Fausey, N., 2014. Long-term tillage and drainage influences on green- house gas fluxes from a poorly drained soil of central Ohio. J. Soil Water Conserv. 69, 553–563.
La Scala, N., Bolonhezi, D., Pereira, G.T., 2006. Short-term soil CO2 emission after conventional and reduced tillage of a no-till sugar cane area in southern Brazil. Soil Tillage Res. 91, 244–248.
La Scala, N., Lopes, A., Spokas, K., Bolonhezia, D., Archerc, D.W., Reicosky, D.C., 2008. Short-term changes of soil carbon losses after tillage described by a first-order decay model. Soil Tillage Res. 99, 108–118.
Le Quéré, C., Raupach, M.R., Canadell, J.G., Marland, G., Bopp, L., Ciais, P., Conway, T.J., Doney, S.C., Feely, R.A., Foster, P., Friedlingstein, P., Gurney, K., Houghton, R.A., House, J.I., Huntingford, C., Levy, P.E., Lomas, M.E., Majkut, J., Metzl, N., Ometto, P.J., Peters, G.P., Prentice, I.C., Randerson, J.T., Running, S.W., Sarmiento, J.L., Schuster, U., Sitch, S., Takahashi, T., Viovy, N., van der Werf, G.R., Woodward, F.I., 2009. Trends in the sources and sinks of carbon dioxide. Nat. Geosci. 2, 831–836.
Le Quéré, C., Andres, R.J., Boden, T., Conway, T., Houghton, R.A., House, J.I., Marland, G., Peters, G.P., van der Werf, G.R., Ahlström, A., Andrew, R.M., Bopp, L., Canadell, J.G., Ciais, P.S., Doney, C., Enright, C., Friedlingstein, P., Huntingford, C., Jain, A.K., Jourdain, C., Kato, E., Keeling, R.F., Klein Goldewijk, K., Levis, S., Levy, P., Lomas, M., Poulter, B., Raupach, M.R., Schwinger, J., Sitch, S., Stocker, B.D., Viovy, N., Zaehle, S., Zeng, N., 2013. The global carbon budget 1959–2011. ESSD 5, 165–185.
Myklebust, M., Hipps, L.E., Ryel, R.J., 2008. Comparison of eddy covariance, chamber, and gradient methods of measuring soil CO2 efflux in an annual semi-arid grass, Bromus tectorum. Agric. For. Meteorol. 148, 1894–1907.
Necpálová, M., Li, D., Lanigan, G., Casey, I.A., Burchill, W., Humphreys, J., 2013. Changes in soil organic carbon in a clay loam soil following ploughing and reseeding of permanent grassland under temperate moist climatic conditions. Grass Forage Sci. 69, 611–624.
New, M., Lister, D., Hulme, M., Makin, I., 2002. A high-resolution data set of surface climate over global land areas.
Clim. Res. 21, 1–25.
O’Dell, D., Sauer, T.J., Hicks, B., Thierfelder, C., Lambert, D.M., Logan, J., Eash, N.S., 2015. A short-term assessment of carbon dioxide fluxes under contrasting agricultural and soil management practices in Zimbabwe. J. Agric.
Sci. 7, 32–48.
REFERENCES 307
Omonde, R.A., Vyn, T.J., Smith, D.R., Hegymegi, P., Gál, A., 2007. Soil carbon dioxide and methane fluxes from long- term tillage systems in continuous corn and corn-soybean rotations. Soil Tillage Res. 95, 182–195.
Panettieri, M., Knicker, H., Berns, A.E., Murillo, J.M., Madejón, E., 2013. Moldboard plowing effects on soil aggrega- tion and soil organic matter quality assessed by 13C CPMAS NMR and biochemical analyses. Agric. Ecosyst.
Environ. 177, 48–57.
Paustian, K., Six, J., Elliott, E.T., Hunt, H.W., 2000. Management options for reducing CO2 emissions from agricultural soils. Biogeochemistry 48, 147–163.
Prior, S.A., Reicosky, D.C., Reeves, D.W., Runion, G.B., Raper, R.L., 2000. Residue and tillage effects on planting implement-induced short-term CO2 and water loss from a loamy sand soil in Alabama. Soil Tillage Res. 54, 197–199.
Rawls, W.J., Pachepsky, Y.A., Ritchie, J.C., Sobecki, T.M., Bloodworth, H., 2003. Effect of soil organic carbon on soil water retention. Geoderma 116, 61–76.
Reicosky, D.C., Lindstrom, M.J., Schumacher, T.E., Lobb, D.E., Malo, D.D., 2005. Tillage-induced CO2 loss across an eroded landscape. Soil Tillage Res. 81, 183–194.
Russell, R., 1978. Plant root systems: their function and interaction with the soil. Soil Sci. 125, 272.
Seyfried, M.S., Grant, L.E., Du, E., Humes, K., 2005. Dielectric loss and calibration of the hydra probe soil water sen- sor. Vadose Zone J. 4, 1070–1079.
Shahidi, B.M.R., Dyck, M., Malhi, S.S., 2014. Carbon dioxide emissions from tillage of two long-term no-till Canadian prairie soils. Soil Tillage Res. 144, 72–82.
Szabó, I.M., 2008. A talajművelés mikrobiológiája (Microbiology of tillage). In: Szabó, I.M. (Ed.), Az általános talajtan mikrobiológiai alapjai. (Microbiological Fundamentals of General Soil Science). Mundus, Budapest, pp. 349–355. (in Hungarian).
Tian, H., Lu, C., Ciais, P., Michalak, A.M., Canadell, J.G., Saikawa, E., Huntzinger, D.N., Gurney, K.R., Sitch, S., Zhang, B., Yang, J., Bousquet, P., Bruhwiler, L., Chen, G., Dlugokencky, E., Friedlingstein, P., Melillo, J., Pan, S., Poulter, B., Prinn, R., 2016. The terrestrial biosphere as a net source of greenhouse gases to the atmosphere.
Nature 531, 225–228.
Tóth, E., 2011. Soil Carbon-Dioxide Emission Measurements in Different Soil Use Systems (Talaj szén-dioxid emisszió- jának mérése eltérő talajhasználati rendszerekben) (PhD Dissertation). Corvinus University of Budapest, Budapest. 136 pp. (in Hungarian).
Wei, G., Zhou, Z., Guo, Y., Dong, Y., Dang, H., Wang, Y., Ma, J., 2014. Long-term effects of tillage on soil aggregates and the distribution of soil organic carbon, total nitrogen, and other nutrients in aggregates on the semi-arid loess plateau, China. Arid Land Res. Manag. 28, 291–310.
Zadoks, J.C., Chang, T.T., Konzak, C.F., 1974. A decimal code for the growth stages of cereals. Weed Res. 14, 415–421.
Zhang, M.Y., Wang, F.J., Chen, F., Malemela, M.P., Zhang, H.L., 2013. Comparison of three tillage systems in the wheat-maize system on carbon sequestration in the North China Plain. J. Clean. Prod. 54, 101–107.
Zhu, L., Hu, N., Yang, M., Zhan, X., Zhang, Z., 2014. Effects of different tillage and straw return on soil organic carbon in a rice-wheat rotation system. PLoS One 9, e88900.