Effect of Non-polar Extractable Substances on Soils and on Vegetation Cover from old Environmental Burdens
Ivana K
NAPCOVÁa– Helena H
YBSKÁa*– Hana O
LLEROVÁa– Dagmar S
AMEŠOVÁa– Ondrej V
ACEKb– Martina L
OBOTKOVÁa–
Darina V
EVERKOVÁc– Tamás R
ÉTFALVIda Department of Environmental Engineering, Faculty of Ecology and Environmental Sciences, Technical University in Zvolen, Zvolen, Slovakia
b Department of Mathematics and Descriptive Geometry, Faculty of Wood Sciences and Technology, University in Zvolen, Zvolen, Slovakia
c Institute of Foreign Languages, Technical University in Zvolen, Zvolen, Slovakia
d Institute of Chemistry, Faculty of Forestry, University of Sopron, Sopron, Hungary
Abstract – This case study focuses on the assessment of the effect of soil pollution by gudrons disposed in landfills. Waste products are acid tars, called "gudron" in the Slovakian terminology.
Gudrons are waste products resulting from sulphonation technologies used in oil processing. In the Slovak Republic, gudron landfills are risk localities and are classified as old environmental burdens.
Non-polar extractable substances (NES) as well as the activity of soil cellulase and basal soil respiration in soil samples taken from four different distances from the pollution sources were analysed. The effect of landfills on vegetation was assessed by recording the number and cover of plants on the sampling points. Long-term and gradual gudron contamination of the surrounding areas from both landfills is evident and has been proven by monitored NES concentrations. The pollution progress was predicted by the use of logistical function (based on the NES indicator) due to the increasing distance from the sources of pollution. Comparison of these two areas showed markedly higher oil substances pollution in the soil samples taken from the surroundings of the landfill Predajna 2. Determined content of NES did not meet the criteria of permissible concentration in soil samples, not even at a distance of 150 m (< 0.1 mg kg-1 in compliance with the Law No. 220/2004 Coll.). When determining basal soil respiration, the production of CO2 corresponded with oil pollution determined by the NES indicator. High concentrations of NES hinder enzymatic cellulase activity. The decomposition of cellulose occurs only at lower concentrations of NES. It is possible to range the soils of lower NES concentrations (soils taken from the distances of 70 m and 150 m from Predajna 1;
110 m and 150 m from Predajna 2) among the soils with weak or middle soil cellulose activity. This indicates that microbial activity was detected in the soil samples, and the values of this microbial activity were higher due to a decrease of inhibitors caused by oil pollution. That total surface vegetation cover increases as distance from the landfills increases indicated the validity of these facts.
soil cellulase activity / basal soil respiration / non-polar extractable substances / residues from oil processing / oil pollution
* Corresponding author: hybska@tuzvo.sk; SK-96001 ZVOLEN, T. G. Masaryka 24, Slovakia
Kivonat – Felhagyott hulladéklerakók környezeti terhelésének vizsgálata az apoláris kioldható anyagok talajra és a növényzetre gyakorolt hatásán keresztül. Kutatásunk során a hulladék- lerakókban elhelyezett gudron okozta talaj szennyezés hatásait vizsgáltuk. A gudron a pakura vákuumdesztillációját követően visszamaradó olajipari melléktermék. A Szlovák Köztársaságban a gudron lerakók régóta fennálló környezetterhelési kockázatbesorolást kaptak. A vizsgálatban a szennyezés forrásától négy különböző távolságból származó talajminták apoláris kioldható anyag (NES) tartalmát határoztuk meg, a talaj celluláz aktivitása és a talajlégzés mellett. A lerakók növényzetre gyakorolt hatásának vizsgálata a környező területek fitocönológiai felmérésével történt.
A vizsgálatba bevont mindkét lerakó hosszútávú folyamatos szennyezést okozott, amit a NES monitorozás igazolt. A szennyezés terjedésének mértékét a NES koncentrációk változásával lehetett nyomonkövetni. Eredményeink alapján elmondható, hogy a két vizsgálati hely közül a Predajna 2 esetében a talajban jóval kiterjedtebb olajszennyezés volt megfigyelhető. A mintákban mért NES koncentrációk még a legtávolabbi minták esetében is jelentősen meghaladták a jogszabályban megengedett határértéket (< 0,1 mg kg-1). A talajlégzés vizsgálata során a termelődő szén-dioxid mennyisége összefüggést mutatott a NES által jelzett olajszennyezéssel. A magas koncentrációban lévő NES esetén az enzimatikus celluláz aktivitás gátlása volt megfigyelhető. A cellulóz enzimatikus lebontása csak alacsony NES koncentrációk esetén lehetséges, így csak a lerakótól legtávolabbi mintákban volt mérhető gyenge, illetve közepes aktivitás. Ezekben a mintákban mért mikrobiális aktivitás az olajszennyezés okozta gátló hatás kisebb mértékével indokolható. A talajban mért szennyezés mértékét a növényborítottsági adatok is visszaigazolták.
talaj celluláz aktivitás / talaj alaplégzése / nem poláros kivonható anyagok / olajfeldolgozásból származó maradékok / olajszennyezés
1 INTRODUCTION
Pollution by oil substances originating from anthropogenic activity has been an urgent and long-term global environmental problem. Large oil and oil product leakages into the components of the environment, especially water and soil (Wolińska et al. 2016), occur every year. Oil substances enter the environment in a variety of ways, e.g. leakages from oil wells, pipes, underground containers, and incorrect oil waste disposal (Kimes et al. 2014).
Landfilling the residues from oil processing (gudrons) is an example of incorrect oil waste disposal. The waste – gudron (acid tars) – is produced during the refining of oil fractions with sulphuric acid. Gudron contains sulphuric acid as well as unwanted components removed from refined oil. In general, the composition of these residues depends on the composition of the oil (Speight 2006). In compliance with the valid legislation of the Slovak Republic (Regulation No. 365/2015 Coll.) gudrons are considered hazardous waste. They are dense, highly viscous compounds possessing an acrid, acidic smell. Gudrons are highly mobile and release sulphuric acid continuously (Tumanovsky 2004, Kolmakov 2006, Kreníková 2014).
Gudrons are a persistent and unstable waste, typical for their toxicity, mutagenicity, teratogenicity, and carcinogenicity (Paluchova 2009, Masarovičová, 2013, Milne 2016).
Gudron landfills are a threat to all parts of the environment. They pollute the air through the emissions they release during the summer months, pollute underground and surface water via leakages into surrounding areas, and also degrade the soil and contaminate the ore environment of the area in which they are present (Kreníková 2014). Soil health is not only important for people, but also for fauna and flora. Due to its sorptive and retentive properties, soil is a natural filter against pollutants circulating in the environment (Wyszkowski – Ziółkowska 2008). Contamination of the natural environment by oil substances contributes greatly to soil degradation. Though point sources contribute to contamination, it is the non- point sources of contamination that lead to the creation of integrated underground areas contaminated by these substances (Wyszkowski – Ziółkowska 2008). The environmental effect of oil substances on soil processes is the most visible in the activity changes of soil
microorganisms and enzymes (Li et al. 2007, Niemeyer et al. 2012), i.e. soil microbial activity can be considered a sensitive biological and biochemical indicator of soil quality (Margesin et al. 2000, Kaczyńska et al., 2015). Soil microorganisms are key elements in organic decomposition and mineralisation processes. Due to their quick reaction to changes and adaptation to the environmental conditions, soil microorganisms are often used as qualitative soil indicators. This is important for the preservation of favourable forest health.
Soil microbiota is able to react quickly to stress in the environment (Nielsen – Winding 2002, Nannipieri et al. 2003, Fodor – Pájer 2017). Soil respiration (release of CO2 by soil) and soil activity of cellulase belong to frequently monitored biological soil characteristics (Gömöryová ‒ Fekiačová 2013). Šimek and Šantučková (2002) define soil respiration and cellulose decomposition as one of the basic microbiological characteristics that determine soil quality and health. Carbon dioxide, released by respiration from soil, is a final product of the microbial metabolism of organic remains (with the exception of decomposed organic matter). Basal soil respiration, measured as total release of CO2, is an indicator of overall microbial activity in soil because the vast majority of prokaryotic and eukaryotic soil microorganisms obtain energy by oxidation from carbonaceous compounds. Basal soil respiration is also considered a rate of decomposition of mineral soil organic substances (Knoepp et al. 2000, Gömöryová et al 2013). Basal respiration is a main attribute related to fertility (Niemeyer et al. 2012) and a common indicator of soil quality (International Organisation for Standardisation 2002). Cellulose in the soil is commonly degraded by the cellulase enzyme, which is produced by microorganisms, usually by bacteria and fungi (Magnelli ‒ Forchiassin, 1999). Cellulose is the most abundant organic compound in the biosphere, which contains nearly half of the biomass synthesised by the photosynthetic fixation of CO2 (Eivazi ‒ Tabatabai 1990, Eriksson et al. 1990, Tomme et al. 1995).
Cellulose in soil originates mainly from the remains of plant matter, though fungi and bacteria in the soil also contribute limited amounts. The growth and survival of microorganisms depend on the source of carbon contained in the soil cellulose (Deng – Tabatabai 1994). To release carbon as an energy source, cellulose enzymes must degrade cellulose from plants to high-molecular oligosaccharides, cellobiose, and glucose. Within the process of systematic identification of environmental burdens, the following landfills were ranked among the environmental burdens of the Slovak Republic. Petrochema Dubová, a. s. as a refinery and petrochemical company processed oil using sulphonation and absorption technologies. Final products were made from obtained fractions, e.g. lubricating and special oils, detergents for laundry agents, and special white oils used in medicine and cosmetics. In the past, gudrons were placed in the natural environment and this lead to the creation of two gudron landfills:
Predajna 1 and Predajna 2 (Oravec 2014). This case study deals with the impact hazardous industrial waste – acid gudrons – from the Predajna 1 and Predajna 2 landfills have had and continue to have on soil and flora.
2 MATERIALS AND METHODS
This case study aims to assess the soil quality of areas contaminated by oil substances and evaluate soil basal respiration (CO2), soil cellulase activity, analytical determination of non- polar extractable substances (NES), and vegetation conditions. The experiment took place in the monitored areas over two years (2018 – 2019). The monitoring was carried out in two research areas: Predajna 1 and Predajna 2 (the Slovak Republic, the region of Banská Bystrica), in two transects and four sampling points at distances of 0.5 m, 50 m, 70 m, 150 m from Predajna 1 (following the spread of pollution), and at distances of 1 m, 75 m, 110 m, 150 m from Predajna 2 (following the spread of pollution). GPS coordinates of the sampling points: Predajna 1 – 1. N48°49.197 E19°29.018, 2. N48°49.192 E19°29.016, 3. N48°49.186
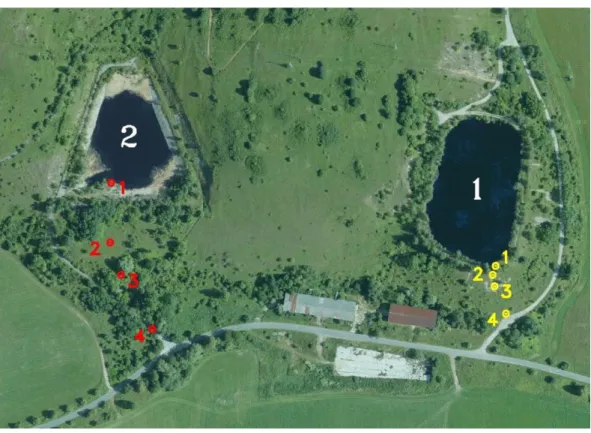
E19°29.018, 4. N48°49.172 E19°29.029 and Predajna 2 – 1. N48°49.227 E19°28.702, 2. N48°49.195 E19°28.704, 3. N48°49.178 E19°28.715, 4. N48°49.151 E19°28.743 – Garmin GPS map 62sc. The distances for Predajna 1 and Predajna 2 are not identical due to the different configurations and accessibilities of the sampling points (Figure 1).
Figure 1. Map of the locality and the sampling points 1 – Predajna 1; 1 - 0.5 m, 2 - 50 m, 3 - 70 m, 4 - 150 m 2 – Predajna 2; 1 - 1 m, 2 - 75 m, 3 - 110 m, 4 - 150 m
2.1 Sampling
Five soil samples were taken five times a year during the vegetation periods in 2018 and 2019. A manual sounding stick was used to take the samples from the depth of 15-20 cm from each of mentioned areas (Regulation of the Ministry of Environment of the Slovak Republic No.1/2015 on uniform methods of analytical waste examination), without any effect of outdoor conditions (no rainfall total and average temperature of 20°C). Sampling was completed in compliance with STN ISO 10381-6, and the samples were treated by quartering to obtain a representative sample. In order to preserve natural soil character, the soil samples for basal soil respiration and soil cellulase activity measurements were not sifted.
2.2 Determination of basal soil respiration
Respiration or basal soil respiration by the Isermeyer method was determined by the amount of released CO2 produced during an incubation period of 24 hours with the consequent titration with standardised volumetric solution of hydrochloric acid (c = 0.05 mol L-1), using phenolphthalein as an indicator. Data are expressed as μg CO2 g –1 of dry soil (Alef 1991, Kizilkaya et al. 2004).
2.3 Determination of soil cellulase activity
The determination was completed according to Islam (1998), i.e. the principle is incubation of sterile cellulose in a Petri dish with a soil sample. After 30 days, quantitative decrease
was evaluated (in %) from the surface of cellulase using IMAGE J software (freely available on the Internet).
2.4 Determination of oil substances
Oil substances in soil were determined as non-polar extractable substances (NES) using spectrophotometer in an infrared area by the extraction with organic diluent (S-316) (Ladomerský 2001).
2.5 Vegetation research
Vegetation research was conducted in the form of phytocenological records in compliance with the Zürich-Montpellier School principles in the surroundings of gudron landfills in the vegetation periods of 2018 and 2019. Qualitative and quantitative characteristics were monitored in phytocenological relevés. Qualitative characteristics of plant community represent a set of all species that occurred in the studied area in the given period. The estimation of cover was assessed from quantitative characteristics, i.e. percentage estimation of the area covered by certain species. Places of phytocenological relevés are identical with the sampling points (Braun-Blanquet 1964, Moravec 1994).
2.6 Analysis of results
Using the program STATISTICA 12, ANOVA with interactions, confidence intervals of 95%
and the program MatLab 2019b.
3. RESULTS AND DISCUSSION
This case study focuses on soil pollution in the surroundings of two gudron landfills, Predajna 1 and Predajna 2, which are environmental burdens in Slovakia. During exploratory works, 172,558 mg kg-1 of NES was determined in gudron waste (Auxt 2018). Predajna 1 was built with a protecting dike in 1964 and was in operation until 1974. Predajna 2 was used for the deposition of gudrons from 1974 to 1983. The bedrock at the landfills consists of limestone, dolomites and rocks of melafire sequence. The bottoms of the landfills are not sealed, which led to a 60,000 ton gudron leak into the bedrock in 1982 (Ollerová 2004, Michaeli 2010).
3.1 Assessment of oil pollution
To assess soil samples in the surroundings of Predajna 1 and Predajna 2, the distances for sampling were measured from 0.5 to 150 m from the landfills. Monitoring of oil pollution spreading from the landfills revealed no significant differences between the NES values in the range from 0.5 to 150 m from the landfills in the years 2018 and 2019. Therefore, a stabilised situation can be assumed. Oil substance contamination decreases as distance from the landfill increases. Comparison of these two areas showed markedly higher oil substances pollution in the soil samples taken from the surroundings of Predajna 2 (Table 3). We presume that the determined high concentrations of NES are affected by the approximately 60,000 ton leak of gudrons into the bedrock in 1982 (Michaeli 2010). Precipitation amounts have also affected the long-term, gradual gudron contamination of the surrounding area from both landfills.
Since both landfills are exposed, they are continuously replenished with rainfall, thereby increasing the environmental risk (Masarovičová 2013).
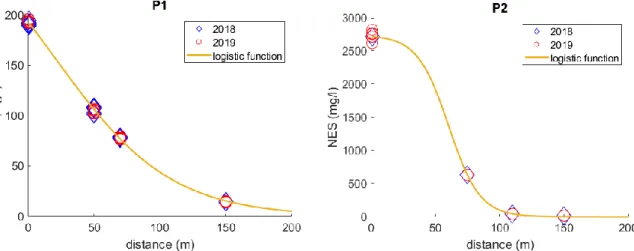
Figure 2. Estimation of the course of pollution depending on the distance (Note: P1 – Predajna 1; P2 – Predajna 2)
In order to model data, the most suitable logistic function was:
𝑦(𝑥) =1+𝑒𝑘2𝑥+𝑘3𝑘1 (1)
Table 1 and Table 2 contain the results of non-linear regression calculated with the MatLab 2019b program. All coefficients in the Tables are statistically significant.
Non-linear regression model: y ~ k1/(1 + exp(k2*x +k3)) – Predajna 1
Table 1. Estimated coefficients-non-linear regression parameters Predajna 1
Number of observations: 64, Error degrees of freedom: 61, Root Mean Squared Error: 24.8 R-Squared: 1, Adjusted R-Squared 1; F-statistic vs. zero model: 6.75e+04, p-value = 2.58e-107
Non-linear regression model: y ~ k1/(1 + exp(k2*x + k3)) – Predajna 2
Table 2. Estimated coefficients – non-linear regression parameters Predajna 2
Number of observations: 64, Error degrees of freedom: 61, Root Mean Squared Error: 1.75
R-Squared: 0.999, Adjusted R-Squared 0.999; F-statistic vs. zero model: 9.49e+04, p-value = 7.69e-112
When assessing the results, we focused on the evaluation of the course of pollution according to distance. The logistic function predicts the course of pollution (based on the NES indicator) to increasing distance from the pollution source (Predajna 1 and Predajna 2).
Table 1 - 2 and Figure 2 show that the NES content in the soil samples taken at a distance of 1 m from Predajna 2 was 14 times higher than it was in the soil 0.5 m from Predajna 1.
Only the 150m distance from both landfills showed no significant difference between the determined values of NES for both areas. Higher content of NES was detected in analysed
Estimate SE tStat pValue
K1 2736 8.8003 310.9 2.5 e-99
K2 0.0827 0.0040 –20.34 7.0 e-29
K3 –4.99 0.3090 16.15 1.0 e-23
Estimate SE tStat pValue
K1 312.16 6.6699 46.8 1.6 e-49
K2 0.02297 0.0004 –59.5 9.9 e-56
K3 –0.49 0.0543 8.98 9.2 e-13
soil from the surroundings of Predajna 2 at the distances of 1 m and 75 m. However, the spread of oil pollution at the distances of 110 m and 150 m decreased to nearly comparable levels of pollution in the sampling points of P1 (Note: P1- Predajna 1; P2 – Predajna 2).
Determined content of NES did not meet the criteria of permissible concentration in soil samples, not even at the 150 m distance (< 0.1 mg kg-1 in compliance with the Law No.
220/2004 Coll.).
Table 3. Characteristics of non-polar extractable substances (mg kg-1)
3.2 Assessment of basal soil respiration
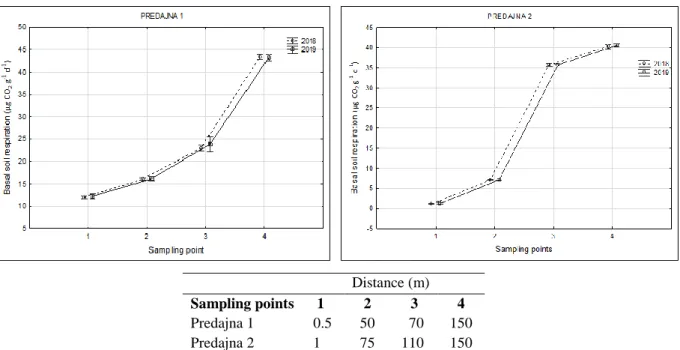
Oil pollution degrades physical and chemical soil characteristics. Greasy film on the soil surface limits air circulation between the soil and the atmosphere. Soil particles coated by oil hinder CO2 from leaving the soil for the air. Oil pollution also degrades the biological properties of soil (Frankovská 2010, Samešová 2011). Changes in soil caused by oil pollution were also monitored on the basis of determination of basal soil respiration. In the analysed samples (Figure 3, Table 4) the content of determined CO2 corresponds with determined NES values (Table 3): as presented by Hybská et al. (2013), basal soil respiration grows with decreasing NES content. In their scientific study, Polyak et al. (2018) dealt with the monitoring of basal soil respiration in soil burdened by oil pollution. They confirmed that CO2 production corresponds with the course of degradation of oil pollution controlled by the determination of petroleum hydrocarbons. Ali et al. (2020) found that the rate of CO2
development in the soil burdened with oil pollution ranged from 30.6 to 55.0 µg CO2 g-1 day-1.
Table 4. Statistical characteristics of basal soil respiration (µg CO2 g-1 day-1) results in the monitored locality
Predajna 1 Predajna 2
Year Distance
Average St. Confidence intervals Distance
Average St. Confidence intervals
(m) Error -95% 95% (m) Error -95% 95%
2018 0.5 11.98 0.09 11.70 12.25 1 1.16 0.01 1.11 1.21
2018 50 16.06 0.05 15.88 16.23 75 7.11 0.02 7.06 7.17
2018 70 23.08 0.20 22.43 23.72 110 35.69 0.12 35.31 36.06 2018 150 43.43 0.18 42.86 44.00 150 40.24 0.18 39.65 40.83
2019 0.5 12.23 0.14 11.76 12.69 1 1.22 0.04 1.11 1.34
2019 50 16.15 0.13 15.73 16.56 75 7.11 0.01 7.07 7.15
2019 70 23.91 0.52 22.25 25.56 110 35.71 0.08 35.47 35.95 2019 150 43.25 0.24 42.48 44.01 150 40.56 0.14 40.12 40.99
Predajna 1 Predajna 2
Distance (m) Average St. Error Distance (m) Average St. Error
2018 0.5 191.63 0.20 1 2715.31 0.30
2018 50 105.68 1.41 75 629.53 0.28
2018 70 78.07 0.18 110 43.12 0.07
2018 150 14.75 0.07 150 17.57 0.19
2019 0.5 193.77 0.74 1 2716.69 0.50
2019 50 105.00 0.54 75 629.47 0.14
2019 70 77.94 0.20 110 43.36 0.40
2019 150 14.66 0.15 150 17.97 0.13
Distance (m)
Sampling points 1 2 3 4
Predajna 1 0.5 50 70 150
Predajna 2 1 75 110 150
Figure 3. Graphical representation of basal soil respiration results
3.3 Assessment of soil cellulase activity
Polysaccharide cellulose is a basic component of plant tissue cell walls and is also the most common organic compound in the biosphere. After plants die, cellulose is decomposed by the enzymes that belong to the group of cellulases. Anthropogenic effects of oil pollution were assessed by the determination of the rate of soil cellulose activity. Cellulose was not decomposed in the most polluted soil samples (Table 5). Enzymatic cellulase activity was detected only at the lowest NES concentrations. According to Rejšek (1999), there is no cellulolytic enzyme activity in soils with the highest NES concentrations. It is possible to range the soils of lower NES concentrations (soils taken from the distances of 70 m and 150 m from Predajna 1; 110 m and 150 m from Predajna 2) among the soils with weak or middle activity of soil cellulase (Figure 4, Table 5). This means that microbial activity was detected in the soil samples and its values were higher due to the oil pollution-caused decrease of inhibitors. The results of this case study correspond with Hybská et al. (2013), where the percentage rate of the soil cellulase activity in the soil contaminated by oil was 2.12%. In soil contaminated by synthetic oil (completely or very well degradable oil), this figure was 8.72% (Fargašova 2009) while it was 15.95% in soil without oil pollution. For the comparison, the results of Javorekova et al. (2006) can be mentioned: the cellulose decomposition was detected at the depth of 0.1 m in agricultural soil (44% in brown earth and 35.15% in black earth). Compared with our results, obtained under the same conditions as mentioned in Javorekova (2006), high NES concentrations inhibit the enzymatic activity in such burdened soil (Table 3).
Table 5. Statistical characteristics of cellulase activity results in the monitored locality
Predajna 1 Predajna 2
Year Distance Average (%)
St. Confidence intervals Distance Average (%)
St. Confidence intervals
(m) Error -95% 95% (m) Error -95% 95%
2018 0.5 0.00 1 0.00
2018 50 0.02 0.01 0.00 0.05 75 0.00
2018 70 0.35 0.02 0.30 0.39 110 2.92 0.03 2.81 3.03
2018 150 0.90 0.00 0.89 0.91 150 1.83 0.45 0.39 3.26
2019 0.5 0.00 1 0.00
2019 50 0.02 0.00 0.01 0.03 75 0.00
2019 70 0.36 0.01 0.31 0.40 110 2.45 0.49 0.91 4.00
2019 150 1.04 0.01 1.01 1.06 150 1.45 0.02 1.40 1.50
Distance (m)
Sampling points 1 2 3 4
Predajna 1 0.5 50 70 150
Predajna 2 1 75 110 150
Figure 4. Graphical representation of cellusase activity results
3.4 Assessment of vegetation conditions
Several factors affect basal soil respiration and soil cellulase activity. Based on phytocenological records from 2018 and 2019, it is possible to state that the surface cover percentage increases with the increasing distance from the landfill border. Surface vegetation cover increased from 30% to 90% at Predajna 1 in 2018 and from 40% to 100% in 2019. At Predajna 2, the cover increased from 50% to 100% in both years of monitoring (Table 6). The number of species at Predajna 1 stayed identical or increased slightly with distance. In 2019, the number of species increased to 20 in the area closest to the landfill (in comparison with 8 in 2018). However, the cover only increased by 10%. No vegetation was detected in the area without any determined cover. A trench from the landfill border over the dike to the root of the dike was created there. It is possible that gudron waste was flowing away in that direction when landfill levels were high. This can be related to water erosion and excessive precipitation. A doubling of the amount of species does not automatically indicate a larger creation of biomass and higher cover. At Predajna 2, the higher number of species due to distance was not detected. However, total cover grew from 50% to 100%. Cellulase activity increased with distance from the landfill, as well as total vegetation cover of the area. Higher
cover leads to the higher the production (creation) of surface and underground biomass.
Consequently, the amount of waste and dead and decayed biomass rises as well.
The occurrence of the woody plants Betula pendula, Salix caprea, and Populus tremula was detected near the landfills. Herbs Calamagrostis epigejos and Dactylis glomerata achieve cover ranging from 25% to 50%. Arrhenatherum elatius and Rubus caesius cover is from 50% to 75%. With the exception of Arrhenatherum elatius, Pyšek (1981) and Hartman (1980) consider these herbs to be oil pollution tolerant. The occurrence of Calamagrostis epigejos was observed in the areas closest to the landfills where the highest NES content was also detected. According to the above-mentioned authors, Arrhenatherum elatius belongs to a group of species that are sensitive to oil pollution. This species did not occur in the areas where the highest NES concentrations were detected.
Table 6. Characteristics of vegetation in the monitored locality
Predajna 1 Predajna 2
Year Distance (m)
Number of species
Total cover (%)
Distance (m)
Number of species
Total cover (%)
2018 0.5 8 30 1 12 50
2018 50 10 70 75 19 90
2018 70 0 0 110 20 80
2018 150 9 90 150 14 100
2019 0.5 20 40 1 11 50
2019 50 13 80 75 22 100
2019 70 0 0 110 19 70
2019 150 13 100 150 13 100
4. CONCLUSIONS
Based on the obtained results of this case study, we can conclude that gudron waste is an environmental burden for soil. This was proved by the presence of non-polar extractable substances (NES) in soil samples at different distances from the landfills. Contamination decreased in accordance with increasing distance. The assessment of the course of oil pollution based on the NES indicator according to distance is predicted by a logistic function.
Cellulose was not decomposed in soil that was closest to gudron landfills. Soil activity increased as distance from the landfills increased. Higher microbial activity was detected in the samples where inhibitors were lowered due to the pollution. Basal respiration highlights the ability of microorganisms to use available substrate, especially organic matter. Basal respiration determination is significant in soils affected by different negative factors, e.g.
negative anthropization (in this case oil pollution). CO2 production rose as distance from the landfills increased. This corresponds with the course of degradation of oil pollution controlled by the determination of non-polar extractable substances. Based on the phytocenological records from 2018 and 2019, we conclude that percentage cover of the area increases as distance from the landfill border increases. Determination of basal soil respiration and cellulase activity were confirmed as suitable indicators for the monitoring of oil polluted soil.
Based on these findings, we recommend the assessment of basal soil respiration as a suitable monitoring method to measure soil contamination by oil substances. This method is more financially and environmentally accessible than NES monitoring. Monitoring of these indicators is also important in forest ecosystems.
Acknowledgements: The project was supported by EFOP-3.6.2-16-2017-00018 in University of Sopron project.
REFERENCES
ALEF, K. (1991): Methodenhandbuch Bodenmikrobiologie. Aktivitäten, Biomasse, Differenzierung.
Ecomed. Landesberg. 284 p.
ALI, W. A. – FARID, W. A. – AL-SALMAN, A. N. K. (2020): Bioremediation of agricultural soil contaminated by a crude oil spill. – Applied Ecology and Environmental Research 18 (1):
237-252 https://doi.org/10.15666/aeer/1801_237252
BRAUN-BLAQUET, J. (1964): Pflanzensoziologie. Grundzüge der Vegetationskunde. – Aufl. 3 [Plant sociology. Fundamentals of vegatation science] Springer Verlag, 866 p. (in German)
DENG,S.P.–TABATABAI,M.A. (1994): Cellulase activity of soils. – Soil Biology and Biochemistry 26 (10): 1347–1354.
EIVAZI,F. –TABATABAI,M.A. (1990): Factors affecting glucosidase and galactosidase activities in soils. – Soil Biology and Biochemistry 22 (7): 891–897
https://doi.org/10.1016/0038-0717(90)90126-K
ERIKSSON,K. –BLANCBETTE,R.A. –ANDER,P. (1990): Biodegration of cellulose. – Microbial and Enzymatic Degradation of Wood and Wood Components. 89–180.
https://doi.org/10.1007/BF00225309
FARGAŠOVÁ,A.(2009): Ekotoxikologické biotesty. 317. [Ecotoxicological bioassays] ISBN 978-80- 8046-422-6. (In Slovakian)
FODOR ELEKNÉ, V. – PÁJER, J. (2017): Application of environmental information systems in environmental impact assessment (in Hungary). Acta Silv. Lign. Hung. 13 (1): 55–67.
https://doi.org/10.1515/aslh-2017-0004
FRANKOVSKÁ, J. – SLATINKA, I. – KORDÍK, J. (2010): Atlas sanačných metód environmentálnych záťaží. – Štátny geologický ústav Dionýza Štúra. [Atlas of the remediation methods for environmental loads. - Dionýz Štúr State Geological Institute] ISBN 978-80-89343-39-3.
(in Slovakian)
GӦMӦRYOVÁ, E. – FEKIAČOVÁ, Z. (2013): Dynamika a variabilita bazálnej respirácie pôdy na výškovom tranzekte v stredohorskej oblasti Poľany [Dynamics and variability of basal soil respiration at the altitude transect in the central mountain area of Poľana]. Acta Facultatis Forestalis Zvolen 55 (1): 59–72. (in Slovakian)
GӦMӦRYOVÁ, E. – STŘELCOVÁ, K. – ŠKVARENINA, J. – GӦMӦRY (2013): Responses of soil microorganisms and water content in forest floor horizons to environmental factors. – European Journal of Soil Biology 55: 71–76. https://doi.org/10.1016/j.ejsobi.2012.12.001
HARTMAN, Z. (1980): Vliv ropných látek na vegetaci. [Influence of oil substances on vegetation].
Vodní hospodářství, 1, (B): 23 –26. (in Slovakian)
HYBSKÁ,H. –SAMEŠOVÁ, D.– LOBOTKOVÁ, V. (2013): Aktivita pôdnych celuláz a biodegradačný proces v kontaminovanej lesnej pôde. [Soil cellulose activity and biodegradation process in contaminated forest soil]. Monitorovanie a hodnotenie stavu životného prostredia XI:79–85.
(in Slovakian)
ISLAM,K.R.–WEIL,R.R. (1998): Microwave irradiation of soil for routine measurement of microbial biomass carbon. Biol. Fert. Soils 27: 408–416. https://doi.org/10.1007/s003740050451
ISO 17155 (2002): International Organization for Standardization Soil quality, determination of abundance and activity of soil microflora using respiration curves.
JAVOREKOVÁ, S. – HUDECOVÁ, I. (2006): Kvalita pôdy a pôdnych typov černozem a hnedozem.
[Quality of soil and soil types chernozem and brown soil]. Aktuálne problémy riešené v agrokomplexe. 142–150. ISSN 80-8069-799. (In Slovakian)
KACZYŃSKA,G.– BOROWIK,A.–WYSZKOWSKA,J. (2015): Soil dehydrogenases as an indicator of contamination of the environment with petroleum products. – Water Air Soil Pollut. 226 (11): 372 p. https://doi.org/10.1007/s11270-015-2642-9
KIMES,N.E.–CALLAGHAN,A.V.–SUFLITA,J.M.–MORRIS,P.J. (2014): Microbial transformation of the Deepwater Horizon oil spill, past. present. and future perspectives Front. – Microbiol. 5:
603 p. https://doi.org/10.3389/fmicb.2014.00603
KIZILKAYA,R.–ASKIN,T.–BAYRAKLI,B.–SAGLAM,M. (2004): Microbiological characteristics of soils contaminated with heavy metals. – European Journal of Soil Biology 40 (2): 95–102.
https://doi.org/10.1007/s10661-007-0022-7
KNOEPP,J.D.–COLEMAN,D.C.–CROSSLEY,D.A.–CLARK,J.S. (2000): Biological indices of soil quality: an ecosystem case study of their use. – Forest Ecology and Management 138 (1–3):
357-68. https://doi.org/10.1016/S0378-1127(00)00424-2
KOLMAKOV,G.A.–ZANOZINA,V.F.– KARATAEV,E.N.– GRISHIN,D.F.–ZORIN,A.D. (2006):
Thermal cracking of acid tars to asphalts as a process for utilization of refinery wastes. – Petroleum Chemistry 46 (6): 384–388. https://doi.org/10.1134/S0965544106060028
KRENÍKOVÁ,V. (2014): Odpady a druhotné suroviny I. [Waste and secondary raw materials]. 54–97.
ISBN 978-80-7414-870-5. (in Slovakian)
LADOMERSKÝ, J. – SAMEŠOVÁ, D. (2001): Environmentálne impakty analýzy ropných látok.
[Environmental impacts of oil analysis]. Vedecká štúdia. Zvolen. 82 p. (in Slovakian) Law No. 220 (2004): Coll. on the protection and use of agricultural land
LI,Y.– ZHANG,H.– KRAVCHENKO,I.–XU,H.–ZHANG,C. (2007): Dynamic changes in microbial activity and community structure during biodegradation of petroleum compounds: a laboratory experiment. – J. Environ. Sci. 19 (8): 1003–1013.https://doi.org/10.1016/S1001-0742(07)60163-6 MAGNELLI, P. – FORCHIASSIN, S. (1999): Regulation of the cellulase complex production by
Saccobolus saccoboloides: induction and repression by carbohydrates. – Mycologia 9(2):
359-364.
MARGESIN, R. – ZIMMERBAUER, A. – SCHINNER, F. (2000): Monitoring of bioremediation by soil biological activities. – Chemosphere 40 (4): 339–346.https://doi.org/10.1016/S0045-6535(99)00218-0 MASAROVIČOVÁ, M. – SLÁVIK, I. (2013): Komplexny monitoring odkalisk SR. [Comprehensive monitoring of sludge ponds in the Slovak Republic]. Slovakian Technical University of
Bratislava, PM 20, Cast 9. (in Slovakian)
https://dionysos.geology.sk/cmsgf/files/Hodn_monitor_2013/Komplexny_monitoring_odkalisk_2 013.pdf
MICHAELI, E. – BOTIŽIAR, M. (2010): Vybrané lokality environmentálnych záťaží v Slovenskej republike. [Selected localities of environmental burdens in the Slovak Republic]. – Geographia Cassoviensis.114 –117. ISSN 1337-6748. (In Slovakian)
MILNE,D.D.–CLARK,A.L.–PERRY,R. (2016): Acid Tars: their production, treatment and disposal in the U.K. – Waste Management and Research. 4 (1): 407–418.
https://doi.org/10.1177/0734242X8600400159
MORAVEC, J., ET AL. (1994): Phytocoenology-The study of vegetation. Academia, Praha.404. (In Czech). ISBN 80-200-0457-2
NANNIPIERI,P.–ASCHER,J.–CECCHERINI,M.T.–LANDI,L.–PIETRAMELLARA,G.–RENELLA,G.
(2003): Microbial diversity and soil functions. – Eur. J. Soil Sci. 54 (4): 655–670.
https://doi.org/10.1046/j.1351-0754.2003.0556.x
NIELSEN,M.N.–WINDING,A. (2002): Microorganisms as Indicators of Soil Health. NERI Technical Report 388: 82. ISBN 87-7772-658-8.
NIEMEYER,J.C.–LOLATA,G.B.–CARVALHO,G.M.–DA SILVA,E.M–SOUSA,J.P.–NOGUEIRA, M.A. (2012): Microbial indicators of soil health as tools for ecological risk assessment of a metal contaminated site in Brazil. Applied Soil Ecology 59: 96–105.
https://doi.org/10.1371/journal.pone.0141772
OLLEROVÁ, H. (2004): Flóra a vegetácia stanovíšť ovplyvnených ropnými látkami v oblasti Petrochema Dubová [Flora and vegetation of habitats affected by oil substances in the area of Petrochema Dubová] – Vedecké štúdie Zvolen. 117. ISBN 80-228-1428-8. (In Slovakian)
ORAVEC,M.–FIC,M. (2014): Systém hodnotenia rizík pre posúdenie environmentálnej škody: podľa zákona NR SR č. 359/2007 Z. z. Metodická príručka určená pre prevádzkovateľov a štátnu správu Banská Bystrica: SAŽP. [Risk assessment system for environmental damage assessment:
according to Act no. 359/2007 Coll. Methodological manual intended for operators and state administration Banská Bystrica] ISBN 978-80-89503-36-0. (in Slovakian)
PALUCHOVÁ, K. – BRUCHÁNEKOVÁ, A. (2009): Environmentálne záťaže – Banskobystrický kraj. [Environmental burdens - Banská Bystrica Region] – Enviromagazín 14 (1): 10–11. ISSN 1335-1877. (in Slovakian)
POLYAK,Y.– BAKINA, L.G. –CHUGUNOVA,V. M.– MAYACHKINA,N.V. –GERASIMOV,A.O. – BURE,V.M. (2018): Effect of remediation strategies on biological activity of oil, contaminated soil – A field study. – International Biodeterioration and Biodegradation. 126: 57–68.
https://doi.org/10.1016/j.ibiod.2017.10.004
PYŠEK,A. (1981): Ropa a vegetace. [Oil and vegetation] Lesnická práce 12: 214 p. (in Slovakian) REGULATION NO.1 (2015): The uniform methods for the analytical inspection of waste - Sampling of
soil contaminated waste
REGULATION NO.365 (2015): Coll. Waste catalog
REJŠEK,K. (1999): Lesnicka pedologie 1 [Forest pedology 1] MZLU, Brno, 22 - 23. ISBN 80-7157- 352-3. (in Czech)
SAMEŠOVÁ, D. – HYBSKÁ, H. (2011): Výskum environmentálnych impaktov ropných látok v prírodnom prostredí. [Research of environmental impacts of petroleum substances in the natural environment] – Vedecká monografia. 85. ISBN: 9788022818322. (in Slovakian)
ŠIMEK, M. –ŠANTUČKOVÁ, H. (2002): Biologické indikátory kvality půd. [Biological indicators of soil quality] MZLU. 32–38. (In Czech)
SPEIGHT, G. – JAMES (2006): Native materials and Manufactured materials. – The chemistry and Technology OF Petroleum. ISBN 13: 978-0-8493-9067-8.
STNISO10381-6 Soil quality. Sampling. Part 6: Guidance on the collection, handling and storage of soil for the assessment of aerobic microbial processes in the laboratory
TOMME,P.–WARREN,R.A.J.–GILKES,N.R. (1995): Cellulose hydrolysis by bacteria and fungi. – Advances in Microbial Physiology 37: 1–81. https://doi.org/10.1016/S0065-2911(08)60143-5 TUMANOVSKY,A.G.–KOSOBOKOVA,E.M.–RYABOV,G.A., (2004): Production of energy carriers
as a method of utilizing the bottom layer of acid tar. Chemistry and Technology of Fuels and Oils 6 (40): 351–357.
WOLIŃSKA,A.– KUŹNIAR,A.–SZAFRANEK-NAKONIECZNA,A.–JASTRZEBSKA,N.–ROGUSKA,E.– STEPNIEWSKA, Z. (2016): Biological Activity of Autochthonic Bacterial Community Oil. – Contaminated soil, water, air, & soil pollution 227 (5): 130 p.
https://doi.org/10.1007/s11270-016-2825-z
WYSZKOWSKI,M.–ZIOŁKOWSKA,A.(2008):Content of organic carbon and mineral components in soil contaminated with petroleum derived substances. – Eurasian Journal of Sustainable Agriculture 2 (1): 54–60. https://doi.org/10.1051/agro/2009040