Interpretation of soil quality indicators for land suitability assessment – A multivariate approach 1
for Central European arable soils 2
3
Katalin JUHOS1, Szabolcs CZIGÁNY2, Balázs MADARÁSZ1,3, Márta LADÁNYI4 4
5
1Department of Soil Science and Water Management, Faculty of Horticultural Science, Szent István 6
University, 29-43 Villányi St., H-1118 Budapest, Hungary, E-mail: juhos.katalin@kertk.szie.hu 7
2 Department of Physical and Environmental Geography, Institute of Geography and Earth Sciences, 8
University of Pécs, 6, Ifjúság St., H-7624 Pécs, Hungary 9
3Geographical Institute, Research Centre for Astronomy and Earth Sciences, Hungarian Academy of 10
Sciences, Budaörsi St. 45., H-1112 Budapest, Hungary 11
4Department of Biometrics and Agricultural Informatics, Faculty of Horticultural Science, Szent István 12
University, 29-43 Villányi St., H-1118 Budapest, Hungary 13
14
Abstract 15
Soils and their functions are critical to ensure the provision of various ecosystem services. Many 16
authors nevertheless argue that there are a lack of satisfactory operational methods for quantifying 17
the contributions of soils to the supply of ecosystem services. Therefore, it is difficult to automate 18
and standardize the mathematical and statistical methods for the selection of indicators and their 19
scoring. Our objective is the development of a novel soil quality and ecological indicator selection 20
and scoring method based on a database representing the most common Hungarian soils typical for 21
arable lands of Central Europe (Chernozems, Phaeozems, Luvisols, Cambisols, Gleysols, Solonetz, 22
Arenosols). For evaluation purposes, soil texture, depth to groundwater table, soil organic matter 23
(SOM), pH, calcium carbonate equivalent (CCE), electrical conductivity (EC), Na, available N, P, K, Mg, 24
S, Cu, Zn and Mn of 1045 plots representing a total land area of about 5,000 hectares at 0-30 cm 25
layer were analyzed. We classified the samples into 25 soil types. Using correlation, principal 26
component analysis and discriminant analysis the direction and strength of the intercorrelation of 27
indicators and their combinations were determined. Indicators were classified into the following 28
categories: (1) indicators that characterize nutrient retention and cation exchange capacity: texture, 29
SOM, EC and Na; (2) available nutrients, relatively independent from management practices: K, Mg, 30
Cu; (3) indicators that determine base saturation: pH, CCE, available Mn; (4) highly variable available 31
nutrients: N, S, P, Zn. By reviewing the results of Hungarian long-term experiments, we interpreted 32
the soil indicators as a function of agricultural suitability. Following the parameterized and non-linear 33
interpretation of the indicators, we analysed the variance of soils, in terms of their agricultural land 34
suitability. According to the intercorrelation of input indicators and variance of scored indicators the 35
minimum data set for soil quality assessment includes texture, depth of groundwater table, SOM, pH, 36
Na, available K, P and Zn. In order to further advance our soil quality assessment model, our 37
following goals target the determination the hierarchical ranking and grouping of soil parameters in a 38
combined manner.
39
Keywords: indicator scoring functions, principal component analysis, soil quality index, available 40
nutrients, soil moisture regime 41
42
1. Introduction 43
*Manuscript
Click here to view linked References
To prevent and mitigate soil degradation processes, spatial and temporal heterogeneity pedological 44
data with readily measurable indicators, are essential for appropriate soil management strategies.
45
Soil quality refers to the capacity of soils to function and sustain plant and animal life within natural 46
and managed environments (Karlen et al., 1997). Soil quality cannot be directly obtained but rather 47
inferred by measuring the appropriate soil physical, chemical and biological indicators (de Paul 48
Odabe and Lal, 2016).
49
Soil Quality Indices (SQIs) synthesize soil attributes into a format that enhances the understanding of 50
soil processes and promotes appropriate management. The Soil Management Assessment 51
Framework (SMAF) is an example of an SQI that operates in three steps (Andrews et al., 2004): (1) 52
indicator selection; (2) interpretation of the selected indicators (scoring); and (3) aggregation of 53
indicators in an index through weighted additive technique. Site-specific adaptations of these SQI are 54
the most commonly used approaches today to evaluate impacts of agricultural practices, cropping 55
systems (Armenise et al., 2013; Li et al., 2013; Ivezić et al., 2015; Raiesi and Kabiri, 2016; Biswas et al., 56
2017), land use change and land degradation (Masto et al., 2016; Raiesi, 2017). During a land 57
suitability assessment (Kurtener and Badenko, 2000; Baja et al., 2007), the most important task is the 58
evaluation of the productivity function of soils and the impact of soil properties on yield. However, 59
this is complicated as soil properties, in various combination and to a different degree, influence crop 60
yields and determine soil functions in a mixed manner.
61
Among the available soil quality indicators selection methods, Total Data Set (TDS) and Minimum 62
Data Set (MDS) have been commonly used (Ghaemi et al., 2014; Rojas et al., 2016). In the MDS 63
indicators are selected based on expert opinion or multivariate statistical analyses, most commonly 64
through principal component analysis (PCA) (Andrews et al., 2004).
65
The second step is normalizing the MDS indicators by different numerical scales (usually between 0 66
and 1) using linear and non-linear scoring functions. The mathematical basis of this scheme is 67
provided by the Fuzzy logic (Zhang et al., 2004; Busscher et al., 2007). This method is a clustering 68
approach in which the true values of variables (membership) may be any real number between 0 and 69
1, where, in our case, 0 completely fails to fulfil, while 1 completely fulfils the demands of land use.
70
Globally, the most commonly accepted linear and non-linear functions and integrating method of 71
scaled indicators with a weighted additive manner provided by the SMAF (Andrews et al., 2004). In 72
some cases, the selection, the linear interpretation, and determination of scoring thresholds of the 73
indicators are based on linear correlation between the indicators and yield (Thuithaisong et al., 2011;
74
de Paul Obade and Lal, 2016; Biswas et al., 2017).
75
The need for the standardization of indices is a vital issue (de Paul Obade and Lal, 2016). We believe 76
that the automation of the statistical selection of MDS is insufficient as the impact of selected soil 77
parameters for the ecological functions is usually non-linear. Evidently, the functions of soils and soil 78
quality are manifested under given conditions (climatic, hydrologic and topographic), and can only be 79
interpreted according to land use type or the specific necessities of the plant grown in a specific soil.
80
When selecting indicators soil quality indexes should be meet the needs of a variety of soil types 81
even in relatively small areas (Juhos et al., 2015).
82
There is a limited number of Central European SQI references available (Ivezic et al., 2015; Teodor et 83
al., 2018). In Hungary, soil quality indices based on simple indicators, are not in use for land 84
evaluation (Makó et al., 2007; Debreczeniné et al., 2003; Tóth et al., 2007a). The adaptation of soil 85
quality indices to different environmental conditions is influenced by the employed soil analytical 86
methods. In our opinion, the development of soil quality indices, especially for land suitability 87
assessment, under the temperate climate of Central Europe requires a more complex multivariate 88
approach.
89
Our objective, therefore, is the development of a novel soil quality assessment method based on a 90
database representing some Central European cultivated soil types and Hungarian soil analytical 91
methods. We intend to elaborate a multivariate soil evaluation method, which expresses the rate, 92
quality and combination of the limiting factors on soil productivity. Our specific goals in this study 93
included (1) the multivariate assessment of indicators determined according to the existing 94
Hungarian standards (2) the determination of the direction and strength of their intercorrelation and 95
(3) the comprehensive evaluation of the indicators by mathematical modelling and according to the 96
scored indicators by soil types identification of limiting factors for plant growth. These goals were 97
achieved by reviewing the results of Hungarian long-term experiments, the complex and mutual 98
interpretation of the indicators by mathematical modelling as a function of agricultural land 99
suitability.
100 101
2. Materials and methods 102
2.1. Site description 103
The employed soil database, representative of Hungary’s farmlands, was compiled from the 104
laboratory analyses of 1045 soil samples collected from a total land area of about 5,000 hectares.
105
Each soil sample represents a homogeneous land parcel of maximum of 5 hectares. In all cases, 106
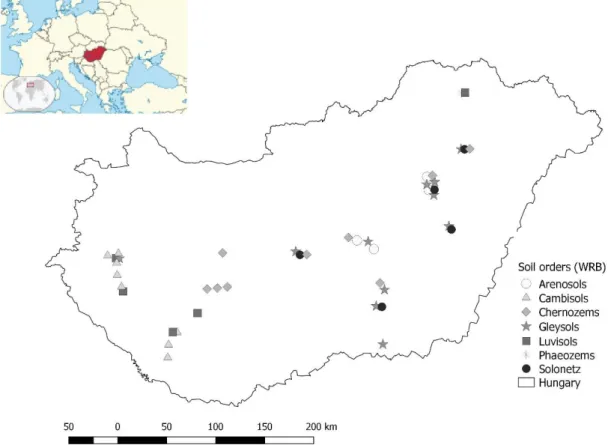
samples were taken from a depth of 0 to 30 cm. The geographical location of the sampling sites is 107
shown in Figure 1. The soil types of the research sites and their qualifiers are shown in Table 1 108
according to the World Reference Base (WRB) (FAO, 2014) classification. The climate of the studied 109
sites is characterized by cool winters and hot, dry, drought-prone summers, with a mean annual 110
precipitation of 580 mm and mean annual temperature of 10.5°C (Fábián and Matyasovszky, 2010).
111
Each of the experimental sites is uniformly cultivated by conventional tillage techniques. The 112
following crops have been grown in a crop rotation: winter wheat (Triticum aestivum L.) and maize 113
(Zea mays L.), and occasionally alfalfa (Medicago sativa L.), sunflower (Helianthus annuus L.) and 114
rape (Brassica napus L.).
115
2.2. Soil analyses 116
The total analysed soil data set is composed of parameters determined according to the responsible 117
authorities. Soil pH was determined at a soil/1 M KCl solution ratio of 1:2.5 and electrical 118
conductivity (EC) was measured in a 1:5 soil/water mixture potentiometrically (MSZ-08-0206- 119
2:1978). Determination of the calcium carbonate equivalent (CCE) was conducted using the 120
volumetric method (MSZ-08-0206-2:1978). Soil organic matter (SOM) was measured by the Tyurin 121
method (Kononova, 1966). Available nutrient contents were determined with acidic (pH 3.75) 122
ammonium lactate extraction (Egnér et al., 1960) for phosphorus (P) and potassium (K), in 1 M KCl 123
extraction for nitrogen (N), magnesium (Mg) and sulfur (S), in nKCl + EDTA extraction (MSZ 124
20135:1999) for zinc (Zn), copper (Cu) and manganese (Mn). The determination of soluble and 125
exchangeable sodium (Na) was based on extraction with acid ammonium lactate (Egnér et al., 1960).
126
Soil texture was characterized using a plasticity test by the water volume (cm3) for consistency 127
change to fluid for 100 g of soil (MSZ-08-0205:1978). This water volume highly correlates with the 128
clay content and the exchangeable Na, and it well characterizes the water retention capacity of soils 129
(Várallyay, 2008). We also monitored the mean annual groundwater table depths for Solonetz soils 130
and Gleysols at multiple sites.
131
2.3. Statistical analyses 132
The paired relation between the variables was examined by the Pearson correlation coefficient (r). To 133
determine intercorrelation among the indicators, we also performed a Principal Component Analysis 134
(PCA) based on the standardized database. For standardization, we used the formulae log(x+1) in 135
order to enhance normality and linearity and to reduce the effect of outliers. The suitability of the 136
sampling (selected variables) was determined with Kaiser-Meyer-Olkin (KMO) and Bartlett tests. Only 137
principal components (PCs) with eigenvalue > 1.0 were analysed (Andrews et al., 2004). The PCs were 138
evaluated based on the loadings of the individual variables (the correlation between the variable and 139
the principal component). To determine the explanatory power of the soil forming processes of input 140
indicators, for the WRB orders as dependent category variable, discriminant analysis (DA) was 141
performed with the PCs as independent variables. Normality of data was analysed by the 142
Kolmogorov-Smirnov test and skewness and kurtosis of variables. All data were statistically 143
processed using IBM SPSS Statistics 22 and MS Excel.
144
2.4. Indicator scoring and mathematical modelling 145
To develop novel site-specific soil indicator scoring functions, we analysed the results of the 146
Hungarian fertilization and soil amendment long-term experiments and land management methods 147
(Table 2). According to our findings, the indicators and their critical threshold values were analysed 148
and interpreted. By reviewing the literature, we also incorporated the ecological requirements of the 149
crops but we did not evaluate indicators plant-specifically. Practically, however, crop rotation is 150
employed, therefore, a general evaluation was applied to the most common crop cultures. All 151
indicators were scored on a scale of 0 to 1 expressed either on the linear or non-linear scale, where 0 152
completely contradicts the demands of land use, while 1 completely corresponds with that. As 153
individual parameters cannot be evaluated independently, we took into consideration the soil 154
properties most directly influences each other, i.e. the models were differentiated by soil categories 155
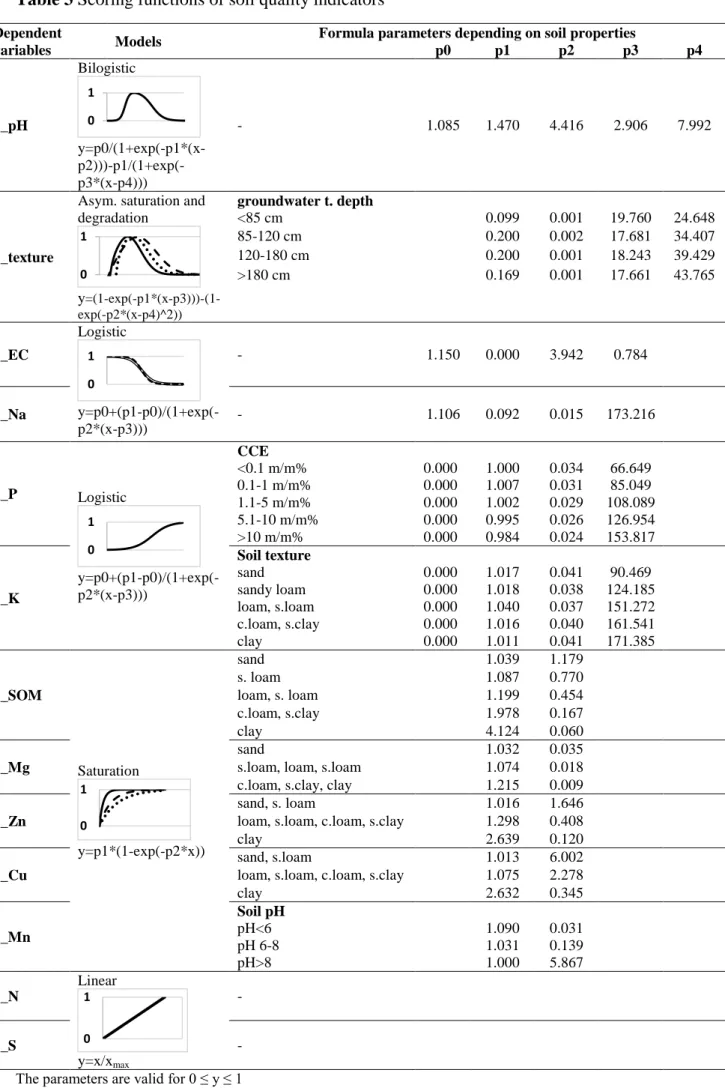
in some cases. The models of soil quality properties and their parameters are shown in Table 3. The 156
mathematical modelling was performed in MS Excel software.
157
The pH was interpreted with a bilogistic model that has a saturation value (p0) with slope and 158
inflexion parameters in both the increasing (p1, p2) and decreasing phases (p3, p4). Asymmetric 159
saturation and degradation models were used to score the texture properties. Based on the 160
groundwater depth their increasing and decreasing slope parameters (p1, p2) and axis shift and peak 161
point parameters (p3, p4) were changed. The EC and Na were interpreted using logistic models (“less 162
is better”) where p0, p1, p2, p3 are their limit, slope and inflexion point parameters, respectively. The 163
logistic models (“more is better”) of the available K and P are significantly influenced by soil texture 164
and pH hence their parameters were changed accordingly. The SOM, available Mg, Zn and Cu were 165
interpreted with saturation models (where p1 is the saturation parameter, p2 is the slope parameter) 166
but when modelling we made a difference by soil texture. In the case of the saturation model of 167
available Mn, the parameters of function were differentiated by soil pH. The mineralized N and S 168
contents were linearly ranked („more is better”) using the formulae y =x/xmax where xmax is the 169
maximum value in the database.
170 171
3. Results 172
3.1. Bivariate correlations between soil quality indicators 173
The descriptive statistics and the linear correlation matrix of the pedological indicators are shown in 174
Table 4 and Table 5, respectively. On the analysed database a strong correlation (r>0.8) was found 175
between pH and the CCE indicators, while the influence of base saturation was clearly observable on 176
both parameters., a significant, but weak (r<0.39) or moderate (r=0.40-0.59) correlation exists among 177
pH, Na and EC since salt accumulation and Na adsorption do not always occur together. In addition, 178
the depth of CaCO3 accumulation zone also indicated a great variability among the studied soils. Only 179
a few Solonchak soils were found in the analysed database and in general, this soil type is rarely 180
cultivated and used as farmland. EC strongly correlated with available Mg and S, therefore, besides 181
Na, Mg and S must also be present among the water-soluble salts. Although Na did not indicate 182
exchangeable sodium percentage (ESP), the physical impact of Na-saturated colloids on water 183
retention and drainage properties of soils is well represented in the texture indicator based on 184
consistency change. A weak but significant linear correlation was observed between Na and soil 185
texture. SOM showed a moderate correlation with texture. In the analyzed dataset, available Mg and 186
Cu indicated a high correlation with texture, while only a weak and moderate correlation was found 187
between available K, N, S and Zn and texture. Consequently, these nutrients are adsorbed most 188
commonly to the mineral colloids of soils. Among the available nutrients, Cu, Mn and P showed the 189
highest but only weak-moderate correlation with soil pH.
190
3.2. Multivariate statistical analyses 191
According to the eigenvalues greater than 1, the PCA yielded four principal components (PCs) 192
explaining a total of 75.658% of the variance for the entire set of variables (Table 6). The 193
commonality of the variables, which expresses the rate of preserved heterogeneity of the given 194
parameter, were larger than 0.588. The particle size distribution and the influenced properties by 195
texture are expressed in PC1 based on the larger loading value of texture, Mg, Cu, EC, SOM, K and 196
Na. PC1 explains 33.55% of the total variance of the input indicators. The second factor accounted 197
for 22.044% of the total variance. PC2 was considered as a specific chemical parameter due to the 198
high loadings of the Mn and CCE and pH indicators. Available P and Zn indicator loading values were 199
the largest in PC3. The variance reached 10.931% in the latter case. The PC4 accounted for 9.134% of 200
the total variance. PC4 was labelled as available nitrogen and sulphur due to the high loadings of the 201
N and S indicators.
202
The linear discriminant analysis was carried out for the WRB classification at the values of PC1, PC2, 203
PC3 and PC4 as independent variables. Our results indicated a prediction accuracy of only 47.5% for 204
the four principal components of the WRB categories. The canonical correlation analyses showed 205
that the first and second discriminant functions (DFs) explain 70.9% and 27.1% variance of the 206
independent variables, respectively, i.e. they almost completely account for the total variance.
207
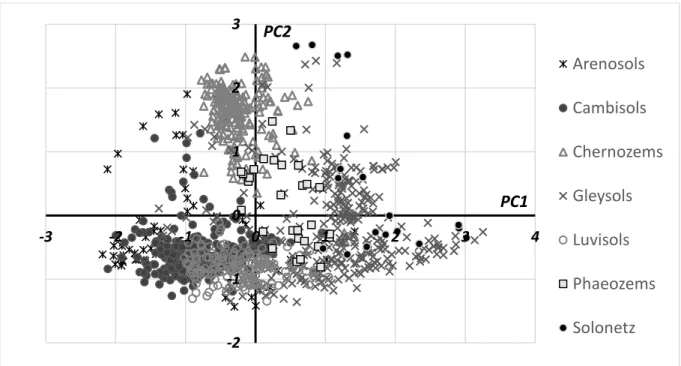
According to the values of the structure matrix, the ranking order of the principal components is PC1 208
(0.709), PC2 (-0.497), PC4 (0.100) and PC3 (0.089) in DF1, whereas PC2 (0.792), PC1 (0.542), PC3 209
(0.354) and PC4 (-0.022) in DF2. Soil types primarily differentiated as a function of PC1 and PC2 210
values indicating the physical and chemical properties of soils (Fig 2). At the same time, the influence 211
of PC3 and PC4 proved to be less important.
212
3.3. Scored indicators 213
The statistics of the scored indicators is shown in Table 7, whereas the mean values according to the 214
soil types are presented in Table 8. The distribution of the obtained y_pH values was skewed left 215
significantly due to the higher frequency of acidic values in the database. The lowest y_pH values are 216
usually found for dystric Gleysols and dystric fluvic Arenosols (No 11, 16, 20, 23). The distribution of 217
interpreted Na and EC variables are markedly skewed to the left. The y_EC value was found relatively 218
low for Solonetz and sodic Gleysols. The mean y_Na value was between 0.28 and 0.67 for the latter 219
soil types (No 21-25).
220
Due to their extremely high spatial variability in terms of texture and location, the studied soils of 221
Hungary showed a relatively high standard deviation of y_texture values. The lowest values were 222
obtained for reductigleyic and clayic Gleysols soils (No 7 and 8) with a mean value of 0.32 to 0.37.
223
The mean y_texture value was between 0.57 and 0.68 for arenic Cambisols és Arenosols (No 17-20).
224
The mean value of y_SOM for the entire database was 0.69 with a normal (Gaussian) distribution.
225
Values of less than 0.6 were typical for some Gleysols and Solonetz soils due to their high clay 226
contents and anaerobic conditions (No 8, 10, 15, 16, 22, 23). Values below 0.6 were also found for 227
Arenosols owing to their low SOM content and loose structure with large pore spaces (No 20). Scored 228
values between 0.6 and 0.7 were common for Phaeozems, Cambisols and Luvisols formed under 229
dense forest canopies, where soils are characterized by reduced organic matter and humus 230
accumulation. Unsurprisingly, the highest y_SOM values were found in Chernozem soils (No 1 and 3).
231
Among the interpreted parameters, the y_N and y_S parameters have the largest variance, and 232
unlike the other factors, they are skewed to the right and consequently their mean scored values are 233
extremely low (0.13 and 0.08). The highest scored values of y_S were characteristic for the saline and 234
sodic soils (No 22 and 23), thus this parameter indicates the accumulation of water-soluble salts.
235
Compared with other nutrients, the mean of the scored values of y_P (0.56) is the lowest in the 236
entire database, indicating lowered and depleted phosphorous availability (and lowered release 237
rates) in the studied soils. The phosphorus imbalance and deficiency (low dissolution and 238
mineralization rates) in the soil may have been caused by insufficient fertilization practices or 239
extreme pH conditions.
240
Based on the y_K and y_Mg values, potassium imbalance and deficiency likely occurs in the studied 241
soils, as low potassium availability and concentration may be observed in many different soil types 242
(e.g. No 5, 6, 11, 16, 20). The magnesium-supplying and releasing capacity of the analysed soils is 243
generally high, with a mean scored value of y_Mg (0.98) and a standard deviation of 0.058. The 244
lowest y_Mg values were found for Arenosols due to the highest ratio of nutrient loss by leaching, 245
low surface charge density and the reduced specific surface area of colloids.
246
The average values and the standard deviation values of y_Mn were similar to the corresponding 247
parameters of magnesium. Lower values were commonly found a reducigleyic dystric Gleysols and 248
acidic soils of sandy textures (No 7, 18, 20). Based on the values of the interpreted variables, we 249
learned that the Cu-supplying capacity of the studied soils is generally good, with scored values less 250
than y_Cu <0.8 only found in a very few soil samples. In accord with phosphorous, low Zn-supplying 251
capacity characterizes each analysed soil type, and y_Zn ranged widely between 0.144 and 1.000 252
with a mean value of 0.64.
253 254
4. Discussion 255
4.1. Indicators used for soil quality indices 256
To estimate the impact of soil chemical properties on nutrient cycle as well as water and nutrient 257
uptake, most authors studied pH-H2O (occasionally pH-CaCl2), electrical conductivity, cation exchange 258
capacity (CEC) and exchangeable cations (Zhang et al., 2004; Qi et al., 2009; Masto et al., 2015).
259
Under arid climates, exchangeable sodium percentage (ESP), sodium adsorption ration (SAR) and 260
calcium carbonate equivalent (CCE) complete the list of analysed parameters. Nevertheless, due to 261
the correlation of the above-listed parameters, only one or two indicators have been selected and 262
used in the development of soil quality indices. From the results of multivariate statistical analyses, it 263
is claimed that under typical soil conditions in Hungary, pH, CCE, EC and AL-soluble Na were found to 264
be suitable indicators of soil quality.
265
Among the indicators that characterize the physical properties of soils, available water retention 266
capacity, bulk density, aggregate size distribution and stability (especially the mean weight diameter) 267
and the particle size distribution (clay, silt and sand percentage) have been extensively studied by 268
former studies (Ghaemi et al., 2014; Rabbi et al., 2014; Göndöcs et al., 2015; Raiesi, 2017). In our 269
assessments, due to its impact on soil water and air dynamics, soil texture, as a physical parameter, 270
was preferably implemented during the elaboration of the evaluation algorithm. Under the drought- 271
prone climatic conditions of Hungary, water retention capacity of soils profoundly influences the 272
yield of dryland crops (Farkas et al., 2005; Tóth et al., 2007).
273
The organic matter dynamics of soils influences both their nutrient cycle rate and the functional 274
activity of soil biota (Greiner et al., 2017; Fekete et al., 2017). To characterize this ecosystem 275
function, many indicators have been applied. Among them, soil organic matter, carbon content 276
(SOM/SOC or TC) have been used the most commonly (Yao et al., 2014; Nakajima et al. 2015; Biswas 277
et al. 2017; Nabiollahi et al. 2017). Biological indicators allow the detection of the impacts of 278
management practices and different crops as they are not limited to specific influences (e.g. Karlen 279
et al., 1997; Lima et al., 2012; Zobeck et al., 2014; Raiesi and Kabiri 2016).
280
Chemical and physical properties also impact soil organisms and consequently, biological indicators 281
would be distinct indicators for the identification of soils in this study (Matics and Biro, 2015; Dudás 282
et al. 2017). Nevertheless, we did not employ this approach as a comprehensive database on the 283
biological activity of soils is not available in Hungary. Furthermore, our database was based on the 284
farmlands of similar cultivation and land use management practices and our primary goal was to 285
interpret the most basic physical and chemical parameters. After validation, it would be the 286
incorporation of biological parameters into the evaluation would considerably improve assessment 287
accuracy.
288
Comparison of available and soluble nutrient contents, measured with different extracting solutions, 289
is often difficult, as their comparison and data usability are influenced by the physical and chemical 290
properties of the studied soils. For the determination of available phosphorous, the most commonly 291
used extraction solution is the 0.5 M NaHCO2 (pH 8.5) (Armenise et al., 2013; Li et al., 2013). In 292
contrast, in Hungary the acidic ammonium lactate (pH 3.7) method is used, which dissolves the less 293
available Ca- and Mg-phosphates of alkaline soils (Buzás et al., 1979; Ivezic et al., 2015). Therefore, it 294
is indispensable to include the chemical properties of soils in the evaluation algorithms. Some 295
authors used ammonium-acetate-soluble potassium content (Sharma et al. 2014; Singh et al. 2014;
296
Yao et al. 2014), which is more in line with the latest Hungarian datasets. Available magnesium is 297
rarely analysed in soil quality studies and is only interpreted by a few authors (Saglam et al., 2015;
298
Sharma et al., 2014). DTPH-extractable Fe, Mn, Cu and Zn were interpreted by some authors (Lima et 299
al., 2012; Ramachandran et al., 2016; Biswas et al., 2017). In Hungary, available sulphur and 300
magnesium were determined with 1 M KCl solution and metallic micronutrients were measured 301
using EDTA +1 M KCl extraction (Buzás et al., 1979). This extraction method enables only a limited 302
comparison with similar parameters published in the international literature.
303
4.2. Multivariate statistical methods for selecting and weighting soil quality indicators 304
Based on the literature review, it can be stated that the selection of MDS indicators is automated 305
using principal component analysis (PCA) (Zobeck et al., Nakajima et al., 2015; de Paul Obade and Lal, 306
2016; Nabiollahi et al., 2017). PCA generates the linear combination of input parameters, namely 307
principal components (PCs) that do not intercorrelate. By using PCA results (eigenvalues of PCs and 308
loadings), indicators, characterized by low intercorrelation, can be selected, in our case, these are the 309
texture, K, Na, CCE, Mn, P, Zn, N and S (Table 6). These indicators explain the majority of TDS 310
variance and the results of the PCA are also used to weight the indicators for calculation the soil 311
quality indices (Andrews et al., 2004). Nevertheless, the question may arise whether the variables of 312
the highest variance are at the same time the most important? Following our variance analyses of 313
the parameterized and non-linear interpretation of the indicators, in terms of their agricultural land 314
suitability, we may ponder whether the MDS variables should be selected before or after the scoring.
315
In our opinion, the complex interpretation of the principal components (PCs) is more vital regarding 316
their information source on the latent relationship among the individual indicators, including soil 317
forming processes and the impacts of land use (Juhos et al., 2015; Raiesi and Kabiri, 2016; Vinhal- 318
Freitas et al., 2017). PC1 specifies the amount of mineral and organic colloids, and consequently, the 319
cation adsorption capacity of the soil. Eventually and indirectly, it identifies the relative maturity level 320
of soils, water and nutrient retention capacity which subsequently determines soil fertility and 321
productivity (Makó et al., 2003; 2007; Rajkai et al., 2015). Indicators that specify the process of 322
salinization and sodification are not separated in the PCA. The PC2 shows that acidity and alkalinity 323
very strongly controlled by the CaCO3 content of the analysed soils (Csathó, 2001). Accumulation of 324
Na-salts is not significantly expressed by pH measured in KCl solution. Mn availability and solubility 325
are also influenced by CaCO3 content, as pronounced negative linear correlation exists between 326
these two parameters (Buzás, 1979). The significant correlation between the available P and Zn 327
indicators and their segregation in the PC3 are explained by multiple factors. Zinc is strongly 328
adsorbed on the surface of clay minerals and has a low concentration in the soil solution. The 329
solubility of various Zn-salts is low and increases with decreasing pH (Fomina et al., 2010). In soils of 330
high phosphate concentration, Zn-phosphates of low solubility are formed, which can be detected by 331
standard extracting solutions. According to PC4, the elements N and S have similar biogeochemical 332
cycles and the concentration of their mineral forms rapidly changes in the soil.
333
According to the significant predictive power of the PC1 and PC2 in discriminant functions, it can be 334
stated that the zonal, climate-determined soil types, like Luvisols and Chernozems, are easily 335
identified based on their chemical properties, while Arenosols and sandy Cambisols are recognized 336
according to their physical (textural) attributes (Makó et al., 2007). Figure 2 reveals the diverse 337
character of Gleysols and the variable depth of CaCO3-rich and natric horizons of Solonetz soils. Our 338
results pointed out the common prediction power of the texture, SOM, K, Mg, Na, Cu, EC, CCE, pH 339
and Mn by soil genetic types and the active soil forming processes.
340
We propose that the pedological indicators can be classified into four major groups. (1) Water 341
balance and salt dynamics indicators that characterize nutrient retention and cation exchange 342
capacity of soils: texture, SOM, EC and Na. (2) Nutrients, relatively independent from and 343
management practices and associated with and adsorbed on the surface of soil colloids and clay 344
minerals: K, Mg, Cu (3) Indicators that determine base saturation and available nutrients, where 345
nutrient availability is primarily determined by the base saturation of soils: pH, CCE, Mn (4) Highly 346
variable nutrients and/or nutrients greatly influenced by climate and type of land management.
347
Available nutrient concentrations of N, S, P, Zn, however, are primarily influenced by fertilizer 348
application intensity. Consequently, the critical evaluation of the PCs and indices according to soil 349
types may prove useful in multiple analytical algorithms (Mukherjee and Lal, 2014; de Paul Obade 350
and Lal, 2016; Biswas et al., 2017).
351
4.3. Indicator scoring functions 352
We believe that the individual environmental and soil parameters cannot be evaluated 353
independently. Furthermore, the functions of soils and soil quality are revealed under given 354
conditions and can only be interpreted specifically according to land use type or the exact necessities 355
of the plant grown under the given environmental conditions. In contrast, based on former literature, 356
it is often necessary to use and adapt individually analyzed indicators and scoring functions from 357
other studies conducted under different ecological conditions. The most common indicator scoring 358
functions in the literature are summarized in Table 9.
359
We believe that the linear interpretation of indicator scoring thresholds is based on the linear 360
correlation between the indicators and yield. However, this correlation only proved successful for 361
certain a limited number of soil types, where only one or two soil parameters limit yield and soil 362
productivity (Thuithaisong et al., 2011; de Paul Obade and Lal, 2016; Biswas et al., 2017). In addition, 363
the soil quality-yield relation is not necessarily linear, while other soil parameters explain yield in a 364
given combination (Cox et al., 2003; Ayoubi et al., 2009; Juhos et al., 2015).
365
The scored pH values (y_pH) indicate that the crops favoured the high base saturation in soils and 366
they were less sensitive to acidity than to high alkalinity (Csathó, 2001; Debreczeniné and Németh, 367
2009; Nagy, 2011). Therefore, pH-KCl values of 5.5 to 7.5 were considered non-limiting, which 368
corresponds to the scored values of y = 0.9 to 1.0. Any pH value below 4.5 and above 8.0 were 369
evaluated as strongly limiting values for crop growth, therefore scored values of lower than 0.5 were 370
assigned to them. Many crops are commonly unresponsive to high CaCO3 concentration, therefore 371
CCE was not interpreted separately. CCE is an important indicator in terms of nutrientavailability and 372
solubility, hence it was evaluated and included in the statistical analyses during nutrient dynamics 373
evaluations.
374
The interpreted EC and Na values point out the moderate tolerance of crops against salinity and high 375
sodium contents and the unfavourable impact of adsorbed Na on soil aeration and hydraulic and 376
physical properties (Prettenhoffer, 1969; Szabolcs, 1971). All investigated crops poorly tolerated high 377
salinity and excess concentration of alkaline Na-salts. This property was already partially included in 378
the evaluation of pH. EC values of <0.4 dS m-1 and Na values <75 mg kg-1 were assumed non-limiting 379
for crop growth (where y>0.9), whereas EC higher than 0.8 dS m-1 and Na values exceeding 200 mg 380
kg-1 were assumed critical for crop growth, corresponding to y values of less than 0.5.
381
In terms of the soil physical characterization, our analyses focused on the water retention potentials 382
of soils and soil aeration; i.e. parameters primarily determined by texture and the depths of the 383
capillary fringe zone and the groundwater table (Makó et al., 2003; Farkas et al., 2005; Tóth et al., 384
2007; Tóth et al., 2014; Rajkai et al., 2015). Whereas higher water retention capacities correspond to 385
better moisture availability during periods of drought, rainy periods enhance the development of 386
reductive and anoxic soil conditions. Our mathematical model shows that the highest available water 387
capacity exists for loamy, and clayey loam soils (Várallyay, 2008; Rajkai et al., 2004). Furthermore, the 388
higher the clay content of the soils is the deeper is located the optimal depth of the groundwater 389
table (between 85 and 180 cm) (Géczy, 1968; Lóczy and Dezső, 2013; Lóczy et al. 2017). Our model 390
was poorly applicable for alfalfa due to its preference for deep groundwater table.
391
When interpreting SOM, the biological functions (nitrogen-supply, water retention and soil structure) 392
of organic matter was evaluated (Greiner et al., 2017). Since the mineralization and release of 393
nitrogen is primarily the function of air and water availability and textural properties under the given 394
climate (Fekete et al., 2017), the same SOM content provides better conditions for sandy loam soils 395
than clayey soils (Buzás et al., 1979; Debreczeniné and Németh, 2009). SOM, through its influence on 396
nitrogen-supply, water retention and soil structure, significantly affects yield in Hungary 397
(Debreczeniné and Németh, 2009; Hermann et al., 2014b). Although the relationship is rather 398
complex between yield and SOM, using significant non-linear regression between SOM and yields of 399
winter wheat, maize and alfalfa, saturation functions were given by Csathó (2003a; 2003b; 2003c) for 400
the period of 1960 to 2000 based on long-term fertilizer experiments. Their results and saturation 401
functions are in a good correspondence with the model-based findings of the current study.
402
Our scoring functions indicate the nutrient-response of crops and nutrient availability, as soil fertility 403
is rather determined by nutrient dynamics (mobilization/mineralization-immobilization) and not 404
nutrient concentrations (Kismányoky and Debreczeni, 2001; Debreczeniné and Németh, 2009).
405
The P scoring model illustrates that the same ammonium-lactate-soluble P2O5 content (AL-P) in a 406
moderately acidic soil provides better nutrient supply for crops than is the case of alkaline and 407
calcareous soils (Sarkadi et al., 1987; Hermann et al., 2014a). The models of the available K and Mg 408
indicate that dynamics of these elements (adsorption, desorption and mass flow) is significantly 409
influenced by soil texture and charge density on the surface of clay minerals (Buzás et al., 1979; Stout 410
and Baker, 1981). In other words, identical ammonium-lactate-soluble K2O and 1 M KCl-soluble Mg 411
concentrations represent higher release rates and more readily available nutrient mineralization and 412
mobilization in a sandy soil compared to clayey soil. Non-linear statistical relations between AL- 413
soluble P and K contents and yields are also significant (Csathó 1997; 2003d; 2003e; 2003f).
414
As Mn availability is primarily determined by pH (Buzás et al., 1979; Gupta et al., 2008), this indicator 415
was interpreted by taking into account the pH with a saturation model. Owing to its high adsorption 416
capacity to the surface of clay minerals (Buzás et al., 1979; Gupta et al., 2008), Zn and Cu were 417
interpreted as a function of soil texture. Nonetheless, Zn and Cu availability are also significantly 418
influenced by other factors, including the presence of organic complexes and ion-antagonism 419
mechanisms.
420
The majority of N and S is stored in organic compounds under the moderately arid climate of 421
Hungary and are mineralized (mobilized) by microorganisms if their concentration decreases in soil 422
solution (Tkaczyk et al., 2017). The mineralized N and S content and release rates are primarily 423
influenced by soil water balance (precipitation and evaporation) and moisture regime of soils, 424
therefore the linear interpretation of N and S was found sufficient for the current model („more is 425
better”). However, the question may arise whether the most changeable mineralized N and S 426
variables are adequate for a soil quality index? For almost all soil type, the means of scored N and S 427
values were the lowest but it is highly unlikely that these indicators would be the most important 428
limiting factors. These indicators rather show a momentary state in soils.
429
Our goal was to indicate the relative values of the interpreted indicators and show their impacts on 430
soil properties. However, the simple addition of scores commonly gives a misleading result and 431
contradicts the findings of the former Hungarian land evaluation studies (Géczy, 1969; Debreczeniné 432
et al., 2003; Makó et al., 2007). Since the productivity of the soil is generated by the complex 433
interaction of the simple soil properties, therefore, the combined analysis of indicators is crucial for 434
the assessment of soil quality (Juhos et al., 2015). For example, some unfavourable properties can be 435
compensated by other parameters, but in addition to synergies, antagonisms may also occur.
436
Therefore weighting is usually indispensable.
437 438
5. Conclusions 439
Instead of the separate interpretation of soil indicators, their inter-correlations should be taken into 440
account. Various soil physical and chemical properties must be incorporated as the nutrient 441
availability of the soil is also affected by other soil properties. Soil moisture regime is also a more 442
complex parameter and it is difficult to express using one simple indicator.
443
During the development of a soil quality index, the number of variables should be reduced relying on 444
the outcomes of the multivariate statistical analyses (principal component analysis and discriminant 445
analysis) of the total data base. However, the selection of the minimum dataset should not be 446
exclusively based on these findings. Although individual PCs (PC3 and PC4) have a little impact on soil 447
quality (for a given soil type), still, based on statistical analyses, they could be important indicators 448
for e.g.: another soil type, or more specifically, could significantly impact soil physical and chemical 449
properties from an agricultural viewpoint, like the availability of Zn and P. In the case of the 450
Hungarian indicators and arable lands, we suggest to look at the variance and existing combinations 451
of the interpreted scores and to rank the limiting factors according to the scores for each soil type.
452
In the current paper, however, our major objective was the identification of limiting factors for plant 453
growth on the studied soil types. The most common limiting factors after their non-linear 454
interpretation are texture, depth of groundwater table, SOM, pH, Na, available K, P and Zn which 455
would be a minimum data set for a soil quality assessment. However, soil properties do not influence 456
fertility and soil productivity independently, but rather in a complex and combined manner. When a 457
land suitability index is based on these scores, the simple additive method for integration insufficient.
458
In order to further advance a soil quality assessment model and improve the methodology of soil 459
quality index development, our following goals target the determination the hierarchical ranking and 460
grouping of soil parameters in a combined manner. For the given specific soil types the combination 461
of these limiting factors should be studied and their weights need to be determined.
462 463
Acknowledgement: Supported by the ÚNKP-17-4-I and ÚNKP-18-4 New National Excellence Program 464
of the Ministry of Human Capacities and Bolyai János Research Scholarship of the Hungarian 465
Academy of Sciences (B. Madarász).
466 467
References 468
Andrews, S.S., Karlen, D.L., Cambardella, C.A., 2004. The soil management assessment framework: a 469
quantitative soil quality evaluation method. Soil Sci. Soc. Am. J. 68, 1945–1962.
470
Ángyán, J., Menyhért, Z., Radics, L., Seres, J., Jeney, C., Tánczos, F., Pécsi, M., 1982.
471
Kukoricatermesztési adatok ökológiai csoportosítása faktor- és clusteranalízis segítségével.
472
[Classification of maize yield data by factor and cluster analysis.] Növénytermelés 31(2), 141–153.
473
Armenise, E., Redmile-Gordon, M.A., Stellacci, A.M., Ciccarese, A., Rubino, P., 2013. Developing a soil 474
quality index to compare soil fitness for agricultural use under different managements in the 475
Mediterranean environment. Soil Till. Res. 130, 91–98.
476
Ayoubi, S., Khormali, F., Sahrawat, K.L., 2009. Relationship of barely biomass and grain yields to soil 477
properties within a field in the arid region: Use of factor analysis. Acta. Agric. Scand. Section B-Soil 478
Plant. Sci. 59(2), 107–117.
479
Baja, S., Chapman, D.M., Dragovich, D., 2007. Spatial based compromise programming for multiple 480
criteria decision making in land use planning. Environ. Model. Assess. 12, 171–184.
481
Biswas S, Hazra G.C., Purakayastha T.J., Saha N., Mitran T., Satadeep Singha Roy, Nirmalendu Basak, 482
Biswapati Mandal, 2017. Establishment of critical limits of indicators and indices of soil quality in rice- 483
rice cropping systems under different soil orders. Geoderma 292, 34–48.
484
Busscher, W., Krueger, E., Novak, J., Kurtener, D., 2007. Comparison of soil amendments to decrease 485
high strength in SE USA Coastal Plain soils using fuzzy decision-making analyses. Int. Agrophys. 21, 486
225–231.
487
Buzás, I., (Ed.) 1979. Műtrágyázási irányelvek és üzemi számítási módszer. [Fertilization guidelines 488
and operational calculation method]. I.-II. MÉM Növényvédelmi és Agrokémiai Központ, Budapest 489
Cox, M.S., Gerard, D.P., Wardlaw, M.C., Abshire, M.J., 2003. Variability of selected soil properties and 490
their relationships with soybean yield. Soil Sci. Soc. Am. J. 67, 1296−1302.
491
Csathó, P., 1997. Összefüggés a talaj K-ellátottsága és a kukorica, őszi búza és lucerna K-hatások 492
között a hazai szabadföldi kísérletekben, 1960–1990. [Potassium effects on yields of maize, winter 493
wheat and alfalfa in long-term experiments in Hungary (1960–1990)]. Agrokémia és Talajtan 46, 327–
494
345.
495
Csathó, P., 2001. Összefüggés a talajsavanyúság mértéke és a mészhatások között, a hazai meszezési 496
tartamkísérletek adatbázisán, 1950-2000. II. A kísérleti növények, a mészforma és a meszezés óta 497
eltelt idő szerepe a mészhatások megjelenésében. Szemle. Agrokémia és Talajtan 50, 509–523.
498
Csathó, P., 2003a. Őszi búza N hatásokat befolyásoló tényezők vizsgálata az 1960 és 2000 között 499
publikált hazai szabadföldi kísérletek adatbázisán. [Effects of soil organic matter on yields of winter 500
wheat in long-term experiments in Hungary (1960–2000)]. Növénytermelés 52(1), 41–59.
501
Csathó, P., 2003b. Kukorica N hatásokat befolyásoló tényezők vizsgálata az 1960 és 2000 között 502
publikált hazai szabadföldi kísérletek adatbázisán. [Effects of soil organic matter on yields of maize in 503
long-term experiments in Hungary (1960–2000)]. Agrokémia és Talajtan 52(1-2), 169–184.
504
Csathó, P., 2003c. Lucerna N hatásokat befolyásoló tényezők vizsgálata az 1960 és 2000 között 505
publikált hazai szabadföldi kísérletek adatbázisán. [Effects of soil organic matter on yields of alfalfa in 506
long-term experiments in Hungary (1960–2000)]. Növénytermelés 52(2), 243–253.
507
Csathó, P., 2003d. Őszi búza P-hatásokat befolyásoló tényezők vizsgálata az 1960 és 2000 között 508
publikált hazai szabadföldi kísérletek adatbázisán. [Phosphorus effects on yields of winter wheat in 509
long-term experiments in Hungary (1960–2000)]. Növénytermelés 52(6), 679–701.
510
Csathó, P., 2003e. Kukorica P-hatásokat befolyásoló tényezők vizsgálata az 1960 és 2000 között 511
publikált hazai szabadföldi kísérletek adatbázisán. [Phosphorus effects on yields of maize in long- 512
term experiments in Hungary (1960–2000)]. Agrokémia és Talajtan 52(3-4), 455–472.
513
Csathó, P., 2003f. Lucerna P-hatásokat befolyásoló tényezők vizsgálata az 1960 és 2000 között 514
publikált hazai szabadföldi kísérletek adatbázisán. [Phosphorus effects on yields of alfalfa in long- 515
term experiments in Hungary (1960–2000)]. Növénytermelés 52(1-2), 141–156.
516
Debreczeniné, Kuti, L., Makó, A., Máté, F., Szabóné, K.G., Tóth, G., Várallyay, G., 2003. A D-e-Meter 517
földminősítési viszonyszámok elméleti háttere és információtartalma. [The theoretical background 518
and the information content of the D-e-Merter land quality values.] 23-37. In: Gaál, Z., Máté, F., Tóth, 519
G. (Eds.): Földminősítés és földhasználati információ, Veszprémi Egyetem, Keszthely, 379 p.
520
Debreczeniné, Németh, T., (Eds.) 2009. Az országos műtrágyázási tartamkísérletek (OMTK) kutatási 521
eredményei (1967-2001). [Results of the Hungarian long-term fertilization experiments (1967-2001)]
522
Akadémiai Kiadó, Budapest, 478 p.
523
de Paul Obade, V., Lal, R., 2016. A standardized soil quality index for diverse field conditions. Sci.
524
Total Environ. 541, 424–434.
525
Dudas, A., Kotroczo, Z., Videki, E., Wass-Matics, H., Kocsis, T., Szalai, M.Z., Vegvari, G., Biro, B., 2017.
526
Fruit quality of tomato affected by single and combined bioeffectors in organically system. Pakistan J.
527
Agric. Sci. 54(4), 847–856.
528
Egnér, H., Riehm, H., Domingo, W.R., 1960. Untersuchungen über die chemische Bodenanalyse als 529
Grundlage für die Beurteilung des Nährstoffzustandes derBöden II. Kungliga Lantbrukshögskolans 530
annaler 26.
531
Fábián, Á.P., Matyasovszky, I., 2010. Analysis of climate change in Hungary according to an extended 532
Köppen classification system, 1971-2060. Q. J. Hung. Meteorol. Serv. 114(4), 251–261.
533
FAO, 2014. World Reference Base for Soil Resources. World Soil Resources Reports No. 106. FAO, 534
Rome.
535
Farkas, C., Randriamampianina, R., Majercka, J., 2005. Modelling impacts of different climate change 536
scenarios on soil water regime of a Mollisol. Cereal Res. Comm. 33,185–188.
537
Fekete, I., Lajtha, K., Kotroczó, Z., Várbíró, G., Varga, C., Tóth, J.A., Demeter, I., Veperdi, G., Berki, I., 538
2017. Long-term effects of climate change on carbon storage and tree species composition in a dry 539
deciduous forest. Global Change Biol. 23(8), 3154–3168.
540
Fomina, M., Alexander, I.J., Hiller, S., Gadd, G.M., 2010. Zinc phosphate and pyromorphite 541
solubilization by soil plant-symbiotic fungi. Geomicrobiol. J. 21(5), 351–366.
542
Géczy, G., 1968. Magyarország mezőgazdasági területe. [Agricultural land of Hungary.] Akadémiai 543
Kiadó, Budapest, 307 p.
544
Ghaemi, M., Astaraei, A.R., Emami, H., Nassiri Mahalati, M., Sanaeinejad, S.H., 2014. Determining soil 545
indicators for soil sustainability assessment using principal component analysis of Astan Quds- east of 546
Mashhad- Iran. J. Soil Sci. Plant Nutr. 14(4), 987–1004.
547
Göndöcs, J., Breuer, H., Horváth, Á., Ács, F., Rajkai, K., 2015. Numerical study of the effect of soil 548
texture and land use distributionon the convective precipitation. Hungarian Geographical Bulletin, 549
64(1), 3–15.
550
Greiner, L., Keller, A., Grêt-Regamey, A., Papritz, A. 2017. Soil function assessment: a review of 551
methods for quantifying the contributions of soils to ecosystem services. Land Use Policy, 69, 224–
552
237.
553
Gupta, U.C., Wu, K., Liang, S., 2008. Micronutrients in Soils, Crops, and Livestock. Earth Sci. Front.
554
15(5), 110–125.
555
Hermann, T., Kismányoky, T., Tóth, G., 2014a. A foszfor-ellátottság hatása a kukorica (Zea mays L.) 556
termőképességére mezőségi és barna erdőtalajú termőhelyeken, különböző évjáratokban. [Impact of 557
available phosphorus on the productivity of maize (Zea mays L.) on Chernozems and Hungarian 558
brown forest soil in different years.] Növénytermelés 63(1), 1–18.
559
Hermann, T., Kismányoky, T., Tóth, G., 2014b. A humuszellátottság hatása a kukorica (Zea mays L.) 560
termésére mezőségi és barna erdőtalajú termőhelyeken, különböző évjáratokban. [Impact of organic 561
matter on the productivity of maize (Zea mays L.) on Chernozems and Hungarian brown forest soil in 562
different years.] Növénytermelés 63(2), 1–22.
563
Ivezić, V., Singh, B.R., Gvozdić, V., Lončarić, Z., 2015. Trace metal availability and soil quality index 564
relationships under different land uses. Soil Science Society of America Journal 12.
565
doi:10.2136/sssaj2015.03.0125 566
Jamil, M., Ahmed, R., Sajjad, H., 2017. Land suitability assessment for sugarcane cultivation in Bijnor 567
district, India using geographic information system and fuzzy analytical hierarchy process.
568
GeoJournal, DOI 10.1007/s10708-017-9788-5 569
Juhos, K., Szabó, Sz., Ladányi, M., 2015. Influence of soil properties on crop yield: a multivariate 570
statistical approach. Int. Agrophys. 29, 425–432.
571
Karlen, D.L., Mausbach, M.J., Doran, J.W., Cline, R.G., Harris, R.F., Schuman, G.E., 1997. Soil quality: a 572
concept, definition, and framework for evaluation. Soil Sci. Soc. Am. J. 61, 4–10.
573
Kismányoky, T. and Debreczeni, B., 2001. The optimal nutrition of maize in the Hungarian national 574
long-term field experimental network. Arch. Agron. Soil Sci. 46(3-4), 251–265.
575
Kononova, M.M., 1966. Soil organic matter. Pergamon Press, Oxford. 2nd edition, p. 378.
576
Kurtener, D., Badenko, V., 2000. Precision agriculture experimentation on the base of fuzzy models 577
synthesized with GIS. Asp. Appl. Biol. 61, 139–143.
578
Li, P., Zhang, T., Wangb, X., Yu, D., 2013. Development of biological soil quality indicator system for 579
subtropical China. Soil Till. Res. 126, 112–118.
580
Liebig, M.A., Varvel, G., Doran, J.W., 2001. A simple performance-based index for assessing multiple 581
agroecosystem functions. Agron. J. 336, 313–318.
582
Lima, A.C.R., Brussaard, L., Totola, M.R., Hoogmoed, W.B., de Goede, R.G.M., 2013. Afunctional 583
evaluation of three indicator sets for assessing soil quality. Appl. Soil Ecol. 64, 194–200.
584
Lóczy, D., Dezso, J., 2013. Groundwater flooding hazard in river valleys of hill regions, Hungarian 585
Geographical Bulletin, 62(2), 157–174.
586
Lóczy, D., Dezso, J., Czigány, S., Prokos, H., Tóth, G., 2017. An environmental assessment of water 587
replenishment to a floodplain lake. J. Environ. Manage. 202(2), 337–347.
588
Makó, A., Várallyay, G., Tóth, G., 2003. A földminőség évjáratos változásának talaj vízgazdálkodási 589
tényezői. [The soil water management factors of the yearly change of land quality.] In: Gaál, Z., Máté, 590
F., Tóth, G. (Ed.) Földminősítés és Földhasználati információ, Veszprémi Egyetem, Keszthely, 49–55.
591
Makó, A., Tóth, G., Máté, F., Hermann, T., 2007. Talajtermékenység számítása a változati 592
talajtulajdonságok alapján. [Calculation of land productivity based on soil types.] In: Tóth, T., Tóth, G., 593
Németh, T., Gaál, Z. (Ed.) Földminőség, földértékelés és földhasználati információ, MTA TAKI, 594
Budapest-Keszthely, 39–44.
595
Masto, R.E., Sheik, S., Nehru, G., Selvi, V.A., George, J., Ram, L.C., 2015. Environmental soil quality 596
index and indicators for a coal mining soil. Solid Earth Discuss. 7, 617–638.
597
Matics, H. and Biro, B., 2015. History of soil fertility enhancement with inoculation methods. J.
598
Central Eur. Agric. 16(2), 231–248.
599
MSZ-08-0206-2, 1978. The Analyses of Chemical Soil Properties. Hungarian Standard.
600
MSZ-08-0205, 1978. The Analyses of Physical Soils Properties. Hungarian Standard.
601
MSZ 20135, 1999. The Analyses of Available Nutrient of Soils. Hungarian Standard.
602
Mukherjee, A., Lal, R., 2014. Comparison of Soil Quality Index Using Three Methods. PLoS ONE 9(8), 603
e105981.
604
Nabiollahi K, Taghizadeh-Mehrjardi R., Kerry R., Moradian S., 2017. Assessment of soil quality indices 605
for salt-affected agricultural land in Kurdistan Province, Iran. Ecol. Ind. 83, 482–494.
606
Nagy, J., 2011. The effect of soil pH and precipitation variability during the growing season on maize 607
hybrid grain yield in a 17 year long-term experiment. J. Hydrol. Hydromech. 59(1), 60–67.
608
Nakajima T., Lal, R., Jiang, S., 2015. Soil quality index of a Crosby silt loam in central Ohio. Soil Till.
609
Res. 146, 323–328.
610
Prettenhoffer, I., 1969. Hazai szikesek javítása és hasznosítása (Tiszántúli szikesek). [Improving and 611
utilization of saline and sodic soils of Hungary.] Akadémiai Kiadó, Budapest, Hungary, 366 p.
612
Qi, Y., Darilek, J.L., Huang, B., Zhao, Y., Sun, W., Gu, Z., 2009. Evaluating soil quality indices in an 613
agricultural region of Jiangsu Province, China. Geoderma 149,325–334.
614
Rabbi, S.M.F, Roy, B.R., Miah, M.M., Amin, M.S., Khandakar, T., 2014. Spatial variability of physical 615
soil quality index of an agricultural field. Appl. Environ. Soil Sci. 379012.
616
Rahmanipour, F., Marzaioli, R., Bahrami, H.A., Fereidouni, Z., Bandarabadi, S.R., 2014.Assessment of 617
soil quality indices in agricultural lands of Qazvin Province, Iran. Ecol. Indic. 40, 19–26.
618
Raiesi, F., Kabiri, V., 2016. Identification of soil quality indicators for assessing the effect of different 619
tillage practices through a soil quality index in a semi-arid environment. Ecol. Ind. 71, 198–207.
620
Raiesi, F., 2017. A minimum data set and soil quality index to quantify the effect of land use 621
conversion on soil quality and degradation in native rangelands of upland arid and semiarid regions.
622
Ecol. Ind. 75, 307–320.
623
Rajkai, K., Kabos, S., van Genuchten, M.T.H., 2004. Estimating the water retention curve from soil 624
properties: comparison of linear, nonlinear and concomitant variable methods. Soil Till. Res. 79, 145–
625
152.
626
Rajkai, K., Tóth, B., Barna, G., Hernádi, H., Kocsis, M., Makó, A., 2015. Particle-size and organic matter 627
effects on structure and water retention of soils. Biologia (Bratislava) 70 (11), 1456–1461.
628
Ramachandran, A., Radhapriya, P., Jayakumar, S., Dhanya, P., Geetha, R., 2016. Critical analysis of 629
forest degradation in the Southern Eastern Ghats of India: comparison of satellite imagery and soil 630
quality index. PLoS ONE 11(1), e0147541.
631
Rojas, J.M., Prause, J., Sanzano, G.A., Arce, O.E.A., Sánchez, M.C., 2016. Soil quality indicators 632
selection by mixed models and multivariate techniques in deforested areas for agricultural use in NW 633
of Chaco, Argentina. Soil Till. Res. 155, 250–262.
634
Sağlam, M., Dengiz, O., Saygin, F., 2015. Assessment of horizontal and vertical variabilities of soil 635
quality using multivariate statistics and geostatistical methods. Commun. Soil Sci. Plant Anal. 46, 636
1677–1697.
637
Sarkadi, J., Thamm, F., Pusztai, A., 1987. A talaj P-ellátottságának megítélése a korrigált AL-P 638
segítségével. [Evaluation of the P content of the soil using the corrected AL-P.] Melioráció, Öntözés 639
és Tápanyag-gazdálkodás. Agroinform, Budapest, pp. 66–72.
640
Sharma, K.L., Maruthi Shankar, G.R., Suma Chandrika, D., Kusuma Grace, J., Sharma, SK., Thakur, H.S., 641
Jain, M.P., Sharma, R.A., Ravindra Chary, G., Srinivas, K., Gajbhiye, P., Venkatravamma, K., Lal, M., 642
Satish Kumar, T., Usha Rani, K., Sammi Reddy, K., Shinde, R., Korwar, G.R., Venkateswarlu, B., 2014.
643
Effects of conjunctive use of organic and inorganic sources of nutrients on soil quality indicators and 644
soil quality index in sole maize, maize + soybean, and sole soybean cropping systems in hot semi-arid 645
tropical Vertisol. Commun. Soil Sci. Plant Anal. 45, 2118–2140.
646
Singh, A.K., Bordoloi, L.J., Kumar, M., Hazarika, S., Parmar, B., 2014. Land use impact on soil quality in 647
eastern Himalayan region of India. Environ. Monit. Assess. 186, 2013–2024.
648
Stout, W.L. and Baker, D.E. 1981. Effect of differential adsorption of potassium and magnesium in 649
soils on magnesium uptake by corn. Soil Sci. Soc. Am. J. 45(5), 996–997.
650
Szabolcs, I., (ed.) 1971. European Solonetz soils and their reclamation. Akadémiai Kiadó, Budapest.
651
Teodor, C., Bran, M., Strat, V.A., 2018. The influence of land structure on performance of wheat 652
production. The case of the Romanian counties – Challenging the changes. Econ. Comput. Econ.
653
Cybern. Stud. Res. 52(1), 59–76.
654
Thomazini, A., Mendonça, E.S., Cardoso, I.M., Garbina, M.L., 2015. SOC dynamics and soil quality 655
index of agroforestry systems in the Atlantic rainforest of Brazil. Geoderma Regional 5, 15–24.
656
Thuithaisong, C., Parkpian, P., Shipin, O.V., Shrestha, R.P., Naklang, K., DeLaune, R.D., Jugsujinda, A., 657
2011. Soil-quality indicators for predicting sustainable organic rice production. Comm. Soil Sci. Plant 658
Anal. 42(5), 548–568.
659
Tkaczyk, P., Bednarek, W., Dresler, S., Krzyszczak, J., Baranowski, P., 2017. Relation of mineral 660
nitrogen and sulphate sulphur content in soil to certain soil properties and applied cultivation 661
treatments. Acta Agroph. 24(3), 523–534.
662
Tóth, B., Makó, A., Rajkai, K., 2007. Vízgazdálkodás és termékenység összefüggésének vizsgálata hazai 663
talajtani adatbázisokon. [Examination of the relationship between water management and fertility in 664
Hungarian soil databases.] Talajvédelem. Különszám: Talajtani Vándorgyűlés Sopron, 2006. Aug. 23- 665
25. 262–267.
666
Tóth, B., Makó, A., Tóth, G., 2014. Talajaink víztartó képességének meghatározása talajtérképezési 667
információk alapján – a csernozjom talajok példája. [Determining the water holding capacity of soils 668
based on soil mapping information - an example of Chernozem soil.] Hidrológiai Közlöny 91(1), 69-75.
669
Várallyay, G., 2008. Extreme soil moisture regime as limiting factor of the plant’s water uptake.
670
Cereal Res. Commun. 36, 3–6.
671
Vasu, D., Sing, S.K., Ray, S.K., Duraisam, V.P., Tiwary, P., 2016. Soil quality index (SQI) as a tool to 672
evaluate crop productivity in semi-arid Deccan plateau, India. Geoderma 282, 70–79.
673
Vinhal-Freitas, I.C, Corrêa, G.F., Wendling, B., Bobul’ská, L., Ferreira, A.S., 2017. Soil textural class 674
plays a major role in evaluating the effects of land use on soil quality indicators. Ecol. Ind. 74, 182–
675
190.
676
Yao, R.J., Yang, J.S., Gao, P., Zhang, J.B., Jin, W.H., Yu, S.P., 2014. Soil-quality-index model for 677
assessing the impact of groundwater on soil in an intensively farmed coastal area of China. J. Plant 678
Nutr. Soil Sci. 177, 330–342.
679
Zhang, B., Zhang, Y., Chen, D., White, R.E., Li, Y., 2004. A quantitative evaluation system of soil 680
productivity for intensive agriculture in China. Geoderma 123, 319−331.
681
Zobeck, T.M., Steiner, J.L., Stott, D.E., Duke, S.E., Starks, P.J., Moriasi, D.N., Karlen, D.L., 2014. Soil 682
quality index comparisons using Fort Cobb, Oklahoma, Watershed-Scale Land Management Data. Soil 683
Sci. Soc. Am. J. DOI: 10.2136/sssaj2014.06.0257.
684
*Manuscript (revision changes marked)
Click here to download Manuscript (revision changes marked): Juhos et al_maniscript_corr.docxClick here to view linked References
Figures
Fig 1 The geographical location of the sampling sites.
Figure
Fig 2 The first and second principal components (PCs) of soil orders.
Soil types primarily differentiated as a function of PC1 and PC2 values indicating the amount of mineral and organic colloids, and consequently, the cation adsorption capacity of the soil (PC1) and the acidity and alkalinity (PC2). The results of the discriminant analysis pointed out the common prediction power of the texture, SOM, K, Mg, Na, Cu, EC, CCE, pH and Mn by soil genetic types and the active soil forming processes.
-2 -1 0 1 2 3
-3 -2 -1 0 1 2 3 4