UN CORRECT
ED PRO
OF
1
23 S. I. BIOCHAR
4
5
Potential nitrogen fixation changes under different land uses
6
as influenced by seasons and biochar amendments
7 Agota Horel1&Imre Potyo1&Tibor Szili-Kovacs1&Sandor Molnar1 8
9 Received: 15 June 2018 / Accepted: 10 September 2018 10 #Saudi Society for Geosciences 2018
11 Abstract
12 Soil nutrient dynamics, potential biological nitrogen fixation (BNF) changes, and their relations were studied using four land use 13 types. Further, we investigated BNF changes in the presence of biochar in soils. Soil samples were collected from arable, 14 vineyard, grassland, and forest soils during four seasons, and analyzed for abiotic contents of total nitrogen, NH4+
-N, NO3−- 15 N, ammonium lactate (AL)-soluble K2O, P2O5, and soil organic carbon (SOC) concentrations. Potential N2fixation was 16 measured as ethylene (C2H4) production from acetylene (C2H2) reduction (ARA). The study focused on the changes in ARA 17 when different types of biochars (T600, T650, and T700) were applied to soil samples in different amounts (0, 0.5, 2.5, and 5.0%
18 wt wt−1) under laboratory conditions. We found strong correlations between soil chemical parameters and ARA values, especially 19 in the case of soil pH, total N, SOC, and P2O5contents. In the case of arable soil, the ARA measurements were up to 227 times 20 higher compared to grassland and forest samples. Biochar application affected N2-fixing microbial responses among land use 21 types, most notably decreases in arable lands and forest soils. We found that a high amount of biochar added to the soils can 22 greatly suppress N2-fixing activities. Our results highlight the strong relationship between soil nutrient changes and the intensity 23 of anthropogenic influence.
24 Keywords Arable . BNF . ARA . Forest . Grassland . Vineyard 25
26
Introduction
27 Anthropogenic activities affect soil nutrient dynamics includ- 28 ing nitrogen cycling in agroecosystems. Long-term cultivation 29 and management of a given land use may result in significant 30 alterations in soil nutrient cycles and microbial community 31 compositions Ye et al.2009). Different tillage practices or 32 addition of fertilizers to soils can further modify soil structures 33 and microbial communities that consequently influence soil 34 biochemical processes (Mijangos et al.2006). Land use and 35 plant types in a given area can determine the requirement for 36 additional nutrients that need to be added to the soil for better 37 crop growth and yield (Fageria2001). Loss of plant nutrients
38 can occur in different ways when applied in excess. Nitrogen
39 mostly leaves the soil matrix through hydrological and bio-
40 geochemical processes, e.g., leaching, ammonia volatiliza-
41 tion, or by gaseous loss through nitrification and denitrifica-
42 tion (Reddy et al. 1984). In agricultural croplands, such as
43 winter wheat or grapes, fertilizer application and soil tillage
44 are common practices to ensure high crop yield or better water
45 infiltration (Kanwar et al.1988), while in the case of grassland
46 and forest soils, the anthropogenic impact is less disruptive.
47 Therefore, for a better understanding of the complexity of land
48 use systems on soil nutrient dynamics in a given area, different
49 land uses should be investigated.
50 The fixation of N2is a very important path to enhance the
51 soil nitrogen availability in many ecosystems. When nitrogen
52 is present in soils in limited supply, the rates of BNF can
53 increase. N2-fixing bacteria, called diazotrophs, can convert
54 N2gas to ammonia using nitrogenase enzymes, which provide
55 available nitrogen for plants (Santi et al.2013). N2-fixing bac-
56 teria are responsible for approximately 90 × 1012g biological-
57 ly fixed nitrogen per year in the case of agricultural land, and
58 an additional 50 × 1012g biological nitrogen fix per year for
59 forest and non-agricultural lands, globally (Bezdicek and This article is part of the Topical Collection onImplications of Biochar
Application to Soil Environment under Arid Conditions
* Agota Horel
horel.agota@agrar.mta.hu
1 Institute of Soil Sciences and Agricultural Chemistry, Centre for Agricultural Research, Hungarian Academy of Sciences, Herman O.
St. 15, Budapest 1022, Hungary
UN CORRECT
ED PRO
OF
60 Kennedy1998). N2 fixation is altered by human activities 61 (Vitousek et al.1997) as fertilizer application to cultivated 62 soils can greatly influence the microbial density and diversity 63 of the soil (Maharning et al.2009). Several types of free-living 64 N2-fixing bacteria are present in soils, either anaerobes such as 65 Desulfovibrioand Clostridium spp., or aerobe phototrophs, 66 e.g.Cyanobacteria, or aerobe heterotrophAzotobacterspp.
67 In recent years, soil additives such as biochar are getting 68 extra attention as they might help crop production in agricul- 69 tural fields and also can mitigate negative effects of green- 70 house gases originating from the soils. Recent studies on the 71 effect of biochar application to soils and its rates to fix N2vary 72 in literature. While there are several studies investigating sym- 73 biotic biological N2 fixation (BNF) response to biochar 74 amendment to soils (Rillig et al.2010; Rondon et al.2007), 75 non-symbiotic or free-living N2-fixing bacterial communities’ 76 responses are less studied (Atkinson et al.2010). It has been 77 reported that biochar can increase BNF in agricultural soils 78 such as soils planted with red clover (Mia et al. 2014) or 79 common beans (Rondon et al.2007). Biochar can also in- 80 crease the alkalinity of acidic soils, creating more favorable 81 conditions for N2-fixing bacteria (Rondon et al.2007), though 82 a decrease in BNF rates at high biochar amendments might 83 also occur. Our current knowledge on the direct and indirect 84 effects of biochar application to soils on various nitrogen cy- 85 cling processes, such as N2fixation or nitrogen mineraliza- 86 tion, is still lacking (DeLuca et al.2009); therefore, soil and 87 biochar-specific studies should be conducted prior to soil ad- 88 ditive use, especially in the case of soils sowed with non- 89 legume plants.
90 In this paper, we aimed at assessing nutrient and ARA 91 changes in four land use types (arable, vineyard, forest, and 92 grassland) during different seasons, where the land uses have 93 similar soil structures. Since the intensity of anthropogenic 94 influence on nitrogen cycling processes is still less known 95 with new soil additives being developed to promote agricul- 96 tural productivities, we investigated how different types and 97 amount of biochar addition influence the ARA rates of these 98 land uses. We hypothesized that (i) soil nutrient and ARA 99 changes will differ considerably among land use types and 100 seasons, (ii) disruptions in soil chemical parameters can neg- 101 atively affect potential BNF rates, and (iii) different amounts 102 and types of biochar amendments to soils influence the rates 103 of ARA differently.
104
Materials and methods
105 To address our hypotheses on how anthropogenic activities 106 alter soil biotic and abiotic processes, we performed our ex- 107 periments in two ways. The present study included field trials 108 investigating soil chemical changes with special emphasis on 109 nitrogen fixation potentials over time under different land
110 uses. Later, we supplemented our findings with data retrieved
111 from a laboratory experiment where we could closely monitor
112 microbial response to biochar amendments focusing on
113 changes in ARA, using soil samples collected from the field.
114
Soil sampling, site information, and soil chemical
115
analyses
116 Soil samples (Luvisol, WRB) were collected from (i) a tilled
117 arable soil sowed with winter wheat (46.92649° N, 17.68246°
118 E), (ii) a vineyard (Vitis vinifera; 46.9166° N, 17.68976° E),
119 (iii) a grassland (meadow; 46.91232° N, 17.69754° E), and
120 (iv) a forested area (oak and maple mix; 46.91283° N,
121 17.69723° E). All soil samples were collected from a small
122 agricultural catchment located in Balaton Uplands, Hungary.
123 The four land use types were chosen as they represent differ-
124 ent time scales and levels of human impacts on soils and also
125 characterize large portions of many agricultural lands at a
126 given area. Arable land experiences annual plowing and fre-
127 quent fertilizer and herbicide applications, and crop rotation
128 (e.g., winter wheat, triticale). Vineyards have the same plant
129 every year receiving in-row plowing, with frequent fertilizer
130 applications. Grasslands have only hay harvesting, but no till-
131 age or chemical amendments. Soil from the forest floor re-
132 ceives minimal anthropogenic impact, as no tree cutting was
133 performed nor were any dead trees removed in recent decades.
All samples were taken from the upper 2–12 cm soil layer 134 135 by sample corer at three sampling points per land use evenly
136 distributed along an approximately 15-m-long transect line.
137 Samples were collected 3 months apart in February, May,
138 July, and November, representing all four seasons, respective-
139 ly. All soil samples in vineyards were collected from in-row
140 plowing area. Soil samples were homogenized and analyzed
141 for total nitrogen content, NH4+
-N, NO3−-N, K2O (AL solu- 142 ble), P2O5(AL soluble), soil organic carbon (SOC), electrical
143 conductivity, and pHH2O. NH4+
-N and NO3−-N values were 144 obtained based on KCl extraction and stream distillation tech-
145 nique. SOC contents were measured by wet digestion using
146 the Tyurin method. The total nitrogen was determined using
147 the modified Kjeldahl method (ISO 11261:1995). K2O and
148 P2O5measurements were done using an inductively coupled
149 plasma optical emission spectrometry (Quotation ICP-OES,
150 Ultima 2) after ammonium lactate extraction (AL). Most of
151 these measurements in the present study were chosen as basic
152 indicators to analyze soil chemical changes and nutrient dy-
153 namics, so we could get a more complete picture of carbon
154 and nitrogen cycling at the investigated sites. In addition, we
155 also measured CaCO3contents using Scheibler calcimeter for
156 the arable and vineyard soils. Soil element concentrations are
157 reported as mg kg−1dry weight soil.
158 Particle size distribution was determined using the sieve-
159 pipette method, where arable, vineyard, grass, and forest soil
160 had 10.4 ± 0.84, 12.05 ± 1.32, 22.67 ± 0.81, and 15.86 ±
UN CORRECT
ED PRO
OF
161 0.31% sand content (2–0.05 mm), 44.8 ± 1.14, 36.18 ± 2.70, 162 39.85 ± 2.78, and 54.95 ± 0.53% silt (0.05–0.002 mm), and 163 44.78 ± 0.31, 51.76 ± 2.70, 37.48 ± 2.26, and 29.19 ± 0.30%
164 clay (< 0.002 mm) content, respectively.
165 Biochar types used in the experiment
166 The chemical characteristics of the three types of biochar 167 prepared at three pyrolysis temperatures (T600, T650, and 168 T700) used in the present study are shown in Table1. The 169 three biochar types were manufactured at factories provid- 170 ed with European Biochar Certificates. According to the 171 manufacturers’information, biochar T600 was made from 172 cellulose fibers and grain husks using Pyreg technology at 173 600 °C; biochar T650 was made from woodchips with 174 Pyreg technology at approximately 650 °C; and biochar 175 T700 was made from woodchips using the Schottdorf 176 system at approximately 700 °C. The biochars were ana- 177 lyzed for different nutrient concentrations such as NH4+
- 178 N, NO3−-N, total nitrogen content, P2O5, K2O, and pH 179 using the same standard chemical techniques described 180 for soil samples.
181 Measuring potential N2-fixing bacterial activities
182 using gas chromatography with flame ionization
183 detector
184 Soil samples for all four land use types were analyzed for 185 potential BNF rates calculated from acetylene reduction.
186 The effects of different biochar types and amounts were also 187 investigated on samples collected during spring (May).
188 Potential nitrogen (N2) fixation or BNF was measured as 189 ethylene (C2H4) production from acetylene (C2H2) reduc- 190 tion (ARA) (Welsh et al.1996). From the homogenized soil, 191 10 g dry weight soil was added to triplicate 27-ml serum 192 vials. The different biochar amounts (0, 0.5%, 2.5%, and 193 5.0%) of T600, T650, and T700 were added to the vials 194 prior to the addition of 4 ml of glucose solution (50 g l−1) 195 in distilled water. Control samples had no biochar addition.
196 Vials then were capped and placed in an incubator for 24 h at
197 25 °C to increase the number of heterotrophic nitrogen-
198 fixing bacteria in the soil. All samples but controls received
199 10% (v/v) of C2H2, added to the headspace of the vials, and
200 incubated for an additional hour. Samples without C2H2
201 were used to develop a baseline for occasional ethylene
202 production in the soil samples, with the values deducted
203 from the measured concentrations. After 1 h incubation,
204 the samples were measured for ethylene production.
205 Production of C2H4from the reduction of C2H2as a sub-
206 strate analog of N2was measured using a FISONS 8000 gas
207 chromatograph with flame ionization detector (GC-FID).
208 All rates and fluxes pertaining to nitrogen species are
209 expressed on a nitrogen atom basis.
210 The GC-FID oven temperature was held constant at 80 °C,
211 while the detector temperature was held at 100 °C during
212 measurements. The carrier gas was nitrogen with a constant
213 flow of 30 ml min−1(170 kPa). The GC column Porapak N (80–100 mesh) was 2–3 m in length with 2.1 mm internal 214
215 diameter and 3.2 mm outer diameter. Gas samples (125 μl)
216 were manually injected into the GC. Ethylene standards
217 (10 mg kg−1) were used to quantify measurements and to
218 qualify instrument reliability after being in use for a longer
219 period of time. Ethylene concentration was calculated from
220 the peak area provided by the Clarity software using calibra-
221 tion gas.
222
Statistics
223 The factors of land use types (arable, vineyard, grassland, or
224 forest), biochar types, and amounts (T600, T650, or T700; 0,
225 0.5, 2.5, or 5.0% by weight), as well as their interactions in
226 relation to non-amended soils (0 or control), were analyzed
227 using one- or two-way analysis of variance (ANOVA) follow-
228 ed by a post hoc Tukey HSD test. Residuals were checked for
229 normal distribution and data were transformed (Box-Cox
230 transformation) where necessary. All statistical calculations
231 were performed using the software package R (Version
232 2.15.2). Statistical significance of the data sets was determined
233 atp< 0.05 andp< 0.01.
t1:1 Table 1 Chemical
Q1 characteristics of the three biochar types used in the experiment (n= 3; ± SD) t1:2 Biochar type pH-H2O Al-K2O (mg kg−1) Al-P2O5(mg kg−1) Total N (%) NH4+
-N (mg kg−1) NO3—N (mg kg−1) TOC (%)
t1:3 T600 10.3 ± 0 13,570.3 ± 59.1 5031.1 ± 32.6 1.01 ± 0.1 1.86 ± 0 n. d. 47.3a
t1:4 T650 9.6 ± 0 4407.5 ± 0.9 463.2 ± 2.8 0.84 ± 0.03 1.81 ± 0.07 n. d. 45.7a
t1:5 T700 9.5 ± 0.04 1868.2 ± 50.9 260.4 ± 6.7 0.24 ± 0.01 1.68 ± 0 n. d. 38.8b
T600, T650, and T700 represent biochar pyrolysis temperatures of 600, 650, and 700 °C TOCtotal organic carbon values,n. d.not detectable
aData were based on manufacturers’certificate
bSoil organic carbon (SOC; %)
UN CORRECT
ED PRO
OF
234
Results
235 Changes in soil nutrients over time
236 Soil samples were collected at four seasonally distinguishable 237 periods to investigate the changes in soil nutrients and BNF 238 rates over time (Table2, Fig.1). Analyzing the total nitrogen 239 amount of the four land use types in winter soil samples, 240 arable soil showed significant differences (p< 0.05) compared 241 to forest and grassland soils, while vineyard data showed sig- 242 nificant differences compared to forest (Table2). When inves- 243 tigating spring samples, we also observed significant differ- 244 ences between vineyard’s and grassland’s total N values.
245 These differences however diminished during summer and 246 fall sampling periods, where none of the land use types’total 247 N showed statistically significant differences compared to 248 each other (Table2).
249 Soil samples collected during winter and spring showed 250 significant differences between arable or vineyard soils’ 251 SOC contents compared to grassland or forest soils 252 (p< 0.04), while SOC values of the land use types showed 253 no significant differences in summer or fall samples (p= 254 0.1949 andp= 0.1446, respectively; Table2).
255 Fertilizer addition to agricultural lands is a common prac- 256 tice worldwide to achieve better crop yield; however, it also 257 affects the soils’nitrogen forms. Total N contents were the 258 highest in samples collected in spring for all land use types 259 except in the case of arable soil, where summer samples had 260 the highest amount. We observed a decrease in total N con- 261 centrations during winter in all land use types. However, total 262 N data in arable soil only showed significant changes when
263 comparing winter samples to other seasons (p< 0.04). In the
264 case of grassland, similar results were observed as in the ara-
265 ble land when analyzing samples collected in spring
266 (p< 0.02). In terms of vineyard or forest soils, we did not
267 observe any significant differences in total N concentrations
268 seasonally.
269 The trend in changes of SOC over time was similar to
270 changes in total N, all land use soil samples (but arable)
271 showed a peak in its SOC amount during spring and slowly
272 decreased toward the end of the year, while arable soil had
273 similar SOC among seasons with the highest observed in fall
274 months (Table2). In terms of arable and forest soils, the SOC
275 values did not show significant differences over time
276 (p> 0.05). Vineyard SOC values measured in fall soil samples
277 showed significant differences compared to other seasons,
278 while winter, spring, and summer data had no significant dif-
279 ferences. In the case of grassland, spring soil samples had significantly greater SOC compared to other seasons’ data 280
281 (p< 0.05). Overall, we found significant differences between
282 the four land use types, mainly arable and vineyard compared
283 to grass or forest soils, signifying the connections between
284 human impact and soil nitrogen and carbon stocks.
285 In general, when analyzing NH4+
-N and NO3−-N data, we 286 did not find any statistically significant differences between
287 land use types in any of the sampling periods (Fig.1); how-
288 ever, we observed that NH4+
-N and NO3−-N concentrations 289 were the highest during the spring and summer months.
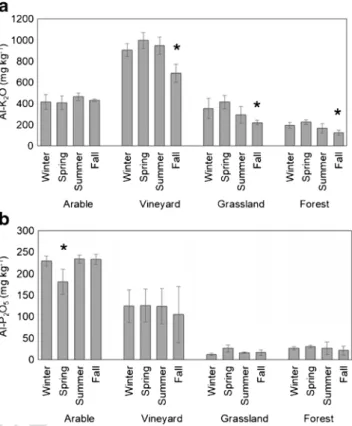
290 Forest soils showed the lowest K2O concentrations (124.51–226.67 mg kg−1) with significant differences com- 291
292 pared to the other land use types (p< 0.027; Fig. 2a).
293 Vineyard samples had the highest K2O concentrations
t2:1 Table 2 Soil chemical characteristics of the four land use types at different sampling periods (n= 3; ± SD)
t2:2 Sampling times Land use types pH(H2O) Total N (%) SOC (%) CaCO3(%) EC (mS cm−1)
t2:3 February Arable 7.98 ± 0.02 0.21 ± 0.04 1.76 ± 0.04 20.63 ± 0.62 0.25 ± 0.01
t2:4 Winter Vineyard 8.01 ± 0.02 0.23 ± 0.02 2.07 ± 0.11 31.92 ± 3.54 0.29 ± 0.02
t2:5 Grassland 6.54 ± 0.16 0.34 ± 0.04 3.08 ± 0.39 0 – 0.3 ± 0.05
t2:6 Forest 6.11 ± 0.37 0.43 ± 0.07 3.86 ± 0.58 0 – 0.2 ± 0.08
t2:7 May Arable 7.9 ± 0.02 0.23 ± 0.01 1.75 ± 0.20 20.04 ± 0.59 0.25 ± 0.02
t2:8 Spring Vineyard 7.89 ± 0.01 0.26 ± 0.01 2.29 ± 0.15 29.8 ± 4.89 0.33 ± 0.01
t2:9 Grassland 6.85 ± 0.15 0.49 ± 0.06 4.24 ± 0.48 0 – 0.48 ± 0.09
t2:10 Forest 5.91 ± 0.49 0.51 ± 0.05 4.62 ± 0.20 0 – 0.27 ± 0.11
t2:11 August Arable 7.85 ± 0.04 0.24 ± 0.01 1.6 ± 0.14 20.35 ± 0.28 0.26 ± 0.01
t2:12 Summer Vineyard 7.8 ± 0.04 0.24 ± 0.02 2.09 ± 0.10 31.52 ± 4.48 0.37 ± 0.02
t2:13 Grassland 6.91 ± 0.17 0.27 ± 0.04 2.14 ± 0.45 0 – 0.31 ± 0.08
t2:14 Forest 5.52 ± 0.12 0.37 ± 0.15 3.56 ± 1.68 0 – 0.15 ± 0.05
t2:15 November Arable 7.78 ± 0.05 0.24 ± 0.01 1.8 ± 0.05 21.09 ± 0.09 0.25 ± 0.01
t2:16 Fall Vineyard 7.87 ± 0.02 0.21 ± 0.02 1.68 ± 0.19 31.46 ± 8.20 0.27 ± 0.01
t2:17 Grassland 6.86 ± 0.20 0.23 ± 0.04 2.06 ± 0.19 0 – 0.24 ± 0.04
t2:18 Forest 5.38 ± 0.14 0.3 ± 0.09 2.86 ± 0.93 0 – 0.09 ± 0.03
UN CORRECT
ED PRO
OF
294 (687.12–997.67 mg kg−1), which also were significantly dif- 295 ferent compared to the other land uses (p< 0.001). In terms of 296 P2O5 contents, arable land showed the highest values 297 (181.33–233.76 mg kg−1), resulting in substantial differences 298 compared to all other land use (p< 0.004), while the lowest 299 (12.24–26.17 mg kg−1) were observed in the case of grass soil 300 (grassland compared to arablep< 0.001, and vineyard p= 301 0.005; Fig.2b), but not in the case of the forest samples.
302 Changes in ARA during different seasons
303 Changes in ARA are shown in Fig.3for the different land use 304 types. Arable soil showed the highest ARA (24.10 nmol C2H4
305 g−1soil h−1) among all land use types in all four seasons, while 306 the lowest amounts were the most noticeable in the case of 307 forest soils (0.11 nmol C2H4g−1soil h−1). Arable and vineyard 308 soils showed similarly high ARA values, and the forest simi- 309 larly low ARA among seasons, while grassland samples 310 showed seasonal effects on ARA. Grassland had the highest 311 N2-fixing potential during summer, and it continuously de- 312 creased in fall, winter, and somewhat in spring.
313 Because of the high ARA values in arable land, we expect- 314 ed to see statistically verified differences as well. After com- 315 paring the data, we found that winter, summer, and fall arable 316 soil samples had significantly higher ARA (p< 0.003,
317 p< 0.014, andp< 0.008, respectively) compared to other land
318 use types, while C2H2reduction of spring arable soil samples
319 differed significantly only in the case of grassland and forest
320 soils (p= 0.031). Seasonal changes did not result in major
321 ARA changes in arable, vineyard, and forest soils. Summer
322 ARA rates in grasslands were significantly different compared
323 to the other seasons (p= 0.047; Fig.3).
324
Relationships between different soil chemical
325
properties and ARA
326 As chemical properties of a specific soil can greatly influence
327 its biological reactions, we explored the connections between
328 soil nitrogen, carbon, phosphor, or pH changes and acetylene
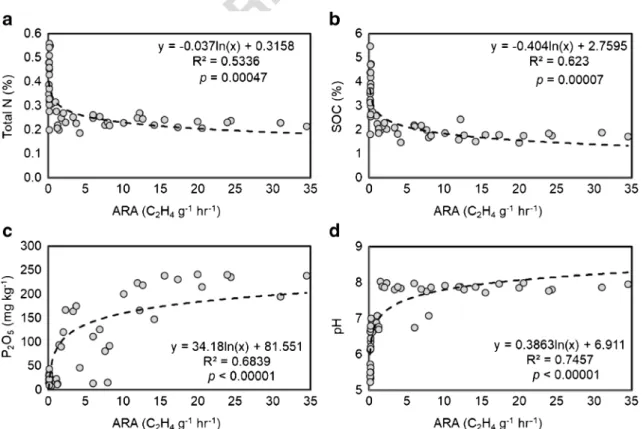
329 reductions (Fig. 4). We found strong correlations between
330 ARA and total N, SOC, soil pH, or P2O5contents (Fig. 4).
331 We did not find strong correlations with ARA values when
332 investigating soil NH4
+-N and NO3−-N concentrations (p= 333 0.26 andp= 0.66, respectively). Our results showed that with
334 increasing soil total N or SOC concentrations, the N2fixation
335 potential decreased. In the case of P2O5data, we found that at
336 low concentrations, the acetylene reductions were low as well,
337 and increasing P2O5contents resulted in increased ARA
338 values. In the case of soil pH, we observed that acidic condi-
339 tions resulted in low ARA, while around pH 8, the ARA were Fig. 1 Soil
Q2 inorganic nitrogen concentration changes in the various land use types.aNH4+-N.bNO3−-N. Nutrient concentrations are on a dry soil mass basis (n= 3; ± SD). Statistically significant differences are indicated by different letters within land use types. n.s. not significant
Fig. 2 Soil inorganic nutrient concentration changes in the various land use types.aK2O.bP2O5. Nutrient concentrations are on a dry soil mass basis (n= 3; ± SD). * represents significance level ofp< 0.05 within land use types
UN CORRECT
ED PRO
OF
340 no longer inhibited and the values were influenced by other 341 soil parameters (Fig.4d).
342 Effects of biochar application on soil N2-fixing
343 potentials
344 Biochar application affected N2-fixing microbial activities dif- 345 ferently among land use types. The type of the biochar used in 346 the experiment was also an important factor in the changes 347 observed in ARA. Based on data retrieved from spring soil 348 samples, we observed the highest ARA in the case of arable
349 land with up to 18.42 ± 11.1 nmol C2H4g h followed by
350 vineyard soils, where soil amendment frequently includes the
351 use of fertilizer (Fig.5a, b). In the case of grassland and forest
352 soils, the ARA values were considerably lower compared to
353 arable or vineyard soils, ranging between 0.15 and 0.25 nmol
354 C2H4g−1h−1(forest 5.0% T700 and grassland 0.5% T700,
355 respectively; Fig.5c, d).
356 When examining the type of biochars used in the exper-
357 iment, we found that T600 addition to soils provided
358 higher BNF rates in most cases compared to the other
359 two types of biochars (Fig. 5). Ethylene production from
360 soils amended with T650 or T700 biochars showed very
361 similar microbial responses (Fig.5), showing that different
362 biochars can extensively influence microbial activities.
363 Comparing to control, we also found significant difference
364 in ARA for the arable soil compared to the T650- or T700-
365 amended soils (p< 0.001), except for 0.5% T650 vineyard
366 (p= 0.0511) and 5.0% T700 vineyard soils (p= 0.0594).
367 T600-amended samples showed a slight increase in N2fix-
368 ation rates in arable soils compared to control treatments;
369 however, significant differences were mainly observed in
370 the 0.5% T600-amended arable soils compared to the other
371 treatments. Although these differences were significant, it
372 is also worth noting that allpvalues were above 0.0485.
373 When investigating samples with the lowest amount of
374 biochar application (0.5%) among the different types of bio-
375 chars, we only observed significant differences between
Fig. 4 Relationships between soil chemical properties ofatotal N,bSOC,cP2O5,dpH, and acetylene reduction activity (ARA) measured for the different land uses.n= 48
Fig. 3 Acetylene reduction activity (ARA) of soil samples of the varying land use types collected during different seasons, based on C2H4
production rate. * represents significance level ofp< 0.05 within land use types;n= 3, ± SD
UN CORRECT
ED PRO
OF
376 T600-amended arable soil, mostly grassland, and forest soils 377 (p< 0.02; Fig.5), while all other low biochar amounts did not 378 result in significant differences in ARA values. When 2.5%
379 biochar was added to the soil samples, all ARA reduced to a 380 level, where substantial changes within land use types and 381 biochar types (p= 0.057) could not be observed. The 5.0%
382 biochar addition resulted in a major decrease in ARA for all 383 soils regardless of land use types (p= 0.028).
384
Discussion
385 In the present study, potential BNF rates, as analog to acety- 386 lene reduction activities, showed a substantial increase in its 387 values during summer and fall compared to winter or spring.
388 This increase was the most noticeable in the grassland soil 389 samples. The increase in BNF rates could be related to elevat- 390 ed temperatures during summer and fall seasons, as one of the 391 major differences between sampling sites was the seasonal 392 temperature shift. Although biological N2fixing has shown 393 significant changes with varying temperature and soil mois- 394 ture (Belnap2003; Horel et al.2014), in the present study, the 395 other sampling sites’BNF rates were less pronounced when 396 considering temperature differences only. Our finding sug- 397 gests the diversity of microbial communities and/or densities 398 among sites rather than climatic factors. Many agricultural 399 sites during hot summer with low soil moisture and cold win- 400 ter temperatures can result in suppressed nitrogenase and met- 401 abolic activities of the microbial communities, leading to low 402 N2fixation values (Belnap2003). In the present study, winter 403 temperatures were unusually high for the area with below 404 average precipitation amount. However, during summer and 405 fall months, several rain events took place, which could cause 406 the increase in microbial density, hence resulting in higher 407 BNF potentials. Soil moisture differences can influence mi- 408 crobial responses to available carbon source at a given area, 409 which further can be influenced by different vegetation suc- 410 cession stages (Surda et al.2015). Leaf interception, especial- 411 ly in the case of forest, can significantly reduce the throughfall 412 amount, which in summer months can result in significantly 413 lowered soil moisture contents. In the present study, summer 414 soil moisture contents of forest soil were 55.9% less than 415 when compared to spring samples; however, the N2fixation 416 potentials were not affected by these differences among 417 seasons.
418 Chemical characteristics of the investigated soil can further 419 influence BNF rates. pH ranges of soils can affect N2-fixing 420 rates, as very acidic conditions can inhibit nitrogenase activi- 421 ties (Limmer and Drake1996), while at close to neutral 422 values, the N2fixation is known to be optimal (Roper and 423 Smith1991). This statement is further supported by our find- 424 ings. Forest and grassland soils had pH below 7, and vineyard 425 and arable around pH 7.9, explaining some of the observed
426 ARA differences between land use types. Fertilizer addition to
427 soils also has a major role in soil microbial activities. Cusack Fig. 5 Effects of the different biochar applications on acetylene reduction activity (ARA) values ofaarable,bvineyard,cgrassland, anddforest soils, based on C2H4production rate. * and ** represent within land use type significance level ofp< 0.05 andp< 0.01, respectively;n= 3, ± SD
UN CORRECT
ED PRO
OF
428 et al. (2009) found that fertilizer application can negatively 429 influence BNF rates in tropical forest soils. Even though in 430 the present study forest soils did not receive any fertilizer 431 treatments, our investigated forest soils also showed some 432 minor increases in ARA during spring and summer. Soil nu- 433 trient levels can also influence BNF rates. Mineral nitrogen 434 can inhibit BNF, due to diversion of photosynthates to assim- 435 ilate nitrates (Mulongoy1995). The amount of nitrate present 436 in soil can affect N2fixation. While a low amount of nitrate 437 delays N2O reduction to N2via BNF, a high amount of nitrates 438 can suppress or even inhibit BNF process (Blackmer and 439 Bremner1978). In the present study, significant difference in 440 NO3− measurements between seasons was observed only in 441 the case of spring samples, while between land uses, the con- 442 centrations were relatively similar (Fig.1b). When we inves- 443 tigated nitrate concentration and the BNF rates between sea- 444 sons or land uses, no connections could be observed.
445 Therefore, in our study, the amount of nitrate present in the 446 soil was not a major controlling factor in BNF changes.
447 Phosphorous deficiency in soil can decrease N2fixation along 448 with causing reduction in nodulation and plant growth 449 (Mulongoy1995). Our findings further support this statement.
450 Soil P2O5concentrations below 50 mg kg−1inhibited, while 451 above 150 mg kg−1enabled N2fixation (Fig.4c).
452 Soil amendments such as activated carbon or biochar can 453 also influence the availability of certain nutrients and soil 454 moisture for plants and bacteria to use (Schiewer and Horel 455 2017; Thies and Rillig2009). Biochars are generally lacking 456 in inorganic nitrogen, which can enhance diazotrophs for col- 457 onization on the biochars’large surface area (Atkinson et al.
458 2010), consequently affecting the chemical and physical char- 459 acteristics of the soil (Gaskin et al.2010; Horel et al.2018;
460 Ouyang et al.2013). With soil amendments, the oxygen levels 461 can shift within the soil matrices, further influencing nitroge- 462 nase enzyme activities (Halbleib and Ludden2000). Uzoma 463 et al. (2011) investigated corn grain nutrient concentration 464 changes as influenced by the different amounts of biochar 465 addition to soils, and found inconsistent data, as total 466 nitrogen decreased with low biochar addition and increased 467 back to similar to control levels with higher biochar amount.
468 Gaskin et al. (2010) observed only marginally increased yield 469 in the case of corn when the effect of different plant-based 470 biochars was investigated, finding additional amendments 471 such as fertilizer to the soil necessary. Similar outcomes were 472 perceived by Steiner et al. (2007), where the application of 473 fertilizer and compost along with biochar resulted in 474 substantial increase in yield, but biochar alone did not.
475 Therefore, alongside biochar, fertilizer addition is also 476 expected in agricultural lands to achieve better crop yield.
477 This can influence soil BNF rates and overall plant growth 478 and health on various scales depending on the type and 479 amount of biochar, and the parameters and locations of the 480 soil matrices receiving the supplements. Quilliam et al.
481 (2013) investigated clover root nodules and N2fixation rates
482 after 3 years of biochar application to temperate agricultural
483 soils and found no influence of biochars as nodules had sim-
484 ilar numbers and sizes, but the authors found increased nitro-
485 genase activities. BNF rates are very high in legume plants,
486 such as soybeans or peas (Masson-Boivin et al. 2009), and lower in non-symbiotic plant microbial connections with 3– 487
488 3 0 6 k g N h a−1 y e a r−1 v e r s u s a p p r o x i m a t e l y
489 5 kg N ha−1year−1, respectively (Atkinson et al. 2010). In
490 agricultural lands where crop rotation and/or fertilization oc-
491 curs frequently, the symbiotic N2-fixing plant microbial con-
492 nections are more likely, helping atmospheric N2-fixing pro-
493 cesses further. In the present study, however, increases in
494 ARA due to symbiotic BNF rates were unlikely to occur as
495 no legume plants were present in any of the sampled sites. In
496 our data, the differences in N2-fixing potentials among the
497 four land use types with or without biochar amendment signi-
498 fy the importance of free-living BNF in the nitrogen cycling
499 processes. In our experiment, we used exactly the same
500 amount of soil in all experimental setup while varying the
501 biochar amounts; consequently, the originally present micro-
502 bial amount could also be similar in all cases. When soils with
503 high amount of biochar addition were investigated, the sudden
504 decrease in N2fixation rates, especially in the case of arable
505 soils, indicates potential negative effects of excess biochar
506 application on N2-fixing microbial activities.
507 In general, our results showed that in natural environmental
508 conditions, acetylene reduction and consequently N2fixation
509 rates vary significantly among different land use types and
510 cultivation systems. These rates might be influenced by bio-
511 char application where microbial activities in non-legume-
512 planted soils can be suppressed to the point that biological
513 N2fixation might be reduced to a nominal level. These find-
514 ings confirm the necessity for long-term studies investigating
515 the effects of soil alterations on soil nutrient dynamics and
516 nitrogen cycling processes.
Conclusions
517518 Agriculturally more active areas such as tilled arable lands or
519 vineyards can receive annual soil enhancers such as fertilizer
520 or biochar additions, which can cause a disruption in its bio-
521 chemical processes. Our study highlights that soil biological
522 and chemical differences can be developed over time between
523 land use types due to human interferences such as tillage,
524 fertilizer addition, and crop rotation, as we found in the case
525 of total N and SOC contents with higher values in the case of
526 forest and grassland compared to arable or vineyard soils.
527 Seasonal changes in environmental conditions can influence
528 soil chemical changes, especially differences in nutrient con-
529 centrations in spring samples within land use types (e.g.,
530 NO3−-N for all land uses or NH4+
-N in the case of forest and
UN CORRECT
ED PRO
OF
531 grassland). Among land uses, we found that total N and SOC 532 values can increase considerably during winter and spring for 533 forest and grassland soils, mostly as a result of litter decom- 534 position. In agreement with soil chemical changes, we also 535 observed the influence of human impact on soil microbial 536 communities, especially on ARA potentials. We found that 537 the more interference occurred at a given land use site, the 538 higher the potential BNF rates were (arable > vineyard >
539 grassland > forest soils). The present study demonstrates that 540 the smaller amount of biochar addition can increase, while the 541 higher biochar amendments can inhibit BNF rates. However, 542 the type of the biochar is also an important factor in the ARA 543 rates, as we found the most positive impacts in biochar amend- 544 ments prepared at the lowest pyrolysis temperature. Overall, 545 our study emphasizes that careful planning and analyses 546 should be implemented prior to soil enhancer additions to 547 lands.
548 Funding informationThis material is based upon work supported by the 549 Hungarian National Research Fund (OTKA/NKFI) project OTKA PD- 550 116157. This paper was also supported by the János Bolyai Research 551 Scholarship of the Hungarian Academy of Sciences.
552
References
553 Atkinson CJ, Fitzgerald JD, Hipps NA (2010) Potential mechanisms for 554 achieving agricultural benefits from biochar application to temperate 555 soils: a review. Plant Soil 337:1–18.https://doi.org/10.1007/s11104-
556 010-0464-5
557 Belnap J (2003) The world at your feet: desert biological soil crusts. Front 558 Ecol Environ 1:181–189. https://doi.org/10.1890/1540- 559 9295(2003)001[0181:TWAYFD]2.0.CO;2
560 Bezdicek DF, Kennedy AC (1998) Microorganisms in action. Blackwell 561 Scientific Publications, Oxford
562 Blackmer AM, Bremner JM (1978) Inhibitory effect of nitrate on reduc- 563 tion of N2O to N2by soil microorganisms. Soil Biol Biochem 10:
564 187–191.https://doi.org/10.1016/0038-0717(78)90095-0
565 Cusack DF, Silver W, McDowell WH (2009) Biological nitrogen fixation 566 in two tropical forests: ecosystem-level patterns and effects of nitro- 567 gen fertilization. Ecosystems 12:1299–1315.https://doi.org/10.
568 1007/s10021-009-9290-0
569 DeLuca TH, MacKenzie MD, Gundale MJ (2009) Biochar effects on soil 570 nutrient transformations. In: Lehmann J, Joseph S (eds) Biochar for 571 environmental management: science and technology. Earthscan, 572 London, pp 251–270
573 Fageria VD (2001) Nutrient interactions in crop plants. J Plant Nutr 24:
574 1269–1290.https://doi.org/10.1081/PLN-100106981
575 Gaskin JW, Speir RA, Harris K, Das KC, Lee RD, Morris LA, Fisher DS 576 (2010) Effect of peanut hull and pine chip biochar on soil nutrients, 577 corn nutrient status, and yield. Agron J 102:623–633.https://doi.org/
578 10.2134/agronj2009.0083
579 Halbleib CM, Ludden PW (2000) Regulation of biological nitrogen fix- 580 ation. J Nutr 130:1081–1084
581 Horel A, Bernard R, Mortazavi B (2014) Impact of crude oil exposure on 582 nitrogen cycling in a previously impactedJuncus roemerianussalt 583 marsh in the northern Gulf of Mexico. Environ Sci Pollut Res 21:
584 6982–6993.https://doi.org/10.1007/s11356-014-2599-z
585 Horel Á, Tóth E, Gelybó G, DencsőM, Potyó I (2018) Soil CO2and N2O 586 emission drivers in a vineyard (Vitis vinifera) under different soil
587 management systems and amendments. Sustainability 10:1811.
588 https://doi.org/10.3390/su10061811
589 Kanwar RS, Baker JL, Baker DG (1988) Tillage and split N-fertilization
590 effects on subsurface drainage water quality and crop yields.
591 Transactions of the ASAE 31:0453–0461.https://doi.org/10.
592 13031/2013.30730
593 Limmer C, Drake HL (1996) Non-symbiotic N2-fixation in acidic and
594 pH-neutral forest soils: aerobic and anaerobic differentials. Soil Biol
595 Biochem 28:177–183. https://doi.org/10.1016/0038-0717(95)
596 00118-2
597 Maharning AR, Mills AAS, Adl SM (2009) Soil community changes
598 during secondary succession to naturalized grasslands. Appl Soil
599 Ecol 41:137–147.https://doi.org/10.1016/j.apsoil.2008.11.003
600 Masson-Boivin C, Giraud E, Perret X, Batut J (2009) Establishing
601 nitrogen-fixing symbiosis with legumes: how many rhizobium rec-
602 ipes? Trends Microbiol 17:458–466.https://doi.org/10.1016/j.tim.
603 2009.07.004
604 Mia S, van Groenigen JW, van de Voorde TFJ, Orama NJ, Bezemer TM,
605 Mommer L, Jeffery S (2014) Biochar application rate affects bio-
606 logical nitrogen fixation in red clover conditional on potassium
607 availability. Agric Ecosyst Environ 191:83–91.https://doi.org/10.
608 1016/j.agee.2014.03.011
609 Mijangos I, Pérez R, Albizu I, Garbisu C (2006) Effects of fertilization
610 and tillage on soil biological parameters. Enzym Microb Technol 40:
611 100–106.https://doi.org/10.1016/j.enzmictec.2005.10.043
612 Mulongoy K (1995) Technical paper 2: biological nitrogen fixation. In:
613 Tripathl BR, Psychas PJ (eds) Source book for alley farming
614
research Q3
615 Ouyang L, Wang F, Tang J, Yu L, Zhang R (2013) Effects of biochar
616 amendment on soil aggregates and hydraulic properties. J Soil Sci
617 Plant Nutr 13:991–1002
618 Quilliam RS, DeLuca TH, Jones DL (2013) Biochar application reduces
619 nodulation but increases nitrogenase activity in clover. Plant Soil
620 366:83–92.https://doi.org/10.1007/s11104-012-1411-4
621 Reddy KR, Patrick WH, Broadbent FE (1984) Nitrogen transformations
622 and loss in flooded soils and sediments. CRC Crit Rev Environ
623 Control 13:273–309.https://doi.org/10.1080/10643388409381709
624 Rillig MC, Wagner M, Salem M, Antunes PM, George C, Ramke H-G,
625 Titirici M-M, Antonietti M (2010) Material derived from hydrother-
626 mal carbonization: effects on plant growth and arbuscular mycorrhi-
627 za. Appl Soil Ecol 45:238–242. https://doi.org/10.1016/j.apsoil.
628 2010.04.011
629 Rondon MA, Lehmann J, Ramírez J, Hurtado M (2007) Biological nitro-
630 gen fixation by common beans (Phaseolus vulgaris L.) increases
631 with bio-char additions. Biol Fertil Soils 43:699–708.https://doi.
632 org/10.1007/s00374-006-0152-z
633 Roper MM, Smith NA (1991) Straw decomposition and nitrogenase ac-
634 tivity (C2H2reduction) by free-living microorganisms from soil:
635 effects of pH and clay content. Soil Biol Biochem 23:275–283.
636 https://doi.org/10.1016/0038-0717(91)90064-Q
637 Santi C, Bogusz D, Franche C (2013) Biological nitrogen fixation in non-
638 legume plants. Ann Bot 111:743–767.https://doi.org/10.1093/aob/
639 mct048
640 Schiewer S, Horel A (2017) Biodiesel addition influences biodegradation
641 rates of fresh and artificially weathered diesel fuel in Alaskan sand. J
642 Cold Reg Eng 31:04017012.https://doi.org/10.1061/(ASCE)CR.
643 1943-5495.0000138
644 Steiner C, Teixeira WG, Lehmann J, Nehls T, de Macêdo JLV, Blum
645 WEH, Zech W (2007) Long term effects of manure, charcoal and
646 mineral fertilization on crop production and fertility on a highly
647 weathered Central Amazonian upland soil. Plant Soil 291:275–
648 290.https://doi.org/10.1007/s11104-007-9193-9
649 Surda P, Lichner L, Nagy V, Kollar J, Iovino M, Horel A (2015) Effects of
650 vegetation at different succession stages on soil properties and water
651 flow in sandy soil. Biologia 70:1474–1479.https://doi.org/10.1515/
652 biolog-2015-0172
UN CORRECT
ED PRO
OF
653 Thies JE, Rillig M (2009) Characteristics of biochar: biological proper- 654 ties. In: Lehmann J, Joseph S (eds) Biochar for environmental man- 655 agement: science and technology. Earthscan, London, pp 85–105 656 Uzoma KC, Inoue M, Andry H, Fujimaki H, Zahoor A, Nishihara E 657 (2011) Effect of cow manure biochar on maize productivity under 658 sandy soil condition. Soil Use Manag 27:205–212.https://doi.org/
659 10.1111/j.1475-2743.2011.00340.x
660 Vitousek PM, Aber JD, Howarth RW, Likens GE, Matson PA, Schindler 661 DW, Schlesinger WH, Tilman DG (1997) Human alteration of the 662 global nitrogen cycle: sources and consequences. Ecol Appl 7:737– 663 750. https://doi.org/10.1890/1051-0761(1997)007[0737:
664 HAOTGN]2.0.CO;2
665 Welsh DT, Bourgués S, de Wit R, Herbert RA (1996) Seasonal variations
666 in nitrogen-fixation (acetylene reduction) and sulphate-reduction
667 rates in the rhizosphere of Zostera noltii: nitrogen fixation by
668 sulphate-reducing bacteria. Mar Biol 125:619–628.https://doi.org/
669 10.1007/BF00349243
670 Ye R, Wright AL, Inglett K, Wang Y, Ogram AV, Reddy KR (2009) Land-
671 use effects on soil nutrient cycling and microbial community dy-
672 namics in the Everglades agricultural area, Florida. Commun Soil
673 Sci Plant Anal 40:2725–2742. https://doi.org/10.1080/
674 00103620903173772
675