ORIBATID ASSEMBLIES OF TROPICAL HIGH MOUNTAINS ON SOME POINTS OF THE „GONDWANA-BRIDGE” – A CASE
STUDY
(METHODOLOGICAL POSSIBILITIES OF COENOLOGICAL INDICATION BASED ON ORIBATID MITES №. 1.)
P.BALOGH–V.GERGÓCS1 – E.FARKAS 1 – P.FARKAS –M.KOCSIS 2–L.HUFNAGEL3*
1Eötvös Lorand University of Budapest, H-1117 Budapest, Pázmány Péter sétány 1/c, Hungary
2Corvinus University of Budapest, Department of Mathematics and Informatics H-1118 Budapest, Villányi út 29-43., Hungary
(phone: +36-1-482-6261; fax: +36-1-466-9273)
3„Adaptation to Climate Change” Research Group of Hungarian Academy of Sciences H-1118 Budapest, Villányi út 29-43., Hungary
(phone: +36-1-482-6261; fax: +36-1-466-9273)
*Corresponding author e-mail: leventehufnagel@gmail.com
(Received 15th July 2008 ; accepted 20th October 2008 )
Abstract. This work is the first part of a series of studies, which introduces the methodological possibilities of coenological and zoogeographical indication and – following the climate, vegetation and elevation zones – the pattern-describing analysis of the main Oribatid sinusia of the world explored till our days.This current work is a case-study, which displays the comparison of 9 examination sites from 3 different geographical locations. On each location, three vegetation types have been examined: a plain rain-forest, a mossforest and a mountainous paramo. Analyses are based on the hitherto non-published genus-level database and coenological tables of the deceased János Balogh professor. Occurrence of 18 genera is going to be published as new data for the given zoogeographical region.
Keywords: Oribatid mites, rainforest, mossforest, paramo, Costa Rica, Brazil, Papua New-Guinea, similarity pattern, coenology, community, assembly
Introduction
Oribatid mites of the tropical regions had been almost completely unknown for science before 1958. With the general use of the Berlese-funnel, systematic collections started at that time, which resulted in the collection of hundreds or thousands of species.
However, the majority of these samples are unprocessed till these days. Professor J.
Balogh and his fellow-workers had to realize, that the description of all the species living there is an impossible task.
And even if the recognizable morphological kinds of the samples will be described with decades of monumental work by the practices of formal describing taxonomy and according to the rules of nomenclature, the biological and coenological information content of these would still remain hidden. However the material extracted with the Berlese-Tullgren device informs us not only about the presence and morphological diversity, but also about the species’ abundance and dominance as well. Moreover it has
become clear that this material together, as it was brought in front of us, contains a heap of such kind of information, which would be impossible to read from single species or from their constitutional characteristics. The samples collected this way are suitable for zoocoenological examinations. This observation led Humboldt to the recognition of
„basic forms” (Grundformen) and later to the revelation of formations, which means the structure that can be found in plant associations without the exact knowledge of species.
The emphasis here is on the „visibility” of the vegetation, because the recognition of biological communities began with the sight of the flora: vegetation is a „landscape element”. Animal communities – apart from some exceptions – live hidden in the vegetation. But the Berlese-device concentrates and makes them visible.
Supported by the Division of Natural Sciences of UNESCO, and then with the help from other sources and by decades-long, even currently running work, J. Balogh and his followers (the senior authors of this paper among them) have been taking surveying collections in the tropical rainforest soils of Africa, South-America, South-East-Asia, New Guinea and of the islands of the world’s oceans. The picture drawn by the experiences gathered on three continents shows a disastrous destruction of natural vegetation, first of all tropical rainforests. If soil zoology wants to keep pace with this devastation, such a new, global research plan has to be made which provides before long a globally perspicuous picture of Oribatid fauna. Obviously, traditional museological and phenetic taxonomical methods in themselves are unsuitable for this task. In the view of collection technique, Berlese-device provides a unique advantage.
Based on the available results of explorative field work the time has come to explore the hidden zoocoenological information in the structure of Oribatid-associations and thus pave the way towards the forming of exact, academic hypotheses.
It would have been impossible to survey the whole tropical zone of the Earth. This is why two broad, representative belts have been chosen. The first of them follows the range of Andes, spreads from the Tropic of Cancer to the Tropic of Capricorn and not only covers the range of Andes, but also the broad tropical belt lying to the East of them. The 6000 m high ridge of Andes forces the clouds arriving from the direction of the ocean to ascend. Thus, on the Eastern slope of the mountain, zonations of luxuriant mountain forest and mossforest can be found. It has been planned that collections between the two Tropics, at different latitudes would be made through the Andes in zonal transects, and also in a regional transect which crosses the whole continent. The tropical zone of South America contains a mountain which is independent from the range of Andes: the Serra do Mar, and there’s also a parallel range of Serra do Mantiguéra which lies to the Northeast of Sao Paolo on the coast of the Atlantic Ocean.
It lies on the most densely populated area of Brazil; therefore 95 % of its vegetation has already been destroyed. Recently, authorities try their hardest to save what is possible for science. This is the reason why the Hungarian research group also involved this region into their examinations. Their collection spots were located in 5 broad transect belts of the Neotropical Region. The first belt follows by and large the 20., the second the 10. grade of Northern latitude, the third the Equator, the fourth and fifth the 10. and 20. grade of Southern latitude (see sketch-map).
The other representative belt begins at the tropical coasts of Australia by Rockhampton, crosses Great Dividing Range and breaks 5 degrees to the South of Equator in Papua New-Guinea, at Owen Stanley Range. No other greater mainland can be found to the north of the Equator in this belt. Collections have been made at two
important areas to the East of the Australia-New Guinea line: in New Caledonia (north from the Tropic of Capricorn) and in the Hawaii-islands (south from the Tropic of Cancer). As it is known, the subduction of Australian Plate is to the east from New Caledonia, in the „Hebride-ditch”. These two area belts are connected with their common Gondwana-past. Plates which lie on the present area of South-America represent the Western, and those of New-Caledonia and New-Guinea represent the Eastern territories of Gondwanaland.
These two area-belts which were selected for examination are not only connected by their common Gondwana-past, but also by the spread of two plant genera: Araucaria and Nothofagus. Both connect Neotropical Region with Notogaea in the shape of a giant „U”. The South-American branch of this „U-shape” follows by and large the range of Andes, but it is split into two parts around the Tropic of Capricorn and forms the Serra do Mantiguera- Serra do Mar twin mountain ranges in South Brazil. The two branches of the giant U-shape meet at Antarctica. The continuity is testified here partly by fossil remnants and partly by Araucaria and Nothofagus fossil pollen. The Eastern branch of the U-shape lies on the New-Zealand- New Caledonia – New-Guinea line and ends below the Equator. Araucaria formed great forests in South-Brazil, Argentina and Chile, but most of them are destroyed by these days. However, even nowadays there are great stands in New-Guinea. The gene centre of Araucaria is in New-Caledonia, 13 of the known 19 species live here (Schmidt, 1981). The range of Nothophagus is roughly identical to Araucaria. Great populations can be found on the temperate parts of Argentina and Chile and in New-Zealand. Its gene centre is in New-Guinea, where significant part of the known species lives.
The areas selected for examination were further narrowed down by concentrating our collections mainly to the humid tropics. Most of our collection sites had been on locations where vegetation formed closed forests due to abundant precipitation. These areas were: zones of tropical rainforest, tropical mountain forest and tropical mossforest, and even grass areas above forest threshold.
Beside vegetation types, the composition of Oribatid species is decisively influenced also by macroclimatic conditions. The data of Walter and Lieth Climatic Atlas, the so- called climatic graphs provide sufficient information on the annual or even daily changes of the macroclimatic conditions of the examined sites. Walter and Lieth discloses such kind of data on more than 10,000 locations of the Earth. Data are disclosed by continents and inside the continents, by climatic zones. This way, direct or indirect, but adequate data can be found for any location of the Earth. The vegetation type and the applying climatic graph can provide such kind of particular information, that the generic composition of the Oribatid sinusium can be described with great probability – even if we collect Oribatids on the site for the first time.
The Berlese-samples had been recorded separately, according to vegetation levels (substrate types). Main substrates were: soil, litter, moss, hanging litter, bark, epiphytes, canopy; and various transitions or combinations of these. Oribatids which were collected in the identical level (substrate-type), identical locality and extracted with Berlese-Tullgren device have been considered as units of examination. This material has been called Oribatid-sinusium. In one level, generally 2-10 – and in some exceptional cases even more – parallel materials have been collected. These were extracted and examined separately, but the group of parallel materials collected from one locality has been considered as sinusium. The number of parallel samples of sinusia was intended to be chosen in such a way that it should represent the whole of the habitat
properly, so more prevalent substrates (and such, also sinusia) have been represented by more sample units. Between 1965 and 1995, there have been 20 collecting journeys altogether in those representative belts with the purpose of collecting Berlese-samples available for coenological analysis. The sinusia collected from different areas have been distributed as follows:
Neotropical Region
Cuba 80
Costa Rica 141
Ecuador 207
Brazil 386
Australia and Oceania
Tropical Australia 82
New-Caledonia 133
New-Guinea 394
Hawaii Islands 95
Later on, these were supplemented with further samples:
According to the climatic classification of Walter and Breckle (1983), the area of rainforest clusters around Sao Paulo and Rio de Janeiro belongs to the group of extraequatorial tropical rainforests. However, relatively far from the Equator, in the zone of seasonal rainfalls – Zonobiome II (ZB II) – due to the effect of abundant rainfalls coming from the direction of the Atlantic Ocean, a perhumid Subzoobiome (sZB II/e I) is formed on the shore. This is also called tropical rainforest for simplicity.
The daily fluctuation of the temperature in the typical equatorial rainforests – especially in the soil – is quite negligible, and the mean annual temperature hardly changes. The situation is similar in the perhumid Subzoobiome of Zonobiome II. In the Orobiomes - which join to the tropical Zonobiomes – or tropical mountains, the annual mean temperature changes by 0.5-0.6°C in average with every 100 m increase in elevation above sea level. The fluctuation in the temperature has a decisive influence on the fauna of tropical rainforest and also to their soil fauna. Species with small tolerance – the so-called stenotherm species – can survive only in flatland or low-mountain jungles. The upper limit of their prevalence is – depending on the geographical latitude of the area – about 1000 m elevation above sea level. The next vertical prevalence limit is around 1700-2000 m, where the tropical rainforest is replaced by tropical mossforest.
The diversity of the soil fauna is the greatest in this region. Above the tree line, the fauna changes completely, diversity sharply decreases and species with extreme cold tolerance appear.
Objectives
In this present section of our examinations, we set the objective to clarify the methodological possibilities of biological indication and the information content of the coenological data matrices by an appropriately chosen indication case study. We also set the aim to apply univariate indicators and to exploit the possibilities of multivariate coenological pattern analysis.
In this study, we attempted to answer the following indicational questions (exploring the following phenomena):
Taxonomical questions and their indicators
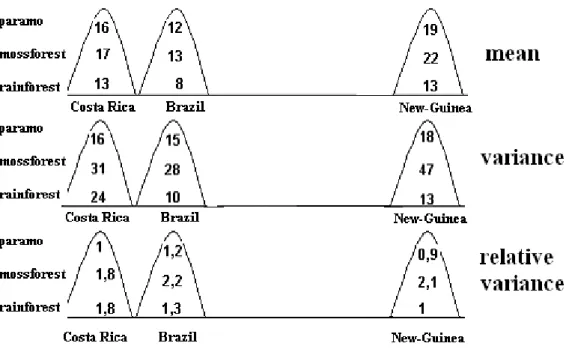
1. Is the average species number of those genera where the present individuals belong to characteristic to a habitat or not? (Indicator: The arithmetic average, empirical variance and relative variance of the species number of Oribatid genera present in the examined habitat weighted by constancies).
2. Is the information on the extent of taxonomical isolation of present genera characteristic for a habitat? (Indicator: The average number of genera, its empirical variance and relative variance of the family number of Oribatid genera present in the examined habitat).
Zoogeographical questions and their indicators
3. Is the information on the worldwide spread of species belonging to the present genera characteristic for a habitat? (Indicator: presence in the examined habitats of the species belonging to the examined Oribatid genera in the main zoogeographical regions with the method of “simple voting”.)
Question of spatial heterogeneity and its indicator
4. Is the information on the extent of difference in the genus composition of the different soil samples collected from the same habitat characteristic for a habitat?
(Indicator: the average pairwise dissimilarity of samples collected from the same habitat (with distance functions calculated for the presence of genera), as a coenological heterogeneity indicator).
Coenological (multivariate) questions and their indicators
5. Is the similarity pattern of genera of different habitats informatory on the type and/or geographical location of the habitat? (Indicator: the multivariate similarity pattern of Oribatid community of habitats).
6. Is the similarity pattern of Oribatid genera in soil samples collected from different habitats informatory on the type and/or geographical location of the habitat?
(Indicator: the multivariate similarity pattern of Oribatid community of individual soil samples of habitats).
7. The type or the geographical location of a habitat plays bigger role in the formation of the present Oribatid fauna? (Indicator: linear regression model).
Review of literature Berlese and Grandjean
The establishment of Oribatology in the last 100 years can be linked to two great persons: A. Berlese and F. Grandjean. If we look at the dates of the first and last publications of these two persons (Berlese: 1880-1923; Grandjean: 1928-1974), we can recognize the beginning and the end of two 50-year long eras. The first period, among many other things, provided us with an outstanding extraction method: the Berlese
device. This method – regarding its significance – can be compared to the invention of the microscope. It led us to the exploration of a new, unknown microcosm: the mezofauna of the soil and thus, the establishment of a new field of science: soil zoology. In the second era, a congenial scientist – F. Grandjean – not only spotted the most subtle structures under his microscope, but also unravelled the principles of hundreds of millions years of evolution. It is not so self-explanatory that these two aspects do not exclude, but on the contrary, they supplement each other. If the subject of the branch of biological discipline is the existing, given living organism in its timeless existence (esse, being, das Sein), then we speak about the present, current branch of discipline. This is the aspect of Berlese’s work of life. And if the subject of the biological discipline is the genesis, past, evolution of the living organism, in other words, its existence through the time (fieri, becoming, das Wesen), we speak about a genetic branch of discipline. This is the essence of Grandjean’s work-life. To understand the structure and functioning of biosphere, we have to learn the components of the whole system in a form they exist today. Then we have to learn their evolutionary past, where they originate from. This is how the two aspects can be linked to each other.
Problems arise with the fact that these two aspects work with different objectives. Those who study the Oribatid fauna of the world, the Oribatid assemblies in the ecosystems, want to give little but important information on as many species as possible, because such kind of differentiating characteristics are sufficient for the recognition of the building elements of these assemblies. And those, who deal with the evolution of Oribatids, want to obtain a tremendous number of data - which are important from the aspect of evolution - but only on a little number of species. Since the Hungarian research team dealt with the examination of Oribatid assemblies and their spatial distribution of Oribatids, they represent the first group of oribatologists.
Further international studies
The „first wave” of research started in 1958. By that time we have to differentiate between preliminary and general collections. On the fist place we mention the exemplary work of Aoki et al. in Japan and Eastern Asia. The subantarctic research of Wallwork is of general significance, however his work in Ghana and his further African works can be considered only as preliminary studies. In the „second wave” which started in the late sixties, - among many others - the works of Engelbrecht (1969) and his fellow researchers in South Africa; Corpus-Raros (1979) on the Philippines, Lee (1980) in Australia, Pérez-Inigo and Baggio (1980) in Brazil, Bhattacharia et al. (1972) and Haq (1980) can be considered to be of general importance.
Hammer and Beck
The fact that 90 % of tropical Oribatid species were unknown until the late fifties, made coenological examinations impossible, however there have been many attempts to reach this goal. Hammer (1958-1962) published four fundamental works on the Oribatids of the South American Andes, partly even from tropical areas. Starting from Peru, down to the Tierra del Fuego he collected almost 50,000 Oribatid specimens. He identified the whole collection and found 466 species, of which 324 were unknown.
Thus he laid down the basics of the description of the South-American Oribatid fauna.
He also started the coenological processing of the material, but the taxonomic work exhausted him in such an extent that he hadn’t had the time to complete this work. The
fundamental work of Beck (1963) has a similar significance. He examined mites in only one region of Peru, in the main vegetation zones of the Andes. He completed 300 Berlese-collections with more than 350,000 specimens. A significant part of the examined material belonged to the Oribatids. He made important statements primarily concerning the „autoecology” of the species, but the huge number of undescribed species made coenological analysis impossible. The holistic point of view is characteristic both to Hammer and Beck. They applied their examinations not only to individual species but to the whole Oribatid community. Unfortunately, there has been a fundamental difference between the point of view of Hammer and Beck. Hammer was driven primarily by biogeographical problems; he wanted to learn the regional distribution of Oribatids. This is why he marked his collection spots in a range of thousands of kilometers from Peru to the Tierra del Fuego (Land of Fire). Beck based his studies on the different elevation zones of vegetation, so he studied the zonal distribution of species. It is obvious, that a world-wide study requires both of them, and the Hungarian research team planned an examination exactly of this kind. In their plan, both regionality and zonality obtained their roles.
General findings of the coenological Oribatid examinations
The greatest experience of a first look on an extracted Berlese-material is that unevenness can be found in the Oribatid assemblies. Some species appear in great numbers, while only a few can be seen from others. The second experience has been that if we repeat the collection over and over again, certain species appear constantly.
Species with great numbers are called dominant, and the ever-appearing are called constant species. These two characteristics can be experienced often by the same species, so these are called constant-dominant species. According to the third experience, there are some species, which live only in certain kinds of Oribatid assemblies; they can be collected only in that combination of species. These are called character species. And according to the fourth experience, certain Oribatid species – however, apparently there’s no direct connection among them – always appear together in the Oribatid assemblies.
New results of Oribatid bioindicational studies
Analysing the suitability of Oribatids for indication purposes, many authors point out their long life-span, slow growth and slow dispersion ability. Based upon these characteristics, Oribatids can be used as strong indicators of their environment (Gulvik 2007). Current bioindicational studies based on Oribatids use just the measures of Oribatid abundance or species richness at most. A significant part of these studies are directed to analyse anthropogenic effects. According to Niedbala (1990), every kind of human interference decreases the abundance and species richness of the mites. Oribatids are thought suitable – though in different extent – for bioindication purposes in respect of chemical pollutions according to works of Andres 1999, Braman 1993, Liiri 2002, Miglorini 2005, Prinzing 2002, Zaitsev 2001, Seniczak 1995, Skubala 2004, Stamou 1995, Steiner 1995, Straalen 2001 and Osler 2006. Many authors refer to the role of moisture and organic material content of the soil in affecting the abundance of Oribatids (Braman 1993, Siepel 1996, O’Lear 1999, Kovac 2001, Tsiafouli 2005, Altersor 2006);
however their statements concerning the direction of these effects are contradictory.
This is not surprising, since different communities had been examined. Based on
surveys of different approaches, effects of human indicated changes in the structure of vegetation (grazing, agricultural cultivation, forestry etc.) seem to be clear (Migliorini 2003, Lindo 2004, Altesor 2006, Berch 2007, Cole 2008), since disturbances of vegetation result in lower Oribatid abundance. We think however that the role of anthropogenic effects can only be entirely understood if the reasons and patterns of naturally induced variability in community structure were explored first, since these can be considered a reliable reference in the evaluation of anthropogenic disturbances.
Examining the effects of different vegetation types and floral succession stages, many authors (Noti 1996, Salmon 2006, Osler 2001 és 2006, Coleman 2008) describe high Oribatid abundance and species richness in natural or almost natural habitat types.
These authors also point out that the role of definite plant species, substrate types and microhabitats does not seem to be significant form the aspect of the composition of Oribatid communities (Kaneko 2005, Franklin 2005, Fagan 2006, Lindo 2006), though contradictory data also exist (Coulson 2003). By analyzing African Oribatid communities, Noti (2003) attributed the most significant effect to vegetation type, followed by moisture content, then organic material content, C/N ratio and N-content in respect of species richness.
Materials and methods
Examined areas and their vegetation
This work is intended to be the first part of a series of studies consisting of several parts. In this study series, we want to introduce the main Oribatid sinusia of tropical areas as per climatic, vegetation and elevation zones. According to the holistic approach, we start from the whole and proceed towards the smaller parts. As a first step, we examined the similarities between the Oribatid sinusia of the Neotropical Region and the Notogaea. Stemming from the fact that the vertical stratification of Oribatid fauna follows the vegetation zones, we took samples for examination from 3 elevation zones:
1. tropical rainforest 2. mossforest 3. paramo
In the study, we disregarded the mountain forest zone, which can be found between the zones of tropical rainforest and mossforest, because the determination of its borders is quite uncertain. To avoid transitions, Berlese-samples of tropical rainforest have been selected from 200 m elevation above sea level, close to the forest border. 2 ideal transects were set for representative sampling. The first one crosses Andes at Costa Rica, at the 10. degree of latitude, from coast to coast. The second one starts from Papua New-Guinea, from the valley of Fly River at the 4. degree of Southern latitude, and goes up to the 4000 m high ridge of Mt Wilhelm. As an amendment, samples were also taken near to the 23. degree of Southern latitude in an additional transect, crossing Serra do Mar and Serra do Mantiguera. This transect has been set because 200-300 years ago there’s been a belt of dense tropical rainforest – which even exceeded Amazonia in biodiversity – in the most densely populated area of Brazil, along the line marked by Sao Paulo and Rio de Janeiro. Almost 95 % of these forests have been devastated, but it could have been hoped that the rainforest spots reserved the original soil fauna – at least
partially. 82 representative samples have been collected on 9 spots of the three transects.
The spatial distribution of these samples and the abbreviation of individual sites can be seen in the next table:
Tropical rainforest
Mossforest Paramo
Costa Rica RC: 10 MC: 10 PC: 10 30
Brazil RB: 7 MB: 6 PB: 10 23
New-Guinea RN: 10 MN: 9 PN: 10 29
27 25 30 82
Taxonomical processing of the collected material
Oribatid mites are one of the land animals with the highest population density. Their abundance among tropical conditions can exceed one million individuals per square meter, but even among the conditions of the temperate zone, their density is 50,000- 500,000 per square meter, while in agricultural areas this measure is around 25,000 in average (Coleman et al. 2004). Their numbers are also significant in treebark (Erdman 2006) and foliage (Winchester 1997, Behan-Pelletier and Walter, 2000). Using 16, 32 or more Berlese-devices during many years in a worldwide sample collection we get such an extreme amount of individuals, which is impossible to identify completely. Given such a worldwide programme, set forth by the Hungarian research group, the processing of the entire material is even more inconceivable. Thus we decided to render the second level of the system, the genus, as the base of the processing. Members of our research group – formerly led by János Balogh – knew well before the initiation of coenological analysis that the genus could be the taxonomical level which can bear valuable information for an examination of such a magnitude. Using species as a category at the current level of Oribatid taxonomy would be an entirely hollow task, since the decisive majority of the described morphological species apparently have no valuable ecological or evolutional information content. Thus, it is not a coincidence that the work of Hammer and Wallwork (1979) on the connection between the worldwide distribution and continental migration of Oribatids is based on generic distribution from the beginning to the end. Most biogeographical and many ecological studies do so in connection with other groups of animals. This is not a coincidence, but a consequence originating from the past and (unfortunately) the current practice of species description.
The interpretation of species of the phenetic descriptive taxonomy is under the subjective approach of the describing taxonomist, since there are no uniform rules in this respect. If an individual is found to be different from the formerly described species in 2-3 seemingly independent morphological characteristics, then it is usually automatically considered as a new taxon. Descriptive taxonomists are interested in the propagation of the number of nominal species, and in accordance with the aforementioned, their activity is not subjected to strict scientific critics. Thus the question whether a species described correctly from the aspect of nomenclature can be considered as a new inherent biological entity or not, usually does not even emerge.
Resulting from quite understandable reasons, the modus operandi is eclectic even by the description of these nominal species. Conspicuous, easily identifiable species have been preferred. In large genera with many species, much less species is described because it requires more work and unproductive intellectual efforts. Early auctors strove to briefness, listing of the differentiating characteristics by the description of species, thus
the more general characteristics; really important biological strains were put forward during the description of genera. As a consequence, it is quite possible that slightly different species from the same genus represent only the variability within the biological species. Obviously, to unveil this, is an important scientific task.
The generic exploration of the Oribatid mites of the world among the current conditions seems to be sufficient from the aspect of the valuable biological research, and the genera tend to represent real biological phenomena more likely than the infinite nominal species.
Despite these grave scientific problems, coenological, zoogeographical and ecological studies are compelled to use the classic morphological, descriptive taxonomical works as a base until molecular techniques capable of the definite identification of kinds do not become simple, fast and cheap enough for the routine processing of large materials.
Assembling coenological tables
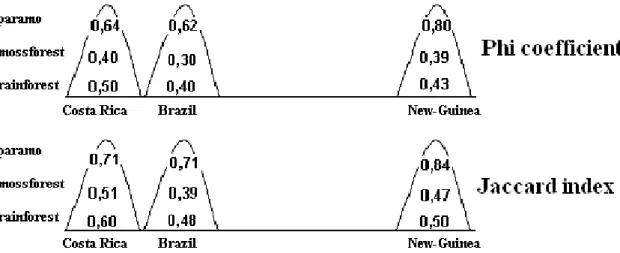
The base table for our analyses was the 82 individual soil samples from the 9 examined habitat (3 habitat types of 3 areas) containing 111 Oribatid genera. For the various analyses, we created task-oriented assemblies from this base table. We created the constancy table of the genera of the 9 habitats, where the constancy values of the individual genera have been estimated by the relative occurrences in the related samples (Table 1). As a complementary data source, we created the occurrence table of the same genera in the zoogeographical regions based on the monography of Balogh and Balogh 1992, complemented with own, new data (Table 2). Using the same monography as a reference, we looked up the number of species of the genera, and the number of genera of the families which we used as complementary information for the analyses. Based on all of the individual samples, paired all samples with all other samples we created the similarity matrix of our data using multiple distance functions. In this current publication, Euclidean distance, PHI coefficient and Jaccard function have been used.
Methods for analyzing coenological tables
We created the indicators marked by our objectives from our coenological tables, and analysed the values of these indicators in the different sites. As a taxonomical indicator, we calculated the average number of species of genera found in individual habitats weighted by the constancies (and also its empirical and relative variance), and the average number of families of the same genera (and variances). As a zoogeographical indicator, we introduced the method of “simple voting”, where the occurring genera give one vote for those geographic regions, where at least one of their representatives can be found. Occurrence of one genus in one region means 1 vote for the region in question. Votes of genera of a certain site given for different regions are represented as a % proportion of the total votes of these genera, what is characteristic for the habitat.
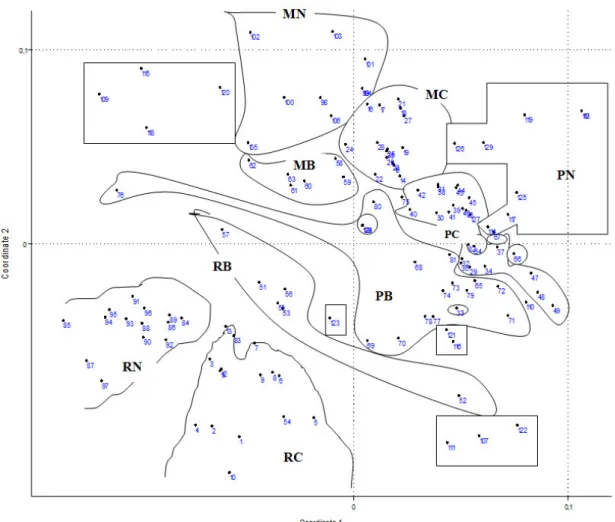
We examined the constancies of genera on individual habitats, and the generic heterogeneity of the samples. The measure of heterogeneity was calculated by pairing every sample with all the other samples within a site. Based on the presence-absence data of their genera, we created their distance matrices and calculated the average of the distance values. After the evaluation of univariate indicators we analysed the similarity patterns of the sites with Non-Metric Multi-Dimensional Scaling (NMDS) and Hierarchical Cluster Analysis (HC-UPGMA ) using multiple distance functions, then
we conducted these analyses on the tables of individual elementary samples. We applied multivariate regression modelling in order to further evaluate the results of multidimensional pattern analysis and to test our hypotheses. Gathered results have been evaluated collectively and compared with literature findings, then the examined habitat has been characterized by these results.
Results
Results of taxonomical processing of field samples
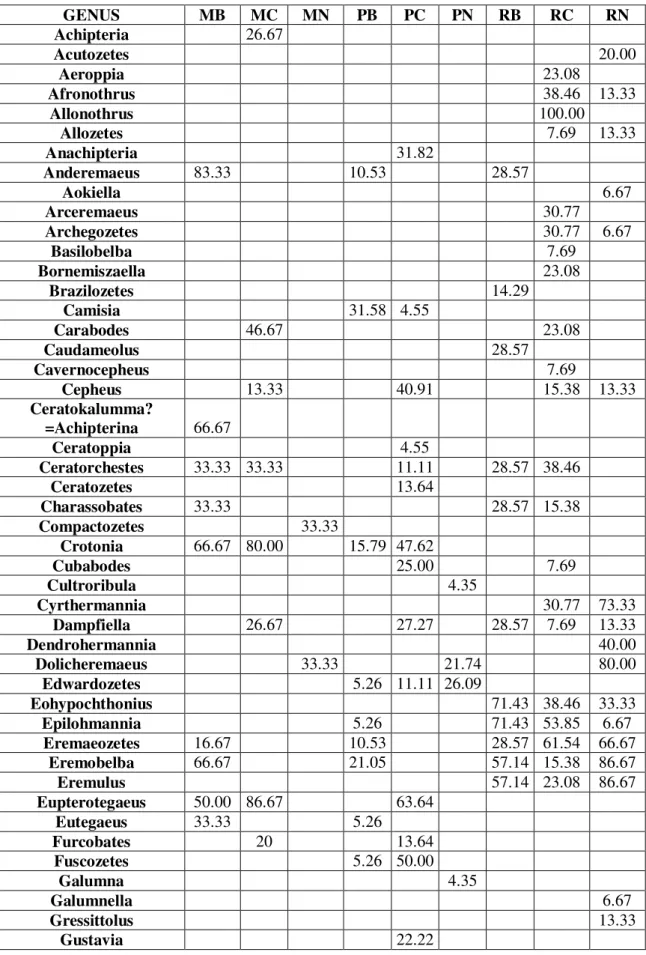
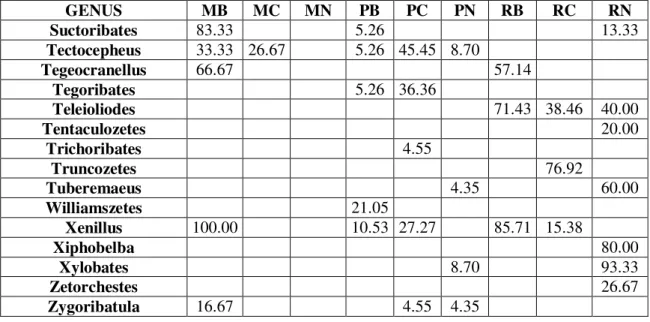
By the taxonomical processing of field samples we determined the occurrence data of the found genera, which have been made comparable by representing them in constancy %. Results are summarized in Table 1, where we marked the dominant genera (with mass occurrence) by underlining beside the constancy data. High constancy value and underlining together marks constant-dominant genera. Most rigorously constant-dominant genera are the Xenillus and the Plasmobates in the Brazilian mossforest, the Oppia in the New-Guinean mossforest, the Allonothrus in the Costa-Rican rainforest and the Rostrozetes in both the Costa-Rican and New-Guinean rainforests. According to our data, the Eremulus, Eohypochthonius and Teleioliodes genera are characteristic for the rainforests, the Oppia genus for the mossforests, and the Scheloribates genus for the paramos. Geographic characteristics can only be observed by the Anderemaeus genus for Brazil and the Dolicheremaeus genus for New-Guinea. We couldn’t find a single genus characteristic for the American continent.
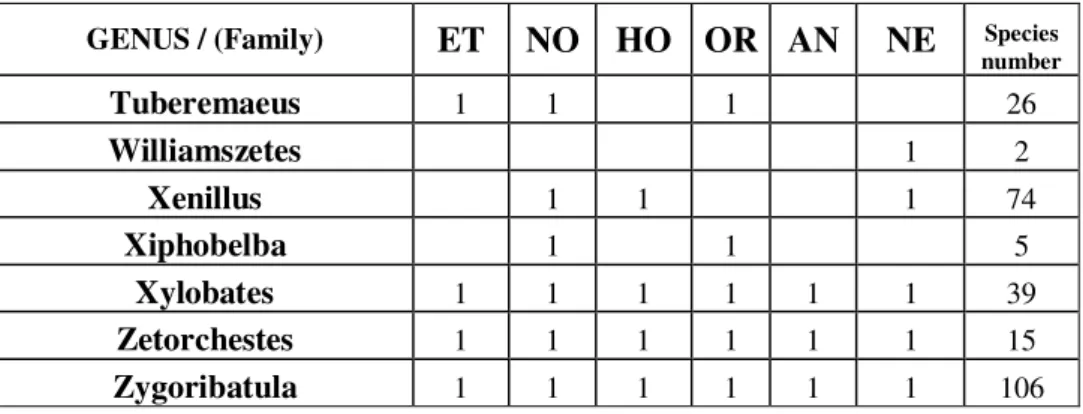
Malaconothrus and Microtegeus genera could be found on all sites (general prevalence).Based on the monography of Balogh and Balogh 1992, occurrences of genera found by us in the zoogeographical regions of the world are summarized in Table 2. According to our own data, in comparison with the aforementioned monography, occurrence for the relating zoographical region of 18 genera can be published as new data, these are marked underlined. Based on the data of the table it is clearly visible that the Malaconothrus and Microtegeus genera (observed by us on all sites) are truly cosmopolites, similarly to the Dolicheremaeus genus, which we found characteristic to New-Guinea. However, the Anderemaeus is known only in Notogaea and the Neotropis. The Scheloribates, Eremulus, Eohypochthonius, Rostrozetes, Plasmobates and the Oppia genera are cosmopolites. The Teleioliodes genus can be considered prevalent in Gondwana. The Xenillus is known from Holarctis, Notogaea and Neotropis, and the Allonothrus genus is circumtropical. These data point out, that members of genera with very wide prevalence from purely geographical aspect are quite discriminative in respect of habitats, and thus can be informatory for us.
Table 1.Constancy % of Oribatid genera found on individual sites
GENUS MB MC MN PB PC PN RB RC RN
Achipteria 26.67
Acutozetes 20.00
Aeroppia 23.08
Afronothrus 38.46 13.33
Allonothrus 100.00
Allozetes 7.69 13.33
Anachipteria 31.82
Anderemaeus 83.33 10.53 28.57
Aokiella 6.67
Arceremaeus 30.77
Archegozetes 30.77 6.67
Basilobelba 7.69
Bornemiszaella 23.08
Brazilozetes 14.29
Camisia 31.58 4.55
Carabodes 46.67 23.08
Caudameolus 28.57
Cavernocepheus 7.69
Cepheus 13.33 40.91 15.38 13.33 Ceratokalumma?
=Achipterina 66.67
Ceratoppia 4.55
Ceratorchestes 33.33 33.33 11.11 28.57 38.46
Ceratozetes 13.64
Charassobates 33.33 28.57 15.38
Compactozetes 33.33
Crotonia 66.67 80.00 15.79 47.62
Cubabodes 25.00 7.69
Cultroribula 4.35
Cyrthermannia 30.77 73.33
Dampfiella 26.67 27.27 28.57 7.69 13.33
Dendrohermannia 40.00
Dolicheremaeus 33.33 21.74 80.00 Edwardozetes 5.26 11.11 26.09 Eohypochthonius 71.43 38.46 33.33
Epilohmannia 5.26 71.43 53.85 6.67 Eremaeozetes 16.67 10.53 28.57 61.54 66.67
Eremobelba 66.67 21.05 57.14 15.38 86.67
Eremulus 57.14 23.08 86.67
Eupterotegaeus 50.00 86.67 63.64
Eutegaeus 33.33 5.26
Furcobates 20 13.64
Fuscozetes 5.26 50.00
Galumna 4.35
Galumnella 6.67
Gressittolus 13.33
Gustavia 22.22
GENUS MB MC MN PB PC PN RB RC RN
Hammerabates 34.78
Hamotegaeus 4.55 28.57
Haplozetes 7.69
Hardybodes 26.67
Hermannia 33.33 5.26 57.14 80.00 Hermanniella 16.67 86.67 59.09 71.43 30.77 20.00
Heterobelba 66.67 13.33 5.26 12.50 85.71 7.69
Heterozetes 11.11
Idiozetes 20.00
Indoribates 6.67
Lamellobates 42.86 7.69
Liacarus 46.67
Licneremaeus 15.38
Limnozetes 5.26
Malacoangelia 16.67 60.00
Malaconothrus 50.00 60 22.22 42.11 31.82 21.74 71.43 92.31 73.33
Masthermannia 15.38 53.33
Microtegeus 83.33 33.33 22.22 26.32 11.11 13.04 71.43 53.85 40.00
Microzetes 21.05
Mochlozetes 42.86 30.77
Mycobates 5.26 4.55
Nanhermannia 83.33 60 63.16 50.00 71.43 28.57
Neoribates 53.33
Nixozetes 33.33
Nodocepheus 50.00 26.67 15.79 11.11 7.69 Nothrus 16.67 46.67 15.79 28.57
Oppia 83.33 93.33 100.00
Oribatella 66.67 26.67 30.77 33.33
Oribatula 57.89
Otocepheus 6.67
Oxyamerus 40.00
Pelops 33.33 31.82 4.35 15.38 Peloribates 66.67 47.37 42.86 7.69 46.67
Phauloppia 5.26
Pheroliodes 50.00 11.11 21.05 16.67 21.74 71.43 7.69 Plasmobates 100.00 60.00 26.32 52.38 71.43 30.77 66.67
Plateremaeus 7.69 33.33
Platynothrus 53.33 66.67 5.26 36.36 21.74 Protoribates 27.27 4.35 28.57 15.38
Pseudotocepheus 23.08
Pteroripoda 80.00
Reductobates 11.11 17.39
Rhynchoppia 23.08
Rhynchoribates 50.00 20.00 28.57 23.08
Rioppia 16.67 14.29 15.38
Rostrozetes 100.00 60.00 26.32 54.55 71.43 100.00 100.00 Scapheremaeus 80.00 36.84 36.36 8.70
Scheloribates 73.6 72.73 26
Sphaerochthonius 7.69
Sternoppia 7.69
GENUS MB MC MN PB PC PN RB RC RN Suctoribates 83.33 5.26 13.33 Tectocepheus 33.33 26.67 5.26 45.45 8.70 Tegeocranellus 66.67 57.14
Tegoribates 5.26 36.36
Teleioliodes 71.43 38.46 40.00
Tentaculozetes 20.00
Trichoribates 4.55
Truncozetes 76.92
Tuberemaeus 4.35 60.00
Williamszetes 21.05
Xenillus 100.00 10.53 27.27 85.71 15.38
Xiphobelba 80.00
Xylobates 8.70 93.33
Zetorchestes 26.67
Zygoribatula 16.67 4.55 4.35
Table 2.Number of species and presence characteristics of the examined genera according to Balogh and Balogh (1992). In the collected samples 18 genera were new to the fauna of the given zoogeographical region compared to this monography (bold underlined).
GENUS / (Family) ET NO HO OR AN NE Species
number
Achipteria 1 1 1 1 47
Acutozetes 1 1 5
Aeroppia 1 11
Afronothrus 1 1 1 1 5
Allonothrus 1 1 1 1 12
Allozetes 1 1 1 1 1 8
Anachipteria 1 1 1 19
Anderemaeus 1 1 8
Aokiella 1 1 2
Arceremaeus 1 4
Archegozetes 1 1 1 5
Basilobelba 1 1 1 1 13
Bornemiszaella 1 3
Brazilozetes 1 3
Camisia 1 1 1 1 1 1 39
Carabodes 1 1 1 1 1 130
Caudameolus 1 1
Cavernocepheus 1 2
Cepheus 1 1 1 1 60
Ceratokalumma?
=Achipterina 1 1 1 4
Ceratoppia 1 1 1 1 17
Ceratorchestes 1 4
GENUS / (Family) ET NO HO OR AN NE Species
number
Ceratozetes 1 1 1 1 1 1 89
Charassobates 1 7
Compactozetes 1 4
Crotonia 1 1 1 2
Cubabodes 1 5
Cultroribula 1 1 1 1 1 34
Cyrthermannia 1 1 1 1 1 12
Dampfiella 1 1 1 14
Dendrohermannia 1 1
Dolicheremaeus 1 1 1 1 1 1 105
Edwardozetes 1 1 1 1 8
Eohypochthonius 1 1 1 1 1 1 6
Epilohmannia 1 1 1 1 1 44
Eremaeozetes 1 1 1 1 17
Eremobelba 1 1 1 1 1 1 38
Eremulus 1 1 1 1 1 1 27
Eupterotegaeus 1 1 9
Eutegaeus 1 1 11
Furcobates 1 1
Fuscozetes 1 1 10
Galumna 1 1 1 1 1 1 207
Galumnella 1 1 1 1 1 14
Gressittolus 1 2
Gustavia 1 1 1 1 1 18
Hammerabates 1 1 1 4
Hamotegaeus 1 4
Haplozetes 1 1 1 1 1 11
Hardybodes 1 1
Hermannia 1 1 1 1 1 51
Hermanniella 1 1 1 1 1 32
Heterobelba 1 1 1 13
Heterozetes 1 1 1 6
Idiozetes 1 1 2
Indoribates 1 1 2
Lamellobates 1 1 1 1 1 11
Liacarus 1 1 1 1 1 1 80
Licneremaeus 1 1 1 1 1 1 18
Limnozetes 1 1 1 17
Malacoangelia 1 1 1 1 1 4
Malaconothrus 1 1 1 1 1 1 51
Masthermannia 1 1 1 1 5