hjic.mk.uni-pannon.hu DOI: 10.33927/hjic-2020-24
INFORMATIVE ENVIRONMENT QUALIFYING INDEX
ANETT UTASI*1, VIKTORSEBESTYÉN1,ANDÁKOSRÉDEY1
1Sustainability Solutions Research Lab, University of Pannonia, Egyetem u. 10, Veszprém, 8200, HUNGARY
Improvement in the quality of the environment and, as a result, in the quality of life, including environmental impact assessments and environmental management, play an important role in the practical implementation of environmental regulations.
The goal of this paper is to develop a new type of quantitative environmental impact assessment method to describe changes in environmental elements as well as the environment in an objective and reliable manner for various projects, investments, plans and proposals. An easily adaptable method was sought which provides a clear and well-interpretable result on the condition of and foreseeable changes in the environment.
The algorithm operates using the limit values of environmental elements set forth by national regulations. The evaluation is independent of the number of environmental parameters chosen as it was included in the informativity rates of the method. The process results in an aggregated index for qualifying the total environment but, nonetheless, the affected environmental elements and measured environmental parameters can be analysed independently. The Informative Envi- ronment Qualifying Index evaluates the environmental parameters in proportion to the strictness of the limit values. The final assessment of the total environment is performed by using varying intervals, therefore, the different cases can be compared to each other. Experts interpret the results as well as explain the changes in the state of the environment and, therefore, identify the cause-effect relationships.
Keywords: Environmental Impact Assessment, Quantitative methods, Informative Environment Qualifying Index, Environmental pollution
1. Introduction
The state of the environment has been changing drasti- cally in an unfavourable direction due to economic devel- opment, rapid population growth, as well as increases in the rates of production and consumption resulting in ex- tremely severe levels of environmental pollution amongst several other consequences. The European Union itself is committed to introduce actions and measures in order to take preventive steps to protect the environment. Regard- ing immediate actions to be implemented, environmental protection is an essential objective.
The Environmental Impact Assessment (EIA) and sustainability planning are intertwined. Both approaches aim to optimize future activities in an environmentally sound way and support decision-makers with appropri- ate, scientifically based evidence. Analyses must pro- vide quantified information as well as easily understand- able and comparable results, therefore, the aggregation of quantitative methods is widespread. The aim of this work is to develop an informative environment qualifying in- dex. In addition to indexing based on immission limits, it is important to evaluate the sustainability of cities, for
*Correspondence:utasi.anett@uni-pannon.hu
which the SDEWES Index is an excellent approach [1].
This method has been implemented in Southeast Euro- pean cities [2] and adapted for Hungarian cities [3].
Toro et al. developed a qualitative methodology for Environmental Impact Assessment (EIA) processes, which uses a double matrix to identify the impacts and assign quantitative values to the categories of quality [4].
Pavlickova and Vyskupova elaborated on a cumula- tive method for the evaluation of landscape vulnerability by taking this as well as ecological stability and the ratio of different measures of stability into account [5]. Herva and Roca reviewed the combined approaches and multi- criteria analysis for the purposes of evaluating corporate environmental performance. It was suggested to use the Multi-Criteria Decision-Making (MCDM) techniques in the industrial sector, decision-making in energy projects, waste management and wastewater treatment [6].
A possible method is the Environmental Impact As- sessment, which comprises 25 different EIA methods as well as uses a quantitative framework and standard clas- sification method as an optimal technique for the actual evaluation [7].
An integrated weight of evidence approach for en- vironmental risk assessment proposed by Caeiro et al.
where anthropogenic pollution, the impacts on human health, the exposition of polluted wells and agricultural soils as well as pollutants in sediments are combined with 14 categories of absolute conditions [8]. Phillips used an enhanced Rapid Impact Assessment Matrix (RIAM) method to evaluate quantitatively the potential impacts of an onshore wind farm during its construction and oper- ation [9], as well as for the sustainability evaluation of municipal solid waste management [10]. The RIAM ap- proach was successfully used by Brindusa et al. to evalu- ate the environmental impacts resulting from heavy metal pollution on the southern coast of the Romanian Black Sea [11]. Sun and Wang developed a comprehensive EIA system for shale-gas exploration, which includes the eval- uation systems of influence with regard to the natural and macro environments. The algorithm includes social, pol- icy and economic impacts, therefore, it can be adapted to other fields of environmental analysis [12]. Robu et al. analysed the impacts and risks of heavy metal pollu- tants in bodies of surface water. The basis of such eval- uations was the measured concentrations of the environ- mental parameters, therefore, the method is more objec- tive [13]. The reliability of the different quantitative and qualitative methods may be increased by integrating the technical background of Environmental Risk Assessment [14]. An Environmental Evaluation System (EES) that in- corporates relationships between environmental parame- ters and environmental quality was developed by Battelle Columbus Laboratories [15] and implemented for water resources planning by Ferreira et al. [16].
A review of aquatic environmental assessment meth- ods was published by Foden et al. in which a new clas- sification system is suggested that differentiates between static and dynamic links [17]. Yu et al. developed a uni- versal calibrated model for the evaluation of bodies of surface- and groundwater. The main advantage of this al- gorithm is that it works with any combination of water quality indicators. It was developed in accordance with Chinese legislation, therefore, must be adapted for inter- national applications [18].
On the basis of the literature review on EIA, it can be concluded that the aforementioned methods have sev- eral benefits, however, their limits should be taken into consideration. The main advantage of such methods is their suitability to compare different project alternatives.
However, in light of its practical applications, two main issues need to be addressed. Namely, the assessment is based on the limit values of environmental param- eters, measured/calculated values as well as the rank- ing/weighting/scaling of the environmental parameters and elements. In addition to these, it can also be con- cluded that the methods in the literature are less sensitive to extreme values, namely to discharges above the limit values.
In addition to environmental impacts, risk assessment is important for decision-makers. Wu et al. proposed a quantitative environmental risk assessment for the iron and steel industrial symbiosis network, which provides
an aggregate index value and is able to identify the most important driving forces [19]. Risks were identified in a chemical plant in Zhejiang province in China, where an index-based approach with the Analytic Hierarchy Pro- cess (AHP) and fuzzy operators was used for the evalua- tion [20].
The objective of this paper is to develop a new, easily adaptable, objective and reliable quantitative EIA method which provides an unambiguous outcome in the case of projects, investments, plants and proposals in compari- son with the methods given in the literature. Environmen- tal impacts should be identified during the early design phases [21] in order to avoid unlawful and polluting ac- tivities. A widely usable, target-oriented, objective and comprehensive new type of quantitative EIA technique was sought and its applicability verified.
The environmental impacts were linked to human ac- tivities in order to explore the cause-and-effect relation- ships, therefore, systems thinking is crucial in the case of an EIA. Rocha et al. developed a multiple indicator- based approach for environmental quality assessment in urban areas [22]. The proposed IIEQmethod is suitable for tracking environmental changes which can be linked to different human activities.
2. Results: Methodology
The Informative Environment Qualifying Index (IIEQ) method was developed in accordance with legal and other relevant stipulations. The IIEQ characterizing the total environment can be determined as depicted inFig. 1.
The environmental assessment of alternatives to the project begins with screening the projects according to the applicable laws and regulations. The preparation of a reference databased Bepends on the scope of the analy- sis. Firstly, the relevant environmental elements must be selected and their limit values determined. Following the preparation of the database, the algorithm is expanded by defining the environmental parameters studied for the se- lected environmental elements and the weighting of these parameters determined. The workflow of the method has been developed in such a way that it can be used to study an individual environmental element or complex cases, e.g. where several environmental elements are considered simultaneously. By analysing the environmental parame- ters (the second block inFig. 1which qualify the given environmental element, it is possible to plan the optimal mitigation strategy for that element. Therefore, the driv- ing forces/drivers in the quality of the element are iden- tified. The analysis with regard to the level of the envi- ronmental element provides a comprehensive picture of the state of the studied elements and important informa- tion in the evaluation of the environmental impacts of the projects. The environmental analysis (the last block in Fig. 1) ensures a basis for the comparison of the different cases investigated. TheIIEQvalue helps decision-makers to determine the optimal measure or project alternative.
Figure 1:Methodology of the Informative Environment Qualifying Index
The method is suitable for multilevel analysis. The levels are represented by different colours inFig. 1. The final outcome of the method is the determination of the IIEQ. These steps are discussed in the following section.
2.1 Reference database
Laws and regulations pertaining to the investigation The basis for the method is the set-up of the environ- mental reference database according to Hungarian stip- ulations. When used in other countries, the reference database should be adjusted to pertain to the legal reg- ulations of the country in question. The environmental elements are studied in the present paper in light of the Hungarian law on the environment. The following envi- ronmental elements were taken into consideration:
1. Surface water: water flows (W) 2. Surface water: lakes (L) 3. Groundwater (G) 4. Soil (S)
5. Air (A)
Some EIA techniques, which were developed for the analyses of specific environmental elements, e.g. Németh
et al. provided a quantitative tool for bodies of surface water [23] to show changes in water quality of Lake Balaton, the largest natural shallow lake in Central Eu- rope [24,25]. In the case of air pollution, the Air Qual- ity Index (AQI) is a useful tool to improve public un- derstanding and participation [26]. Calculations of AQI can be supported by the two-phase decomposition tech- nique and machine learning [27]. Indoor Environmental Quality (IEQ) can also be taken into consideration as this was analysed in a university building [28]. The EIA tech- niques can be sector-specific as well, e.g. Sanz et al. de- veloped a new well-being index to describe the environ- mental quality of renewable energy sources and nuclear power [29].
One of the most important goals during the develop- ment of the IIEQwas to provide a tool that facilitates the public understanding of environmental impacts in a sim- ple, clear way, which includes more graphical representa- tions of the impacts and is capable of describing changes in the state of the environment across an aggregated index value.
Determination of the environmental parameters for the environmental elements studied
Lists of environmental parameters are collected for every environmental element which is to be evaluated accord- ing to the pertaining stipulations. The database includes the names of the environmental parameters as well as their limit values and validity. The list for surface water is based on GD 2010 [31], the Water Framework Directive.
The lists for soil as well as groundwater are based on GD 2006 [32], and the one for the environmental parameters of air can be defined on the basis of GD 2011 [33].
Environmental parameters for which no limit values are specified can be studied as well, since the numerical target for the environmental parameters should be deter- mined by specialists and such values are to be included in the list of environmental parameters.
Weight of environmental parameters
Generally speaking, the objectivity of the EIA is com- promised or questionable when a specialist defines the weighted preferences for the environmental parameters.
In order to solve this problem, the authors have developed a weighting procedure based solely on environmental regulations and specifications. The hypothesis assumes that legislators took the risks and impacts of the environ- mental parameters into account whilst defining the limit values. The IIEQ weighting procedure defines different categories of importance with regard to the environmen- tal elements on the basis of the order of magnitude of the limit values. To determine the confined values of the intervals, the lowest (most severe) and highest (mildest) limit values should be sought in the specifications and classified in the appropriate categories of magnitude. The other limit values should be ranked between those two
Figure 2:Weights of the various environmental elements
predefined confined values. The environmental parame- ters are classified by fitting a natural logarithmic curve as can be seen inFig. 2, where thexandyaxes indicate the magnitude and weight of the environmental parameters, respectively. Weights of 1 and 0.01 represent the most se- vere and mildest situations, respectively. The equations of the aligned curves are given inFig. 2 by taking into consideration environmental elements (according to Hun- garian regulations, the same magnitudes are assigned to certain environmental elements).
Fig. 2presents the relationship between the air, bodies of surface water, soil and groundwater. Using the equa- tions given inFig. 2, weights, presented inTable 1, can be generated for the given environmental parameters. In the case of surface water, the limit value of PO4-P is200µg/l, which belongs to the order of magnitude of102, there- fore, its value is0.122. In the case of mercury, the limit value is0.05µg/l, which can be assigned to the order of magnitude of10−2, therefore, its value is0.505.
Table 1:Weights according to orders of magnitude Orders of magni-
tude of the envi- ronmental parame- ters studied
Expo- nent of 10
WA WW&S WG&L
0.000001 -6 1 *o.r. *o.r.
0.00001 -5 0.714 *o.r. *o.r.
0.0001 -4 0.546 1 1
0.001 -3 0.427 0.687 0.714
0.01 -2 0.335 0.505 0.546
0.1 -1 0.26 0.375 0.427
1 0 0.196 0.274 0.335
10 1 0.141 0.192 0.26
100 2 0.093 0.122 0.196
1,000 3 0.049 0.062 0.141
10,000 4 0.010 0.010 0.093
100,000 5 *o.r. *o.r. 0.01
*o.r.: outside the range of interpretation
Figure 3:The qualifying diagram of an environmental ele- ment on the basis of the quality factor (FPi), quality index (IPi) and quality indicator (∆Pi) of the environmental pa- rameter
2.2 Analysis of Parameters
In order to better understand the status of environmental elements, a visualization technique has been developed where the pollution/environmental load of an environ- mental element is represented by circles of defined radii and areas (Fig. 3). As a result, the parameters describing the environmental elements can be represented by seg- ments of a circle (hereinafter referred to as “segment”).
The following basic considerations were taken into con- sideration: the radii of the different segments are the ra- tios of the measured parameters to limit values expressed as percentages, referred to as the so-called environmental parameter quality index.
Environmental parameter quality index (IPi)
The environmental parameter quality index (IPi) speci- fies the relationship between the immission concentration and limit values defined by the environmental specifica- tions.IPiis determined by
IPi= MVi LVi
100 (1)
whereIPi is the environmental parameter quality index for parameter i,MVi is the measured value of environ- mental parameteri, andLViis the limit value of environ- mental parameteri.
If the value ofIPichanges between 0 and 100%, the environmental parameter meets the legal specifications.
However, if it exceeds 100%, the limit value is exceeded and mitigation measures must be considered.
Environmental parameter quality factor (FPi) The environmental parameter quality factor (Pi) is deter- mined on the basis of the weight. The central angles (FP1, FP2,FP3) of the circle as depicted inFig. 3are calculated by
FPi=Wi
360 PnPj
l=1Wl
(2)
Figure 4:Immission analysis as a function of the environmental parameter quality index and factor
whereFPi is the environmental parameter quality factor for environmental parameteri,Wlis the weight of the ex- amined environmental parameter, andnPj is the number of environmental parameters in the case of environmental elementi.
Environmental parameter quality indicator (∆Pi) The environmental parameter quality indicator (∆Pi) is given by
∆Pi= (IPi)2πFPi
360 (3)
where∆Piis the environmental parameter quality indica- tor for environmental parameteri,IPiis the environmen- tal parameter quality index for environmental parameteri (according toEq. 1), andFPiis the environmental param- eter quality factor for environmental parameteri(accord- ing toEq. 2). The environmental parameter quality index for environmental parameteriis of square/quadratic form to emphasize the importance of the measured concentra- tion of the parameter.
According to this interpretation, the different param- eters with different units can be compared to each other so the environmental parameters can be easily qualified whether they exceed the limit values or fall within them.
The central angles of the segments (FP1,FP2,FP3) rep- resent the importance of the environmental parameter in question which is expressed as the environmental param- eter quality factor as defined byEq. 2.
RegardingFig. 3, the expression of the environmen- tal parameter quality indicator is introduced based on the
area of the segment (Eq. 3), which represents the extent to which the environmental parameter has an impact on the environmental element.
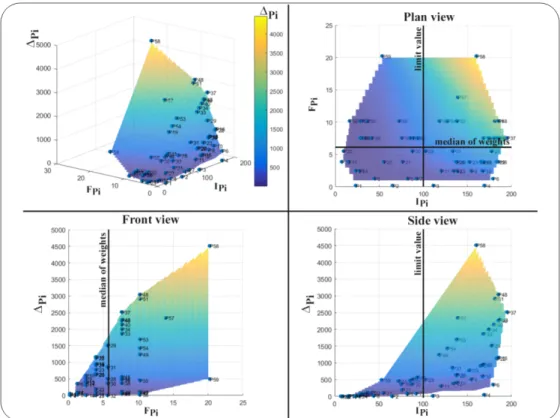
Immission analysis
The environmental parameters defined above can be illus- trated in a three-dimensional system, therefore, the key parameters of the studied impact area identified.Fig. 4 illustrates the environmental parameter quality indicators (∆Pi) as a function of the environmental parameter qual- ity factor (FPi) and the environmental parameter quality index (IPi).Fig. 4shows the environmental parameters, their risks and the environmental damage caused should their values be extreme. According to the Informative En- vironment Qualifying Index method, the risk is a function of the specified limit value or target.
The following conclusions can be drawn on the ba- sis ofFig. 4. The area (Xmin;Ymin;Zmin) represents the group of environmental parameters for which the limit values are mildest and present in low concentrations, therefore, their negative impact on the environment is minimal.
The point (Xmax;Ymax;Zmax) represents the group of environmental parameters for which the limit values are most severe and present in high concentrations, there- fore, their negative impact on the environment is maxi- mal.
According to the protocol defined here, the key fac- tors can be identified on the basis of a system-oriented method and the outcome of the analysis used for plan-
Figure 5:The relationship between the load of the envi- ronmental element and the reference areas
ning the environmental mitigation measures.
2.3 Analysis of the Environmental element level
The analysis of the environmental element level provides information to specialists about the cumulative impact of the environmental parameters on the environmental ele- ment in question.
Load of environmental elements (ELj)
The cumulative environmental impacts of the environ- mental elements can be determined by totalling the envi- ronmental parameter quality indicators (∆Pi), which are equal to the sum of the areas of the segments. The envi- ronmental element can be interpreted as a circle and the total levels of pollution stemming from the environmental parameters are represented by circles with different radii (Fig. 5).
InFig. 4, the circle withR= 100represents the case when the load of the environmental element is equal to the total limit load of the environmental parameters.
Qualification of environmental elements
For the numerical evaluation of an environmental ele- ment, the relationships required are defined inTable 2.
On the basis of the outcome of case studies and pro- fessional experience, 10 categories were defined for the environmental evaluation: 10-30-50-70-90-100-110-150- 200-300.
In Fig. 5, blue-coloured zones mark the acceptable categories (categories in Table 2: 10, 30 and 50), the green-coloured zones represent maximum environmen- tal quality with regard to immission limit values (cate- gories 70, 80 and 100), and the orange- as well as yellow- coloured zones represent situations when the level of pol- lution exceeds the limit value (categories 110, 150, 200 and 300).
Given these defined categories, the relative radius can be calculated from which, after working out the area of
the circle (AS = R2π), the corresponding area can be determined (AS). This corresponding area can be interre- lated to the load of the environmental parameters studied, that is to the total area of the segments (ELj) representing the environmental parameters.
From the load of the environmental parameters, the total area can be calculated by a numerical evaluation.
The qualification/level of pollution of the environmental element can be determined from Table 2. The interval when the Load of the Environmental Element (ELj) is less than the reference area (AS) needs to be determined.
Table 2can be used generally to evaluate all environ- mental elements and is independent from the number of environmental parameters with regard to the environmen- tal elements since the environmental parameter quality factors (Flip) are normalized for 360◦. The values of the environmental parameter quality factors depend on the number of environmental parameters and their weights.
Theoretical Number of Environmental Parameters (ntj)
The theoretical numbers of environmental parameters de- fine the number of environmental parameters to be mea- sured as well as monitored according to the stipulations and are based on the reference database. They are sum- marized inTable 3:
Practical Number of Environmental Parameters (npj) During the environmental impact assessment, specialists define the environmental elements to be studied and the scope of the environmental parameters. The set of envi- ronmental parameters can be different in the case of a natural environment, post-disaster situation or artificial environment. The method puts a special emphasis on the determination of the uncertainties.
Element Quality Index (IEj)
The element quality index determines how the immission concentrations are related to the pollutants to be theoreti- cally released into the environment:
IEj= rELj
π (4)
whereIEjis the element quality index for environmental elementjandELjis the environmental load of environ- mental elementj.
Element Quality Factor (FEj)
The element quality factor (FEj) specifies the weight of the environmental element during the evaluation process.
The goal of this factor is to take the number of environ- mental parameters into consideration (Eq. 7):
FEj = npj360 Pm
k=1ntk
(5)
Table 2:The qualification system for evaluating the different environmental elements
Reference radius (R) Reference area (AS) Evaluation
300 282743 The environmental element is seriously damaged which the ecosystem cannot tolerate.
200 125664 Natural regeneration is impossible because the environmental element is seriously damaged.
150 70686 Natural regeneration is inhibited because the environmental element is damaged.
110 38013 The concentrations of the environmental parameters defining the environmental element exceed the limit value.
100 31416 The concentrations of the environmental parameters defining the environmental element are equal to the limit values.
90 25447 The concentrations of the environmental parameters defining the environmental element are close to the limit value.
70 15394 The environmental element with environmental parameters below the limit value or influenced by anthropogenic impacts.
50 7854 The environmental element with minimal disturbances.
30 2827 The natural environmental element with indirect or direct anthropogenic impacts.
10 314 The natural environmental element free of anthropogenic impacts.
whereFEjis the element quality factor for environmental elementj,npj is the practical number of environmental parameters in the case of environmental elementj,ntk
is the theoretical number of environmental parameters in the case of environmental elementj(Table 3), andmis the number of environmental elements.
Environmental Element Informativity Rate (FIj) The environmental element informativity rate (FIj) repre- sents the ratio of the number of theoretical environmental parameters (ntk) for which legal requirements are in ef- fect to the number of investigated environmental parame- ters. The ideal value of the environmental element infor- mativity rate is equal to when all parameters set forth by the legal stipulations are involved in the investigation:
FIj= npj
ntk (6)
whereFIjis the environmental element informativity rate for environmental elementj,npjis the practical number of environmental parameters in the case of environmental elementj, andntk is the theoretical number of environ- mental parameters in the case of environmental element k(Table 3).
2.4 Environmental analysis
The next step to be undertaken, following the investiga- tion of the environmental parameters and elements, is the comprehensive analysis of the whole environment. The whole environmental system should be evaluated by tak- ing the human, health, social, economic and cultural as-
Table 3:The theoretical numbers of environmental param- eters (ntk) for different environmental elements
Environmental element Theoretical number of environmental parame- ters (pcs)
Surface water: water flow 59 Surface water: lake 59
Groundwater 58
Soil 52
Air 33
pects into consideration in an integrated way. It is insuf- ficient to solely focus on the natural or artificial environ- ment. The usability of a given project area depends on several factors, not only on the excellence of one environ- mental element. Therefore, a holistic approach is adopted during the evaluation.
Element Quality Indicator (∆Ej)
The element quality indicator (∆Ej) enables the environ- mental element to be taken into consideration in light of the weights of the environmental parameters that de- scribe the environmental element. Those environmental elements which are monitored less contribute to a lesser extent with regard to the characterization of the environ- ment. During the analysis, the cumulative load of the en- vironmental elements is taken into account:
∆Ej =IEj2 πFEj
360 (7)
where∆Ej is the element quality indicator for environ- mental element j,IEj is the element quality index for environmental element j (according toEq. 4), andFEj is the element quality factor for environmental elementj (according toEq. 5).
Total Environmental Load (TL)
The total environmental load (TL) represents the propor- tional pollution of the whole environment, which can be generated by the summation of the element quality indi- cators (∆EQj). The environmental load is regarded as the most important issue during the calculation of the infor- mative environment qualifying index (IIEQ) as defined by
TL=
m
X
j=1
∆Ej (8)
whereTLis the Total Environmental Load,∆Ejis the El- ement Quality Indicator for environmental elementj(ac- cording toEq. 7), andmis the number of environmental elements.
Table 4:Evaluation table of the whole environment
Reference radius (R) Dynamical reference area (AD) Evaluation
300 3002πFEnv.I Degraded area which the ecosystems cannot accommodate.
200 2002πFEnv.I The natural regeneration of the environment is impossible because the area is severely damaged.
150 1502πFEnv.I Natural regeneration is inhibited because of the damaged area.
110 1102πFEnv.I The concentration of the environmental parameters exceeds the limit value.
100 1002πFEnv.I The concentration of the environmental parameters is equal to the limit value.
90 902πFEnv.I The concentration of the environmental parameters is similar to the limit value.
70 702πFEnv.I The environment is influenced by levels of pollution under the limit value and directly influenced by anthropogenic impacts.
50 502πFEnv.I The environment closely resembles the natural conditions or with minimal disturbances.
30 302πFEnv.I The natural environment with direct or indirect anthropogenic impacts.
10 102πFEnv.I The natural environment free of anthropogenic impacts.
Qualification of the total environment
Table 4is used to evaluate the total environment, which is based on dynamical reference areas as calculated from AD=R2πFEnv.I (9) whereAD is the dynamical reference area (the level of the whole environment),Ris the reference radius (Table 4), andFEnv.Iis the environment informativity rate (Eq.
10).
The basis of the dynamical reference area is the ref- erence radius (Fig. 5andTable 2) by which 10 different categories of quality were defined. The dynamical refer- ence area depends on the ratio of the studied environmen- tal parameters to the theoretical number of environmental parameters (informativity defined in the method).
The numerical assessment of the whole environment results in the element quality indices from the environ- mental load stemming from the total environmental pa- rameters for the environmental elements. The evalua- tion of Table 4 concerns the results in terms of qual- ity/pollution during the interval, in which case the value of the total environmental load (TL) is less than the dy- namical reference area (AD).
Environment Informativity Rate (FEnv.I)
The environment informativity rate (FEnv.I) shows the depth of monitoring with regard to the environmental el- ements during the environmental evaluation:
FEnv.I= Pm
j=1npj
Pm
k=1ntk (10)
whereFEnv.I is the environment informativity rate,npj
is the practical number of environmental parameters in the case of environmental elementj,ntk is the theoret- ical number of environmental parameters in the case of environmental elementk, (Table 3), andmis the number of environmental elements.
The environment informativity rate (FEnv.I) indicates the coverage of the environmental parameters used in the investigation compared to the specified environmental pa- rameters. The environmental impact assessment is more informative if the scope of the environmental parameters is larger.
npjlim→ntk
(FEnv.I) = 1 (11)
According toEq. 11, the value ofFEnv.Iapproaches1if the practical number of environmental parameters (npj) closely resembles the theoretical number of parameters (ntk).
Informative Environment Qualifying Index (IIEQ) The final outcome of the method that is elaborated on is the informative environment qualifying index, which is a complex indicator (Eq. 12). The status of the environ- ment is determined on the basis of the load of the dif- ferent environmental elements and the informativity. Its value depends on the actual load of the environmental el- ements as well as the practical and theoretical numbers of environmental parameters.
From the reference radius ofTable 4during the evalu- ation,IIEQdetermines the accurate radius of the area de- rived from the actual load of the environmental elements:
IIEQ=
r TL
πFEnv.I
(12) whereIIEQis the informative environment qualifying in- dex,TLis the total environmental load (Eq. 8), andFEnv.I
is the environment informativity rate (Eq. 10).
The application of the informative environment qual- ifying index provides a solid basis to compare the out- comes of different environmental evaluations since cer- tain cases can differ from each other regarding the param- eter sets.IIEQincludes all these variables. The method can be expediently used to evaluate the environment be- fore and after a disaster (e.g. the red mud disaster of De- vecser), and the outcomes of the studies can be evaluated as a function of time. The method provides an opportu- nity to compare different cases (industrial parks, settle- ments, the natural environment) as well as provides a sys- temized and comprehensive approach to the evaluation.
2.5 A case study
Zirc is a small city in the heart of the Bakony Mountains in western Hungary. The city and its surroundings is a dis- tinguished touristic area in Hungary with several natural attractions. An arboretum and National Parks are situated in the direct vicinity of the city. The water quality of the Cuha Stream which flows through the city is influenced
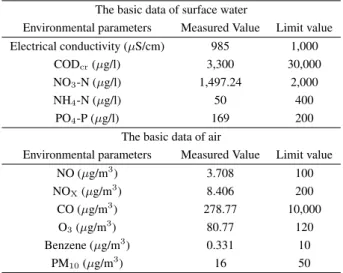
Table 5: The measured parameters of Zirc on June 13, 2016
The basic data of surface water
Environmental parameters Measured Value Limit value Electrical conductivity (µS/cm) 985 1,000
CODcr(µg/l) 3,300 30,000
NO3-N (µg/l) 1,497.24 2,000
NH4-N (µg/l) 50 400
PO4-P (µg/l) 169 200
The basic data of air
Environmental parameters Measured Value Limit value
NO (µg/m3) 3.708 100
NOX(µg/m3) 8.406 200
CO (µg/m3) 278.77 10,000
O3(µg/m3) 80.77 120
Benzene (µg/m3) 0.331 10
PM10(µg/m3) 16 50
by the wastewater treatment plant located here. The pop- ulation of Zirc is7,106 and the main economic activity in the region is agriculture.
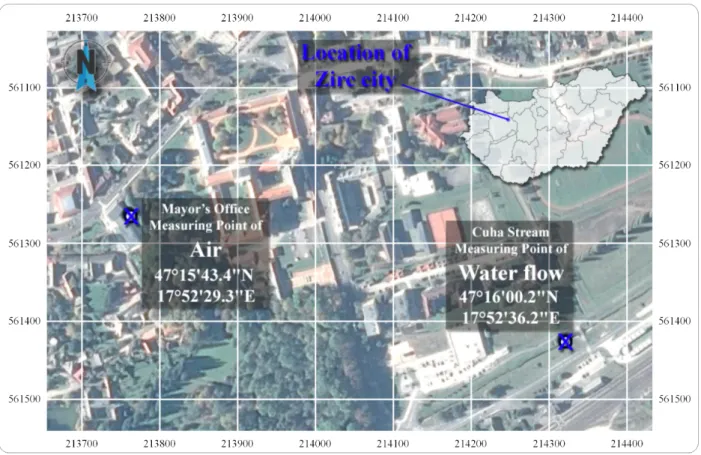
During the field studies in the summer of 2016, two environmental elements were measured, namely surface water and air. The location of the measurement points is shown inFig. 6.
In the case of surface water and air, the environmen- tal parameters as defined inTable 5were measured. The weights as well as quality indices, quality factors and quality indicators of parameters were determined and are summarized inTables 6and7. FPi in the last rows ofTa- bles 6and7are used as a control since their total value must be equal to 360. Values ofELj, as defined inTable 2, constitute the basis of the numerical evaluation.
The value of the parameter quality index for the envi- ronmental parameter PO4-P calculated on the basis ofEq.
1is illustrated below. The measured value of the param- eter PO4-P was169mg/l and the limit value pertained to it was200mg/l [30].
IPPO4−P= 169(mgl )
200(mgl )100 = 84.5
The parameter quality factor for the environmental pa- rameter PO4-P is determined on the basis ofEq. 2. The weight of PO4-P is0.12and the five numbers in the de- nominator include the weight of the five environmental parameters of water.
FPPO4−P = 0.12·360
0.06+0.01+0.06+0.12+0.12 = 116.22 The values ofIPiandFPicalculated for the environmen- tal parameters listed inTables 6and7constitute the basis of the calculation. Parts A and B ofFig. 7 refer to the surface water and air, respectively.
On the basis of the parametric analysis of surface wa- ter, it can be concluded that the maximum limit value is defined for PO4-P. Therefore, in the following steps, the
maximum weight (FPi=max) is assigned to PO4-P. The electrical conductivity is close to the limit value and the parameter quality index of NO3-N is∼75%. These pa- rameters are key to improve the water quality in Zirc and are represented by circles inFig. 7. A similar analysis of air was also carried out.
For the environmental parameter PO4-P, the parame- ter quality indicator is based onEq. 2using the param- eter quality index (84.50) and parameter quality factor (116.22):
∆PPO4−P = 84.52·3.14·116.22
360 = 7,241.59 The quantitative analysis of the environmental elements of surface water and air is depicted inFig. 8. Parts A and B ofFig. 8refer to the surface water and air, respectively.
The weights of the environmental parameters can be seen inFig. 8during the evaluation procedure (the total of the interior angles of the segments is equal toFPi). The radii of the sectors are identical to the values ofIPiwhich provide information on the quality. The load of the envi- ronmental element (ELW) of the surface water is equal to15,296. The qualification system for evaluation of the different environmental elements (Table 2) functions by substitution. An assignment in the category of R = 50 (environmental element with minimal disturbances, Ta- ble 2is obtained. It can be concluded that the water qual- ity of the Cuha Stream was disturbed to a minimal extent.
Nevertheless, the ecosystem can tolerate this level of pol- lution.
By applying Eq. 4, the values of the environmental quality index express the actual loads of the environmen- tal elements. On the basis of measurements in Zirc, the five parameters for surface water represent an area,IEW, equal toR= 69.78, while the six environmental param- eters for air represent an area,IEA, ofR= 31.58:
IEW=
r15,295.6
3.14 = 69.78 IEA=
r3,132.57
3.14 = 31.58
Following these steps, the aforementioned algorithm was followed. The element quality factors for water and air, FEWandFEA, were calculated according to the theoret- ical number of environmental parameters, altogether 92 parameters are to be monitored according to the specifi- cations of GD 2010 [30] and GD 2011 [32]. In the case studies for surface water and air, five and six environmen- tal parameters were investigated, respectively.
FEW= 5·360
92 = 19.57 FEA=6·360
92 = 23.48
Next, the environmental element informativity rate was determined. The environmental element informa- tivity rates for surface water and air are 0.08 and
Figure 6:The measuring points and location of Zirc in Hungary
Table 6:The results of the calculations (Eqs. 1-3) for all measured parameters in the case of surface water from Cuha Stream, Zirc
Parameter (unit) Measured value Limit value Wi IPi FPi ∆Pi
Electrical conductivity (µS/cm) 985 1,000 0.06 98.5 59.03 4,998.33
COD (mg/l) 3,300 30,000 0.01 11 9.5 10.03
NO3-N (mg/l) 1,497.24 2,000 0.06 74.86 59.03 2,887.19
NH4-N (mg/l) 50 400 0.12 12.5 116.22 158.47
PO4-P (mg/l) 169 200 0.12 84.5 116.22 7,241.59
Total *n/a *n/a *n/a *n/a 360 ELW= 15,296.6
*n/a: not applicable
Table 7:The results of the calculations (Eqs. 1-3) for all measured environmental parameters in the case of air in the vicinity of the Mayor’s Office, Zirc
Parameter (unit) Measured value Limit value Wi IPi FPi ∆Pi
NO2(µg/Nm3) 3.71 100 0.09 3.71 58.45 7.01
NOX(µg/Nm3) 8.41 200 0.09 4.2 58.45 9.01
CO (µg/Nm3) 278.77 10,000 0.01 2.79 6.32 0.43
O3(µg/Nm3) 80.77 120 0.09 67.31 58.45 2,310.77
Benzene (µg/Nm3) 0.33 10 0.14 3.31 89.17 8.53
PM10(µg/Nm3) 16 50 0.14 32 89.17 796.83
Total *n/a *n/a *n/a *n/a 360 ELA= 3,132.57
*n/a: not applicable
Figure 7:Immission analysis of the surface water (left-hand side, Part A) and air (right-hand side, Part B)
Figure 8:The quantitative analysis of the environmental elements (left-hand side: water, Part A; right-hand side: air, Part B)
0.18, respectively. It should be noted that the to- tal of FEQW/FEIW = 19.57/0.08 = 230.87) and FEQA/FEIA= 23.48/0.18 = 129.13) is equal to 360.
FIW = 5
59 = 0.08 FIA= 6
33 = 0.18
On the basis ofEq. 7, the load of the whole environment (∆Ej) can be calculated using the actual load of the en- vironmental elements. The actual load is substituted into the equation in the square/quadratic form, whilenpj/ntj
for the informativity is linear.
∆EW =69.782·3.14·19.57
360 = 831.28
∆EA=31.582·3.14·23.48
360 = 204.3
The total load of the environment is equal to the total of the summarized loads of the environmental elements (Eq.
8). In the case of Zirc, the larger proportion of environ- mental load stems from the surface-water pollution and the load of the air pollution represents roughly20%.
TL = 831.28 + 204.3 = 1,035.58
The whole environment can be evaluated by the dynami- cal reference areas as given byEq. 9andTable 4.
By substitutingTLintoTable 4, it can be stated that the parameters describing the status of the environment are close to the concentrations of limit values. The radius assigned to the environmental quality of the city is equal toR= 50.
A50= 502·3.14·0.12 = 939
In the aforementioned formula, the radius is equal to50, representing the worst category of quality. The environ- mental element informativity rate is0.12(Eq. 10) which provides information on the number of environmental pa- rameters in the study.
FEnv.I = 5 + 6
59 + 33 = 0.12
The Informative Environment Qualifying Index (IIEQ) is calculated on the basis ofEq. 12:
IIEQ=
r 1,035.58
3.14·0.12 =52.51
IIEQof Zirc is52.51. By substituting this value intoTa- ble 4, it can be seen that the environmental parameters
describing the status of the environment closely resemble the natural conditions with minimal disturbances. Spe- cialists agree with the results, which are supported by the outcome of the field study.
3. Conclusion
The novelty of the Informative Environment Qualifying Index method is that the maximum environmental loads of the environmental parameters as stipulated in the legal specifications and the actually measured/calculated lev- els of pollution are taken into consideration when com- pared to the methods published in the literature. Dur- ing the evaluation, the algorithm is applied at different levels, namely at the levels of environmental parame- ters, environmental elements and the total environment, to expediently elaborate on the planning of environmen- tal mitigation measures. The quantitative methods used in the environmental impact assessment procedure in- clude several subjective components during the weight- ing/ranking/scaling which could result in different inter- pretations with regard to the outcome of the evaluation.
The Informative Environment Qualifying Index method is based on the specifications of national regulations, while the weight of the environmental elements depends on their status and the number of environmental parame- ters included in the study.
The Informative Environment Qualifying Index method is suitable for following up and monitoring the status of the environment in the cases of protected areas, national parks, urban areas, disasters, etc. The applicabil- ity of the method was demonstrated in the case of Zirc, a small city in the heart of the Bakony Mountains in west- ern Hungary.
The scope of the evaluation ranges from the cat- egory “environment close to the natural conditions or with minimal disturbances” to “natural environmental el- ements with indirect or direct anthropogenic impacts”.
The method casts light on the significant environmental impacts without concealing extreme situations nor dis- torting the final conclusions.
Acknowledgement
The financial support of Széchenyi 2020 under project GINOP-2.3.2-15-2016-00016 is acknowledged. The fi- nancial support of Széchenyi 2020 under the project EFOP-3.6.1-16-2016-00015 is acknowledged.
Nomenclature
∆Ej Quality indicator for environmental elementj
∆Pi Quality indicator for environmental parameteri
A Subscript, air
AD Dynamical reference area (level of the total environment)
AS Reference area (level of the environmental elements)
ELj Environmental element load of environmental elementj
FEj Quality factor for environmental elementj FEnv.I Informativity rate of total environment FIj Informativity rate of environmental elementj FPi Quality factor for environmental elementi
G Subscript, groundwater
IEj Quality index for environmental elementj IIEQ Informative environment qualifying index IPi Quality index for environmental elementi
L Subscript, surface water: lake
Lvi Limit value of environmental parameteri m Number of environmental elements
Mvi Measured value of environmental parameteri npj Practical number of parameters in the case
of elementj
ntk Theoretical number of parameters in the case of elementk
R Reference radius
S Subscript, soil
TL Total environmental load
W Subscript, surface water: water flow
Wi,Wl Weights of environmental parametersiandl REFERENCES
[1] Kılkı¸s, ¸S.: Composite index for benchmark- ing local energy systems of Mediterranean port cities, Energy, 2015, 92(3), 622–638 DOI:
10.1016/j.energy.2015.06.093
[2] Kılkı¸s, ¸S.: Sustainable development of energy, water and environment systems index for Southeast Euro- pean cities,J. Cleaner Prod.,2016,130(1), 222–234
DOI: 10.1016/j.jclepro.2015.07.121
[3] Sebestyén, V.; Somogyi V.; Utasi A.: Adapting the SDEWES index to two Hungarian cities,Hung. J.
Ind. Chem.,2017,45(1), 49–59DOI: 10.1515/hjic-2017- 0008
[4] Toro, J.; Requena, I.; Duarte, O.; Zamorano, M.:
A qualitative method proposal to improve environ- mental impact assessment,Environ. Impact Assess.
Rev.,2013,43, 9–20DOI: 10.1016/j.eiar.2013.04.004
[5] Pavlickova, K.; Vyskupova, M.: A method pro- posal for cumulative environmental impact assess- ment based on the landscape vulnerability evalua- tion,Environ. Impact Assess. Rev.,2015,50, 74–84
DOI: 10.1016/j.eiar.2014.08.011
[6] Herva, M.; Roca, E.: Review of combined ap- proaches and multi-criteria analysis for corporate environmental evaluation,J. Cleaner Prod., 2013, 39, 355–371DOI: 10.1016/j.jclepro.2012.07.058
[7] Carvalho, A.; Milmoso, A. F.; Mendes, A.N.;
Matos, H. A.: From a literature review to a frame- work for environmental process impact assessment index, J. Cleaner Prod., 2014, 64, 36–62 DOI:
10.1016/j.jclepro.2013.08.010
[8] Caeiro, S.; Vaz-Fernandes, P.; Martinho, A. P.;
Costa, P. M.; Silva, M. J.; Lavinha, J.; Matias-Dias, C.; Machado, A.; Castanheira, I.; Costa, M. H.: En- vironmental risk assessment in a contaminate es- tuary: An integrated weight of evidence approach as a decision support tool,Ocean Coastal Manage., 2017,143, 51–62DOI: 10.1016/j.ocecoaman.2016.09.026
[9] Phillips, J.: A quantitative-based evaluation of the environmental impact and sustainability of a pro- posed onshore wind farm in the United King- dom,Renewable Sustainable Energy Rev.,2015,49, 1261–1270DOI: 10.1016/j.rser.2015.04.179
[10] Phillips, J.; Gholamalifard, M.: Quantitative evalu- ation of the sustainability or unsustainability of mu- nicipal solid waste options in Tabriz, Iran. Int. J.
Environ. Sci. Technol.,2016,13(6), 1615–1624DOI:
10.1007/s13762-016-0997-0
[11] Robu, B. M.; Jitar, O.; Teodosiu, C,; Strungaru, S.
A.; Nicoara, M.; Plavan, G.: Environmental impact and risk assessment of the main pollution sources from the romanian black sea coast, Environ. Eng.
Manage. J., 2015,14(2), 331–340, http://eemj.
eu/index.php/EEMJ/article/view/2184
[12] Sun, R.; Wang, Z,: A comprehensive environmen- tal impact assessment method for shale gas develop- ment,Nat. Gas Ind. B,2015,2(2-3), 203–210DOI:
10.1016/j.ngib.2015.07.012
[13] Robu, B. M.; Bulgariu, D.; Bulgariu, L.; Macov- eanu, M.: Quantification of impact and risk induced in surface water by heavy metals: case study – Bahlui River Iasi,Environ. Eng. Manage. J.,2008, 7(3), 263–267 http://eemj.eu/index.php/EEMJ/
article/view/417
[14] Robu, B. M.; C˘aliman, F. A.; Be¸tianu, C.;
Gavrilescu, M.: Methods and procedures for envi- ronmental risk assessment,Environ. Eng. Manage.
J., 2007, 6(6), 573–592 http://eemj.eu/index.
php/EEMJ/article/view/371
[15] Dee, N.; Baker, J.; Drobny, N.; Duke, K.;
Whitman, I.; Fahringer, D.: An environmental evaluation system for water resource planning, Water Resour. Res., 1972, 9(3), 523–536 DOI:
10.1029/WR009i003p00523
[16] Ferreira, A. P.; da Cunha, C. L. N.; Kling, A.
S. M.: Environmental evaluation model for wa- ter resource planning. Study case: Piabanha hydro- graphic basin, Rio de Janeiro, Brazil,Revista Elek- toronicado Promeda.,2008,2(1), 7–18
[17] Foden, J.; Rogers, S. I.; Jones, A. P.: A critical re- view of approaches to aquatic environmental assess- ment,Mar. Pollut. Bull., 2008,56(11), 1825–1833
DOI: 10.1016/j.marpolbul.2008.08.017
[18] Yu, C.; Yin, X.; Li, Z.; Yang, Z.: A universal cali- brated model for the evaluation of surface water and groundwater quality: Model development and a case study in China,J. Environ. Manage.,2015,163, 20–
27DOI: 10.1016/j.jenvman.2015.07.011
[19] Wu, J.; Pu, G.; Ma, Q.; Qi, H.; Wang, R.:
Quantitative environmental risk assessment for the iron and steel industrial symbiosis network, J. Cleaner Prod., 2017, 157, 106–117 DOI:
10.1016/j.jclepro.2017.04.094
[20] Han, R.; Zhou, B.; An, L.; Jin, H.; Ma, L.; Li, N.;
Xu, M.; Li, L.: Quantitative assessment of enter- prise environmental risk mitigation in the context of Na-tech disasters,Environ. Monit. Assess.,2019, 191(4), 1–13DOI: 10.1007/s10661-019-7351-1
[21] Meex, E.; Hollberg, A.; Knapen, E.; Hildebrand, L.; Verbeeck, G.: Requirements for applying LCA- based environmental impact assessment tools in the early stages of building design, Build. Environ., 2018,133, 228–236DOI: 10.1016/j.buildenv.2018.02.016
[22] Rocha, C. A.; Sousa, F. W.; Zanella, M. E.; Oliveira, A. G.; Nascimento, R. F.; Souza, O. V.; Cajazeiras, I. M. P.; Lima, J. L. R.; Cavalcante, R. M.: Environ- mental quality assessment in areas used for physi- cal activity and recreation in a city affected by in- tense urban expansion (Fortaleza-CE, Brazil): Im- plications for public health policy,Environ. Sci. Pol- lut. Res., 2017,9(3), 169–182DOI: 10.1007/s12403-016- 0230-x
[23] Németh, J.; Sebestyén, V.; Juzsakova, T.; Domokos, E.; Dióssy, L.; Le Phuoc, C.; Huszka, P.; Rédey, Á.: Methodology development on aquatic environ- mental assessment.Environ. Sci. Pollut. Res., 2017, 24(12), 11126–11140DOI: 10.1007/s11356-016-7941-1
[24] Sebestyén, V.; Németh, J.; Juzsakova, T.; Domokos, E.; Kovács, Zs.; Rédey, Á.: Aquatic environmental assessment of Lake Balaton in the light of physical- chemical water parameters, Environ. Sci. Pollut.
Res., 2017,24(32), 25355–25371DOI: 10.1007/s11356- 017-0163-3
[25] Sebestyén, V.; Németh, J.; Juzsakova, T.; Domokos, E.; Rédey, Á.; Lake Balaton: Water Quality of the Largest Shallow Lake in Central Europe, Encyclo- pedia of Water: Science, Technology, and Society, 2019, 1–15DOI: 10.1002/9781119300762.wsts0063
[26] Jiang, L.; Zhou, H.; Bai, L.; Zhou, P.: Does foreign direct investment drive environmental degradation in China? An empirical study based on air quality index from a spatial perspective, J. Cleaner Prod., 2018,176, 864–872DOI: 10.1016/j.jclepro.2017.12.048
[27] Wang, D.; Wei, S.; Luo, H.; Yue, C.; Grunder, O.: A novel hybrid model for air quality in- dex forecasting based on two-phase decomposi- tion technique and modified extreme learning ma-
chine,Sci. Total Environ., 2017,580, 719–733DOI:
10.1016/j.scitotenv.2016.12.018
[28] Zuhaib, S.; Manton, R.; Griffin, C.; Hajdukiewicz, M.; Keana, M. M.; Goggins, J.: An Indoor Envi- ronmental Quality (IEQ) assessment of a partially- retrofitted university building, Build. Environ., 2018,139, 69–85DOI: 10.1016/j.buildenv.2018.05.001
[29] Sanz-Garcia, M. T.; Caselles Moncho, A.; Micó Ruiz, J. C.; Soler Fernández, D.: Including an en- vironmental quality index in a demographic model, Int. J. Global Warming 2016,9(3), 362–396DOI:
10.1504/IJGW.2016.075448
[30] Sebestyén, V.; Somogyi, V.; Sz˝oke, Sz.; Utasi, A.:
Adapting the SDEWES index to two Hungarian cities,Hung. J. Ind. Chem., 2017,45(1), 49–59DOI:
10.1515/hjic-2017-0008
[31] GD (2010) Government Decree No. 10/2010. (VIII.
18.) of Ministry of Rural Development (VM) defin- ing the rules for establishment and use of water pol- lution limits of surface water (in Hungarian) [32] GD (2006) Joint Government Decree No. 6/2009.
(IV. 14.) of Ministry of Health and Ministry of Agriculture and Rural Development (KvVM-EüM- FVM) from the limit values and the measurement of pollutants for the protection from pollution of soil and groundwater (in Hungarian)
[33] GD (2011) Government Decree No. 4/2011. (I. 14.) of Ministry of Rural Development (VM) from the ambient air quality limit values and the emission limit values of stationary point sources of air pol- lutants (in Hungarian)