Article
Soil CO 2 and N 2 O Emission Drivers in a Vineyard (Vitis vinifera) under Different Soil Management Systems and Amendments
Ágota Horel * ID, Eszter Tóth, Györgyi GelybóID, Márton Dencs ˝o and Imre Potyó
Institute of Soil Sciences and Agricultural Chemistry, Centre for Agricultural Research, Hungarian Academy of Sciences, Herman O. St. 15, Budapest 1022, Hungary; toth.eszter@agrar.mta.hu (E.T.);
gelybo.gyorgyi@agrar.mta.hu (G.G.); dencso.marton@agrar.mta.hu (M.D.); potyo.imre@agrar.mta.hu (I.P.)
* Correspondence: horel.agota@agrar.mta.hu; Tel.: +36-1-212-2265
Received: 21 April 2018; Accepted: 29 May 2018; Published: 31 May 2018 Abstract:Greenhouse gases emitted from agricultural soils entering the atmosphere must be reduced to decrease negative impacts on the environment. As soil management can have an influence on greenhouse gas emissions, we investigated the effects of different soil management systems and enhancer materials on CO2and N2O fluxes in a vineyard. Five treatments were investigated: (i) no-till management with no fertilizer addition as the control (C); (ii) tilled soil (shallow) with no fertilizer (T); (iii) tilled soil, no fertilizer, and biochar application (T + BC); (iv) tilled soil and manure addition (T + M); and (v) tilled soil, manure, and biochar application (T + M + BC). T treatment showed the highest overall N2O emission, while the lowest was observed in the case of T + M + BC, while manure and biochar addition decreased. Tillage in general increased overall CO2emissions in all treatments (T 26.7% and T + BC 30.0% higher CO2than C), while manure addition resulted in reduced soil respiration values (T + M 23.0% and T + M + BC 24.8% lower CO2than T). There were no strong correlations between temperatures or soil water contents and N2O emissions, while in terms of CO2
emissions, weak to moderately strong connections were observed with environmental drivers.
Keywords: greenhouse gases; tillage; fertilizer; organic manure; biochar; soil moisture;
soil temperature
1. Introduction
Anthropogenic activities have substantial impacts on soil systems from the local to global scale.
Storing a vast amount of carbon on different time scales, soils play a crucial role in regulating atmospheric CO2concentrations. Any disturbance (e.g., human activity) altering this storage capacity can have a huge effect on climate change, especially considering the feedbacks present in the earth system. Soil CO2emission mostly originates from plant roots and soil microbial communities, releasing approximately 50–77×1015gC year−1into the atmosphere via respiration [1,2]. Along with increased human activities and changing climatic conditions, it is predicted that longer droughts and extensive rainfalls will occur more frequently in temperate regions [3], accelerating the effects of human activities on agricultural soil systems. Therefore, the agricultural management systems utilizing different soil amendments should be carefully studied to assess any negative effects that might arise from short- to long-term agricultural practices.
Investigations related to greenhouse gases (GHGs), especially carbon dioxide (CO2), nitrous oxide (N2O), and methane (CH4), have been the focus of many studies during the last decades, as a continuing increase of greenhouse gas concentrations can cause unprecedented long-term effects in ecosystems via climate change [4–6]. Increasing atmospheric CO2concentration can, e.g., accelerate climate change.
Sustainability2018,10, 1811; doi:10.3390/su10061811 www.mdpi.com/journal/sustainability
Sustainability2018,10, 1811 2 of 15
Therefore, techniques to lessen N2O and CO2emissions need to be explored. Especially as a result of widespread fertilizer applications, agricultural activity accounts for 84% of global anthropogenic N2O emission [5], which is one of the most important ozone depleting substances. Consequently, lowering the amount that enters the atmosphere can enhance the recovery of the ozone layer [7].
Different agricultural techniques affecting CO2and N2O emissions are explored in the present paper, namely tillage systems, fertilizer amendments, and other soil enhancer material additions, i.e., grain husk biochar.
Soil temperature and soil moisture can be considered as two of the main abiotic driving factors of soil GHG emissions. Temperature increase is known to drive soil CO2emission [8–10], while soil water influences N2O emissions, especially in areas with a high water content and consequently where the denitrifying microorganisms dominate in the N2O process [11,12]. The influence of temperature and soil water content, and other factors such as soil pH or compaction, can also play key roles in regulating soil GHG emissions [12,13]; however, the influence of these factors concurrently might enhance their effects on terrestrial GHG emission.
The rate of soil GHG emissions can change over the plant growth phase, as plants require nutrients, water, sunlight etc. at different rates during their development. Most of the underlying phenomena are related to plants’ root systems. The state of the root system together with abiotic conditions influence the soil microbiological communities and their activity [14]. Hence both heterotrophic and autotrophic components of soil respiration change and fluctuate with growth stages and meteorological conditions. The roots of the vines are minimally active during winter (dormancy period). However, during spring the plants become more active, ready to develop shoots, leaves, and fruits. During the plant growth stages, soil respiration might change, governed by root respiration variations due to higher belowground biomass production. The significance of the leaf weight ratio in determining root respiration is undeniable [15]. To address this theory, the full vegetation growth can be divided into smaller time periods based on phenological observations, which can enable us to better understand the relationship between soil CO2emissions and plant development stages.
Generally, there are various results in regards to soil CO2emissions and soil management systems.
Tilled soils can emit more CO2compared to no till, as tillage provides a more favorable environment for the microorganisms in the soil to decompose organic residues [16–18]. However, this effect may be overridden by water availability. Other studies found the opposite results, as no-tilled soils showed higher respiration values in the long-term [9,19,20]. Soil N2O emission might be higher from tilled soils in the long-term, while short-term increases are still probable along with fertilizer induced N2O emissions [16,21,22]. Use of soil enhancer materials such as fertilizer treatments and their applications to agricultural soils are common practices in agricultural management systems.
In recent years, additional soil enhancers, such as biochar, have been gaining popularity as soil additives, where biochar addition to soils can enable higher crop and fruit yields and also serve as a potential mitigation strategy for GHG emission reduction. However, additions of charcoal and biochar to soils might influence soil hydrological [23–25] and microbial responses [26–28], consequently influencing soil GHG productions, which need to be assessed to provide a complete overview of cost efficiency considering all aspects [29,30]. Biochar application to agricultural soils might have promising outcomes on GHG mitigation, such as reductions of CO2, N2O, and CH4[31–33]. Biochar addition to soils can inhibit native carbon mineralization, which can result in reduced carbon emission [34,35].
However, biochar addition to soil might increase overall biochar-related soil CO2 emission [36], in addition to non-biochar-related soil respiration due to higher biomass production [37], consequently resulting in increased root respiration. The higher biomass contributes to higher GHG (especially N2O) emission, via its changing effect on the nitrogen cycle, specifically on the denitrifying processes.
Certain compounds of a biochar could suppress the activity of enzymes responsible for the conversion of NO3− to N2O. On the other hand, biochar could alter soil pH, which affects N2O reducing microorganisms [38]. Beside chemical and biological processes, N2O adsorption on biochar could be a decreasing factor of the emission [38]. Due to the biochar structural construction, it has a positive
effect on the soil water regime as biochar can result in an increased water holding capacity and higher available water content in the soil [39,40]. The balanced carbon and water availability in soils can therefore lead to higher plant productivity.
The objectives of the present study were to investigate changes in (i) soil water content, (ii) soil CO2
emissions, and (iii) soil N2O emissions during the grape vegetation period under various agricultural management systems and soil enhancer materials. We investigated how soil water, and soil and air temperature can influence the production of these greenhouse gases, which can enable us to make more precise gas emission calculations under different environmental conditions. We hypothesized that beside treatment types and environmental factors (such as soil moisture and temperature), the different time periods or seasonal effects corresponding to growth stages of the grapes can have an influence on both soil N2O and CO2emissions on a vineyard site.
2. Materials and Methods
2.1. Site Information, Experimental Setup, and Plant Growth Stages
Our study sites are located at the Balaton Uplands, Hungary (46.85037 N; 17.45955 E center coordinates, 146.9 m asl), where vineyards represent one of the most typical land use types. There is no agreement in the region regarding exact management options to be applied, hence farmers may or may not apply tillage, fertilizer, pesticides etc. The soil type is sandy loam (Cambisol, WRB) typically mixed with rocks. Due to its inadequate soil water regime, the use and potential effect of soil enhancer materials are important and current questions. In order to represent the main categories, we selected both tilled and no-till vineyards, and considered a total of five treatments in the present study, also involving biochar as potential soil amendment and organic manure as fertilizer. The following treatment combinations were used: (i) no-tillage management with no fertilizer (manure) addition as the control (C); (ii) shallow (20 cm depth) tilled soil with no manure amendment (T); (iii) shallow tilled soil with no manure addition and biochar applications (T + BC); (iv) shallow tilled soil with organic manure addition (T + M); and (v) shallow tilled soil with organic manure addition and biochar application (T + M + BC). Each treatment included seven consecutive grapevines, where the total manure amended area was approximately 800 m2and the non-fertilized site was approximately 600 m2. The manure was applied to the soil (approximately 14.7 t ha−1; hoed into the top 20 cm soil layer) in February and in early March, 2017, concurrent with the between rows tillage. In total, 3.5 t ha−1 biochar was applied on 17 March 2017. Biochar was incorporated into the soil at a 5–20 cm depth, ensuring that the top soil layer did not contain biochar particles to minimize biochar runoffs caused by larger rain fall events. The investigated sites were not irrigated during the course of the study.
The vegetation period was divided into different growth phases to investigate how strong the correlations were between environmental parameters of soil water content (SWC) and temperature and GHG production while the plants were growing. During plant development, we distinguished six main growth phases based on weekly phenological observations; however, in the present study, we excluded the dormancy phase when no leaves were present in the grapevines, which corresponds to minimal plant activity; therefore, only the five phases when plant growth is more prominent were investigated. The dormancy stage of the plant growth lasted approximately until the end of March, when the bud break started to develop (1st phase). We observed the bloom and fruit set time period to be from early May to early June (2nd phase). From early June to late June, the veraison stage occurred (3rd phase), while the fruit maturation (4th phase) was observed from late June to early September.
The harvest took place in early September, which also represents the start of the post-harvest (5th phase) period in the present study.
2.2. Biochar Used in the Experiment
Commercially available biochar was bought for the experiment, having a European Biochar Certificate (EBC), indicating similar physical and chemical characteristics for different batches; however,
Sustainability2018,10, 1811 4 of 15
biochar from a single batch was used in the present study. According to the manufacturer, the biochar was made from grain husks using Pyreg-reactor technology at 600◦C. The chemical properties of the biochar used in the study were the following: pH = 10.3 ± 0, TOC = 47.3%, total nitrogen (Ntot) = 1.0±0.1%, and NH4+-N = 1.9±0.1 mg kg−1.
2.3. Physical and Chemical Characteristics of the Soil
Continuous SWC and soil temperature monitoring was implemented at 15 and 40 cm below the soil surface using 5TM (Decagon Devices Inc., Pullman, WA, USA) soil moisture and temperature sensors calibrated specifically to the soil used in the present study for T, T + M, T + BC, and T + M + BC treatments. Soil water sensors were calibrated prior to field use. SWC represents the volumetric water content of the investigated soils throughout the study. Soil samples were collected prior to soil enhancer amendments (15 March 2017) in triplicate from the top 2–10 cm of the soil column by a sample corer.
Samples were homogenized and analyzed for Ntot, NH4+-N, NO3−-N, K2O (Al soluble), P2O5(Al soluble), soil organic carbon (SOC) content, electrical conductivity, and pHH2O(Table1). The different study sites were in close proximity to each other so that prior to soil amendments there were no significant differences in their chemical parameters. The investigated soils were classified as sandy loam. Particle size distribution was determined using the sieve-pipette method, where C and T + M soils had 75.62±2.86 and 69.44±3.61% sand content (2–0.5 mm), 16.20±1.79 and 19.62±1.60% silt (0.05–0.002 mm), and 8.18±1.24 and 10.93±2.05% clay (<0.002 mm) content, respectively.
The amount of SOC was measured by wet digestion using the Tyurin method, and NTotwas determined using the modified Kjeldahl method (ISO 11261:1995). Soil element concentrations are reported as mg kg−1dry weight soil.
Table 1. Chemical characteristics for the control (C), tilled (T), tilled and manure amended (T + M;
prior to manure addition), tilled and biochar amended (T + BC), and tilled, manure and biochar added (T + M + BC) soil samples prior to biochar addition (Initial) and three months (3M) after manure and biochar applications. SOC represents soil organic carbon; NTotmeans total nitrogen amount;n= 2 to 3;
±SD; NA means data not available.
pH SOC % CaCO3% K2O mg kg−1 P2O5
mg kg−1 NTot% NH4-N mg kg−1
NO3-N mg kg−1
CInitial 6.23±0.13 1.32±0.01 0.07±0.01 149.50±68.59 130.5±0.71 0.09±0.00 5.30±0.00 1.20±0.34
TInitialand
T + BCInitial 6.27±0.08 1.23±0.14 0.05±0.01 170.5±38.89 128.0±4.24 0.08±0.01 5.05±0.35 1.68±0.34 T + MInitialand
T + M + BCInitial 6.90±0.43 0.85±0.06 0.15±0.13 254.3±10.07 423.3±189.1 0.09±0.02 7.60±1.32 1.75±0.65 C3M 6.39±0.16 0.97±0.16 NA 168.34±0.36 182.9±8.74 0.12±0.01 3.55±0.35 9.46±2.00 T3M 6.40±0.15 1.04±0.10 NA 176.08±10.59 210.4±30.14 0.13±0.00 3.80±0.71 14.56±9.22 T + M3M 7.05±0.06 1.68±0.37 NA 465.6±97.14 680.8±45.24 0.19±0.04 4.57±0.31 3.12±1.06 T + BC3M 6.60±0.15 1.00±0.04 NA 163.75±11.78 239.1±24.14 0.12±0.01 3.43±0.23 14.15±8.51 T + M + BC3M 7.06±0.15 1.54±0.39 NA 523.5±98.64 679.5±100.4 0.17±0.02 4.23±0.72 6.53±3.26
2.4. CO2Measurements and Gas Chromatography—Flame Ionization Detector (GC-FID) Analyses
During the course of the study, CO2measurements were taken on a weekly to biweekly basis from mid-March to mid-October, 2017. Sampling was carried out by the static chamber method with four replicates for each treatment, where the chambers were placed permanently into the soils. Air samples were taken from the headspace of the 20 cm high and 10 cm diameter cylindrical chambers placed 5 cm deep into the soil, equipped with a rubber septum on a removable cover. Air samples were taken at each sampling time in triplicate and were used as initial concentration estimates, while respiration measurements were conducted with four replicates per treatment.
Gas samples were collected after a 20 min incubation time into evacuated 10 mL exetainer vials.
CO2production was quantified using a FISIONS 8000 gas chromatograph (FISONS Instruments, Ipswich, UK) with a flame ionization detector (FID) equipped with a methanizer. GC-FID instrument column parameters were 2 m by 3 mm, Porapak Q 80-100 mesh. The method used a splitless injection
with hydrogen carrier gas (pressure: 90 kPa; flow: 30 mL min−1). The injection volume of 250µL was used. The detector temperature was set at 150◦C, while the oven temperature was kept constant at 80◦C for the duration of 180 s. The methanizer temperature was set at 350◦C. Calibration standards for CO2concentration determination of 405 and 5000 mg kg−1CO2were run prior to and after each sample run, containing approximately 14 samples. The average measured concentration of the 405 mg kg−1 standard samples was 413.3±17.6 mg kg−1CO2(4% relative error) and 4963.2±120.7 mg kg−1 (2% relative error) of the 5000 mg kg−1, leading to a 0.004 mg CO2m−2s−1minimum detectable flux considering the current system and chamber setup. Fluxes were calculated by applying a linear assumption between initial and 20 min concentrations. CO2concentrations are presented as mg kg−1 and emission values as mg CO2m−2s−1.
2.5. N2O Measurements and GC-ECD Analyses
Gas samples were collected after a 30 min incubation time for N2O samples, into evacuated 22 mL exetainer vials and N2O production was quantified using a Perkin Elmer Clarus 500 gas chromatograph with an electron capture detector (ECD). GC-ECD instrument column parameters were 2 m×3 mm, Porapak Q 80-100 mesh. The method used a split injection with nitrogen carrier gas (pressure: 90 kPa; flow: 20 mL min−1) and nitrogen as the make up gas. The detector temperature was set at 310◦C, while the oven temperature was kept constant at 39◦C for the duration of 300 s.
Calibration standards of 0.32 and 5.00 mg kg−1N2O (Messer specialty gases) were run prior to and after each sample run. The average measured concentration of the 0.240 mg kg−1standard samples was 0.34633±0.02441 mg kg−1N2O (7% relative error) and 4.98820±0.019432 mg kg−1(4% relative error) of the 5 mg kg−1standard. This corresponds to a 0.004µg N2O m−2s−1emission at around the typical background atmospheric concentration (340µg kg−1). The fluxes were calculated based on N2O concentrations measured by GC-ECD. N2O concentrations are measured as mg kg−1and emission values presented asµg N2O m−2s−1.
Fluxes were calculated by applying a linear assumption between initial and 30 min concentrations.
To determine the optimal incubation time, a linear regression of gas concentration (mg kg−1) over time was calculated at the beginning of the experiment for both CO2and N2O samples. To calculate if the incubation time was efficient enough, we made a six point concentration curve with samples collected at 0, 10, 20, 30, 45, and 60 min after incubation.
2.6. Statistical Analyses
The collected data was analyzed using linear regression analyses (Model I, Ordinary Least Squares method), where the independent variables were the soil water or soil temperature and the dependent variable was the CO2or N2O emissions. We used the ordinary least square (OLS) method to estimate the linear regression factors. Statistical evaluation was performed for the full investigated period and for each growth stage separately to better interpret intra-vegetation period effects. To find statistical significance between treatments, the one-way ANOVA application was used, followed by a post hoc Tukey HSD test. Residuals were checked for normal distribution and data were transformed (Box-Cox transformation) where necessary. All statistical calculations were performed using the software package R (Version 2.15.2). Statistical significance of the data sets was determined atp< 0.05 andp< 0.01.
3. Results
3.1. Soil Water and Temperature Changes over Time
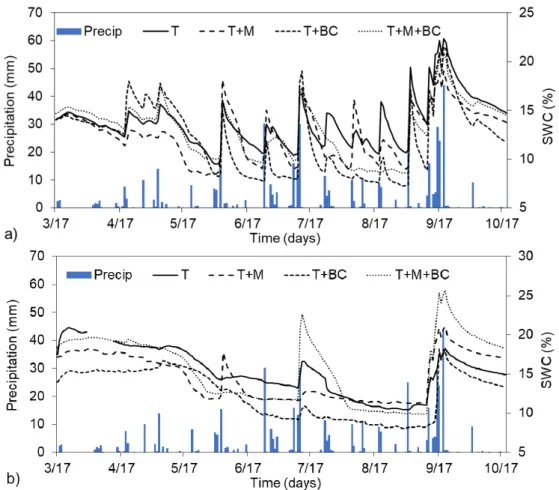
During the investigated period (15 March–19 October 2017), the total amount of precipitation was 453.8 mm, which is in coherence with the long-term average and optimal for the site. Soil volumetric water content (SWC) was the lowest in the case of T + BC treatments, while we found the highest water contents in the upper 15 cm for the shallow tilled soil (T); however, these differences were not
Sustainability2018,10, 1811 6 of 15
significant (p= 0.214). When analyzing SWC at the lower 40 cm of the soil layer, we found that the changes were more pronounced between treatments. For instance, T + BC treatment had 15% less SWC compared to T + M treatments for the entire investigated period, while compared to T + M + BC, the difference was even higher (20.9%). These differences were relatively substantial, as compared to the SWC measured at the 15 cm soil layer, where the highest observed difference was only 13%
(Figure1).
Sustainability 2018, 10, x FOR PEER REVIEW 6 of 15
compared to the SWC measured at the 15 cm soil layer, where the highest observed difference was only 13% (Figure 1).
Figure 1. Soil volumetric water content (SWC) changes over time at (a) 15 cm and (b) 40 cm soil depths
for the different treatments. SWC values represent daily average values and daily cumulative rainfall amount (precipitation). T represents the tilled soil, T + M the tilled soil with manure addition, T + BC the tilled soil with biochar addition, and T + M + BC the tilled soil with manure and biochar addition.
We found that SWC was significantly higher in the case of T and T + M + BC treatments compared to T + BC treatment during the investigated time (p = 0.002 and p = 0.008, respectively).
Through grapevine dormancy to bud break, the biochar amended treatments showed higher water holding capacities during rain events in the upper soil layers; however, at later times, these capacities seemed to diminish, and similar responses to precipitation were noticed in the treatments. In general, continuous changes to precipitation or drier time periods showed that biochar amended soils also dried out faster than non-amended soils in the upper layers. After analyzing the lower layers’ SWC, we found that manure amended soils could retain more water compared to non-fertilized soils (Figure 1b).
In the case of overall soil temperature variations, we found no substantial variations among treatments, and the highest difference between daily average soil temperatures of treatments was observed at 40 cm, where T treatment showed a 6.6% higher temperature than T + M treatments (Figure 2a); however, the difference was not significant (p = 0.899). At the 15 cm soil layer, we found that all treatments closely followed daily soil temperature values, with T + M + BC soils showing the highest soil temperature difference during grapevine dormancy, bud break, and after harvest. At the 40 cm soil layers, larger differences, specifically lower soil temperatures, were observed in the case of T and T + BC soils compared to T + M and T + M + BC treatments (Figure 2b) during vegetation growth between mid-May through mid-August (during the bloom, fruit set, veraison, and fruit maturation stages). After harvest, this trend changed and all treatments showed very similar soil temperature values, which also followed the decreasing air temperature tendency (Figure 2b).
Figure 1.Soil volumetric water content (SWC) changes over time at (a) 15 cm and (b) 40 cm soil depths for the different treatments. SWC values represent daily average values and daily cumulative rainfall amount (precipitation). T represents the tilled soil, T + M the tilled soil with manure addition, T + BC the tilled soil with biochar addition, and T + M + BC the tilled soil with manure and biochar addition.
We found that SWC was significantly higher in the case of T and T + M + BC treatments compared to T + BC treatment during the investigated time (p= 0.002 andp= 0.008, respectively). Through grapevine dormancy to bud break, the biochar amended treatments showed higher water holding capacities during rain events in the upper soil layers; however, at later times, these capacities seemed to diminish, and similar responses to precipitation were noticed in the treatments. In general, continuous changes to precipitation or drier time periods showed that biochar amended soils also dried out faster than non-amended soils in the upper layers. After analyzing the lower layers’ SWC, we found that manure amended soils could retain more water compared to non-fertilized soils (Figure1b).
In the case of overall soil temperature variations, we found no substantial variations among treatments, and the highest difference between daily average soil temperatures of treatments was observed at 40 cm, where T treatment showed a 6.6% higher temperature than T + M treatments (Figure2a); however, the difference was not significant (p= 0.899). At the 15 cm soil layer, we found that all treatments closely followed daily soil temperature values, with T + M + BC soils showing the
highest soil temperature difference during grapevine dormancy, bud break, and after harvest. At the 40 cm soil layers, larger differences, specifically lower soil temperatures, were observed in the case of T and T + BC soils compared to T + M and T + M + BC treatments (Figure2b) during vegetation growth between mid-May through mid-August (during the bloom, fruit set, veraison, and fruit maturation stages). After harvest, this trend changed and all treatments showed very similar soil temperature values, which also followed the decreasing air temperature tendency (Figure2b).
Sustainability 2018, 10, x FOR PEER REVIEW 7 of 15
Figure 2. Soil temperature changes over time at (a) 15 cm and (b) 40 cm soil depths for the different treatments. Values represent daily average values. T represents the tilled soil, T + M the tilled soil with manure addition, T + BC the tilled soil with biochar addition, and T + M + BC the tilled soil with manure and biochar addition.
3.2. Soil Respiration (CO
2) Changes over Time
Average soil CO
2emission values during the investigated period showed the highest levels for the T treatment (0.108 µgCO
2m
−2s
−1) and the lowest was observed for the C treatment (0.078 µgCO
2m
−2s
−1), while T + M and T + M + BC treatments had very similar soil respiration values (0.089 and 0.086 µgCO
2m
−2s
−1, respectively; Figure 3). Tillage with no manure addition (T) had consistently lower CO
2emissions until harvest compared to T + BC, where the average values were 0.117 µgCO
2m
−2s
−1. After harvest, CO
2emission from the biochar added treatments started to decline compared to T (Figure 3). When investigating the organic manure amended soils, we found that during plant growth and after harvest, soil emissions were similar in both T + M and T + M + BC treatments, while during the fruit set and veraison stage, T + M + BC treatments showed consistently lower CO
2values (Figure 3).
The direction of change and the statistical analyses of the CO
2emissions of the different treatments compared to the control during the growth stages are presented in Table 2, highlighting that all major changes between treatments occurred prior to harvest.
Figure 2.Soil temperature changes over time at (a) 15 cm and (b) 40 cm soil depths for the different treatments. Values represent daily average values. T represents the tilled soil, T + M the tilled soil with manure addition, T + BC the tilled soil with biochar addition, and T + M + BC the tilled soil with manure and biochar addition.
3.2. Soil Respiration (CO2) Changes over Time
Average soil CO2 emission values during the investigated period showed the highest levels for the T treatment (0.108 µgCO2 m−2 s−1) and the lowest was observed for the C treatment (0.078µgCO2m−2s−1), while T + M and T + M + BC treatments had very similar soil respiration values (0.089 and 0.086µgCO2m−2s−1, respectively; Figure3). Tillage with no manure addition (T) had consistently lower CO2emissions until harvest compared to T + BC, where the average values were 0.117µgCO2m−2s−1. After harvest, CO2emission from the biochar added treatments started to decline compared to T (Figure3). When investigating the organic manure amended soils, we found that during plant growth and after harvest, soil emissions were similar in both T + M and T + M + BC treatments, while during the fruit set and veraison stage, T + M + BC treatments showed consistently lower CO2values (Figure3).
Sustainability2018,10, 1811 8 of 15
Sustainability 2018, 10, x FOR PEER REVIEW 8 of 15
Figure 3. Changes in soil respiration (µgCO2 m−2 s−1) over time for the different treatments, based on discrete measurement points, for the treatments of control (C), tilled soil (T), tilled soil with manure addition (T + M), tilled soil with biochar (T + BC), and tilled soil with manure and biochar addition (T + M + BC) n = 4; ±SD.
Table 2. Results of statistical analyses (one-way ANOVA) for the effects of tillage, manure, and biochar addition on soil GHG emission values during the different plant growth stages. ANOVA:
Analysis of variance; Ave represents the average CO2 fluxes (mg m−2 s−1) and N2O fluxes (µg m−2 s−1).
Direction of change (DoC) is either an increase (+) or decrease (−) in soil CO2 emissions compared to control treatment, where + and − denote non-significant changes, ++ denotes significance level at p <
0.05 and +++ at p < 0.01. C control; T shallow tillage; M manure addition; BC biochar addition.
Treatment Types/Plant
Growth Stages
Total Plant Growth Time; n =
84 Ave DoC
Bud Break; n = 8 Ave DoC
Bloom and Fruit Set; n =
16 Ave DoC
Veraison; n = 40 Ave DoC
Post-Harvest;
n = 20 Ave DoC CO2
C 0.079 0.043 0.084 0.091 0.065
T 0.107 ++ 0.092 + 0.107 + 0.117 + 0.086 +
T + M 0.089 + 0.049 + 0.085 + 0.102 + 0.078 +
T + BC 0.108 +++ 0.055 + 0.136 ++ 0.122 + 0.071 +
T + M + BC 0.087 + 0.039 − 0.113 + 0.096 + 0.058 −
N2O
C 0.011 0.007 0.010 0.011 0.014
T 0.013 + 0.010 + 0.008 − 0.014 + 0.018 +
T + M 0.010 − 0.009 + 0.007 − 0.011 − 0.014 +
T + BC 0.012 + 0.008 + 0.007 − 0.012 + 0.017 +
T + M + BC 0.008 - 0.007 − 0.006 − 0.010 − 0.007 −
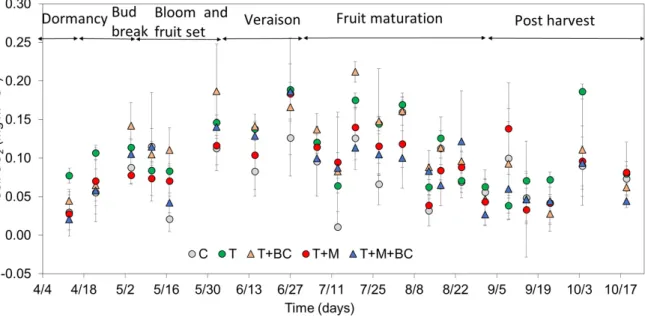
3.3. Soil N2O Emission Changes over Time
The highest average soil N
2O emission values were observed in the T treatment (0.0127 µg m
−2s
−1), while the lowest was in the case of T + M + BC treatment (0.0085 µg m
−2s
−1), which difference was also statistically significant (p = 0.009; Figure 4). Compared to the control’s N
2O emission, T + M and T + BC treatments showed minimal differences with a 3.3% and 2.7% increase, respectively, while T soil N
2O emission values increased by 17.5% and T + M + BC decreased by 21.7%. We also observed negative N
2O fluxes at certain occasions during the study (Figure 4), the data for which is included in the present report.
Figure 3.Changes in soil respiration (µgCO2m−2s−1) over time for the different treatments, based on discrete measurement points, for the treatments of control (C), tilled soil (T), tilled soil with manure addition (T + M), tilled soil with biochar (T + BC), and tilled soil with manure and biochar addition (T + M + BC)n= 4;±SD.
The direction of change and the statistical analyses of the CO2emissions of the different treatments compared to the control during the growth stages are presented in Table2, highlighting that all major changes between treatments occurred prior to harvest.
Table 2.Results of statistical analyses (one-way ANOVA) for the effects of tillage, manure, and biochar addition on soil GHG emission values during the different plant growth stages. ANOVA: Analysis of variance; Ave represents the average CO2fluxes (mg m−2s−1) and N2O fluxes (µg m−2s−1). Direction of change (DoC) is either an increase (+) or decrease (−) in soil CO2emissions compared to control treatment, where + and−denote non-significant changes, ++ denotes significance level atp< 0.05 and +++ atp< 0.01. C control; T shallow tillage; M manure addition; BC biochar addition.
Treatment Types/Plant Growth Stages
Total Plant Growth Time;
n= 84 Ave DoC
Bud Break;
n= 8 Ave DoC
Bloom and Fruit Set;n= 16
Ave DoC
Veraison;n= 40 Ave DoC
Post-Harvest;
n= 20 Ave DoC CO2
C 0.079 0.043 0.084 0.091 0.065
T 0.107 ++ 0.092 + 0.107 + 0.117 + 0.086 +
T + M 0.089 + 0.049 + 0.085 + 0.102 + 0.078 +
T + BC 0.108 +++ 0.055 + 0.136 ++ 0.122 + 0.071 +
T + M + BC 0.087 + 0.039 − 0.113 + 0.096 + 0.058 −
N2O
C 0.011 0.007 0.010 0.011 0.014
T 0.013 + 0.010 + 0.008 − 0.014 + 0.018 +
T + M 0.010 − 0.009 + 0.007 − 0.011 − 0.014 +
T + BC 0.012 + 0.008 + 0.007 − 0.012 + 0.017 +
T + M + BC 0.008 - 0.007 − 0.006 − 0.010 − 0.007 −
3.3. Soil N2O Emission Changes over Time
The highest average soil N2O emission values were observed in the T treatment (0.0127µg m−2s−1), while the lowest was in the case of T + M + BC treatment (0.0085µg m−2s−1), which difference was
also statistically significant (p= 0.009; Figure4). Compared to the control’s N2O emission, T + M and T + BC treatments showed minimal differences with a 3.3% and 2.7% increase, respectively, while T soil N2O emission values increased by 17.5% and T + M + BC decreased by 21.7%. We also observed negative N2O fluxes at certain occasions during the study (Figure4), the data for which is included in the present report.
When the overall vegetation growth period was divided into different plant development stages, we found that the differences between the treatments were significant only in the case of T and T + M + BC during plant maturation (p= 0.0282) and pro-harvest (p= 0.0148) periods (data not shown), indicating that during the first stages of grapevine growth, the different treatments did not significantly influence soil N2O emissions.
Sustainability 2018, 10, x FOR PEER REVIEW 9 of 15
When the overall vegetation growth period was divided into different plant development stages, we found that the differences between the treatments were significant only in the case of T and T + M + BC during plant maturation (p = 0.0282) and pro-harvest (p = 0.0148) periods (data not shown), indicating that during the first stages of grapevine growth, the different treatments did not significantly influence soil N2O emissions.
Figure 4. Soil N2O emission (µg m−2 s−1) changes over time for the different treatments, based on discrete measurement points, for the treatments of control (C), tilled soil (T), tilled soil with manure addition (T + M), tilled soil with biochar (T + BC), and tilled soil with biochar and manure addition (T + M + BC); n = 4; ±SD.
3.4. Effects of Soil Water and Temperature on CO2 and N2O Emissions
We investigated the relationships between soil water content (measured at 15 cm below surface) and temperature (both air temperature and soil temperature at 15 cm below surface at the time of sampling) and CO2 and N2O emissions. In general, we observed increasing CO2 emissions with increasing soil and air temperature, where the highest CO2 was produced during summer and the lowest during early spring and late fall (Figure 3). When analyzing the different plant growth stages, we only found weak correlations between CO2 emission and SWC contents during plant development through early fruit maturation (e.g., R2 = 0.473 for T + BC), no correlations during late fruit maturation, and weak to moderately strong connections after the post-harvest period (e.g.,R2 = 0.696 for T + M), which is partially in agreement with literature data [41]. Similar results were observed when the connections between air temperature and soil CO2 production were investigated, and we found no strong correlations between temperature values and emission measurements (R2 < 0.355) for the different treatment types.
When we investigated the connections between air temperature and N2O emissions at the different plant growth phases, we found that up until the early fruit maturation stage, the manure amended treatments had very good correlations (T + M and T + M + BC presented R2 = 0.826 and R2
= 0.932 values, respectively), while the other treatments showed no correlations. During spring, prior to bud breaks, the increasing temperature resulted in increasing N2O values (Figure 4); however, at later plant developments, we could not observe clear connections between air temperature and soil N2O emissions (R2 < 0.31). Similar results were observed in the case of SWC and N2O values. Up until early fruit maturation, T + M and T + M + BC treatments showed very strong (R2 = 0.894 and R2 = 0.939, respectively), T + BC moderately strong (R2 = 0.688), and T no correlations (R2 < 0.25) between SWC and N2O emissions. Good correlations (R2 > 0.50) during the late fruit maturation stage could not be observed (R2 < 0.39 in all treatments), while after harvest, only weak to no correlations were
Figure 4. Soil N2O emission (µg m−2s−1) changes over time for the different treatments, based on discrete measurement points, for the treatments of control (C), tilled soil (T), tilled soil with manure addition (T + M), tilled soil with biochar (T + BC), and tilled soil with biochar and manure addition (T + M + BC);n= 4;±SD.
3.4. Effects of Soil Water and Temperature on CO2and N2O Emissions
We investigated the relationships between soil water content (measured at 15 cm below surface) and temperature (both air temperature and soil temperature at 15 cm below surface at the time of sampling) and CO2 and N2O emissions. In general, we observed increasing CO2emissions with increasing soil and air temperature, where the highest CO2was produced during summer and the lowest during early spring and late fall (Figure3). When analyzing the different plant growth stages, we only found weak correlations between CO2emission and SWC contents during plant development through early fruit maturation (e.g., R2= 0.473 for T + BC), no correlations during late fruit maturation, and weak to moderately strong connections after the post-harvest period (e.g.,R2= 0.696 for T + M), which is partially in agreement with literature data [41]. Similar results were observed when the connections between air temperature and soil CO2production were investigated, and we found no strong correlations between temperature values and emission measurements (R2 < 0.355) for the different treatment types.
When we investigated the connections between air temperature and N2O emissions at the different plant growth phases, we found that up until the early fruit maturation stage, the manure amended treatments had very good correlations (T + M and T + M + BC presented R2= 0.826 and R2= 0.932
Sustainability2018,10, 1811 10 of 15
values, respectively), while the other treatments showed no correlations. During spring, prior to bud breaks, the increasing temperature resulted in increasing N2O values (Figure4); however, at later plant developments, we could not observe clear connections between air temperature and soil N2O emissions (R2< 0.31). Similar results were observed in the case of SWC and N2O values. Up until early fruit maturation, T + M and T + M + BC treatments showed very strong (R2= 0.894 and R2= 0.939, respectively), T + BC moderately strong (R2= 0.688), and T no correlations (R2< 0.25) between SWC and N2O emissions. Good correlations (R2> 0.50) during the late fruit maturation stage could not be observed (R2< 0.39 in all treatments), while after harvest, only weak to no correlations were perceived between SWC or air temperature and N2O emissions. Our results indicate the more vital influence of seasonal changes on soil GHG emissions than SWC or temperature individually.
4. Discussion
The study focused on the overview of soil CO2and N2O fluxes and their relationships to soil amendments and abiotic drivers such as SWC and both soil and air temperature.
Soil CO2emissions are proportional to temperature changes [8], as microbial respiration generally increases with increasing temperature. This statement is in agreement with our findings, and generally, summer respiration values were higher compared to spring and fall values. Our results supported that the co-evolution of temperature and vegetation activity basically determines the annual cycle of GHG release from soil, with some contribution of SWC—depending on drought stress. Our exponential regression returned with mixed results regarding the correlations between soil emission and its drivers.
No definite correlations were found between soil CO2emission and any single investigated factor.
However, when the combined effects of SWC and temperature on soil CO2emissions were investigated, the correlations increased significantly (e.g., R2= 0.926 for T + M treatment during post-harvest period compared to R2= 0.696 SWC and R2= 0.282 temperature individually). Therefore, exponential (Q10) fitting of data might not provide appropriate evaluations when only temperature dependence of soil CO2productions are investigated unless corrected for soil water content effects [42].
Soil management systems can greatly influence soil respiration values. In the present study, we found that tillage can generate a sudden surge of CO2production from soils, where faster organic matter decomposition and mineralization occurs due to soil aeration. However, long-term application of conservation tillage (e.g., no-till) might result in the accumulation of organic matter in the top layers of the soil column [19]. Due to this organic matter accumulation, higher overall CO2production under no-till management might be expected on the annual scale [9]. Most significant differences in CO2
production were found between treatments prior to the harvest period (Table2). This result indicates that soil management and amendments mostly affect soil respiration during the most active spring and summer period of the ecosystem. As indicated in the literature, manure addition to soils alone can enhance soil CO2emissions, and manure combined with biochar can lead to an even greater increase in the soil respiration values [43]. We observed an opposite result, where manure treatment alone led to consistently lower soil respiration during all growth stages when compared to its tilled control.
Manure and biochar combined application showed very similar results with consistently lower CO2 emissions, during all but bloom and fruit set periods (Table2). However, our data also agrees with the findings in the literature [44,45]. Overall, we found higher CO2productions in all treated soils compared to the no-till (control) plot.
Soil N2O emissions can originate either from microbial denitrification and nitrification [11], where nitrification is the predominant microbial process of N2O production under aerobe conditions.
While it was not dominant in the present experiment, occasional N2O uptake by soil can occur when the capacity of soil to act as a sink for N2O is greater than its capacity to emit [46]. N2O reduction by microbial processes could be due to nitrous oxide-reducing microorganisms [47]. In the present study, both soil microorganisms derived nutrient sources and sinks were observed. However, nitrogen sinks were only measured once in spring (T + M + BC) and twice during fall, after harvest, for C and T + M + BC treatments. Although negative fluxes can be a result of inadequate sampling
collection or measurement methods, the underlying causes are also important to further investigate.
Chapuis-Lardy et al. [48] found that soil pH and low nitrogen availability can enhance N2O sink;
nevertheless, in the present study, the manure amended soil showed the lowest overall N2O values.
Compared to the control treatments, T soil N2O emission values increased substantially (17.5%) while T + M + BC decreased (21.7%). These findings indicate that manure and biochar addition to soils can affect soil microbial communities to a degree that N2O emission reduced greatly. Our result suggests that it is the adverse effect of biochar addition on soil nitrifying and denitrifying microbial communities [49], rather than nutrient limitations, that causes decreasing N2O emissions in the treatments. While the soil tillage considerably induced N2O emissions, biochar addition alone resulted in some N2O emission reductions. Microbial activities may decrease as an abrupt change in their environmental conditions occurs with the addition of a new substance to the soil. As a result, similarly to the negative values, N2O reduced. Nevertheless, these distress responses of the microbial communities to the new substances could mostly arise at the beginning of the fertilizer or biochar application and not after enough acclimatization time has occurred (e.g., harvest time). Low CO2
and high N2O emission under no-tillage can be explained by reduced gas diffusivity and air-filled porosity [50].
In general, N2O emissions were small throughout this study (fluxes ranged between−0.002 and 0.033µg m−2s−1;p= 0.021 among the five treatments), regardless of temperature or soil moisture.
This result was expected as gas samples for flux measurements were collected on a weekly to bi-weekly basis. However, as reported in the literature, results on N2O fluxes measured in vineyards vary substantially. Our obtained N2O emission values were similar to or lower than a study done by Verhoeven and Six [51], where the authors also found significantly higher emission values in the biochar amended treatments compared to the control. On the other hand, our values were higher compared to a Mediterranean vineyard study where conventional tilled soil versus no-till was investigated [52].
In the case of vineyards, N2O emission can vary between 0 and 0.056µg m−2s−1in control soils, or between 0 and 0.069 or 0.162µg m−2 s−1in biochar amended soils, depending on the type of biochar [51]. Yu et al. [53] observed N2O fluxes ranging between 0 and 0.051µg m−2s−1in vineyard vines depending on soil types, with high values occurring after rain events. In the present study, we found a decrease in soil N2O emission in biochar amended soils, which is in agreement with other studies [43,44]; however, an increase can be also expected after biochar addition [51,54].
Changes in environmental factors, such as the wetting of a dry soil or after rainfall events with high air temperature, can cause an increase in N2O emission [55,56]. In the present study, emission values were taken mostly under optimal field conditions, when no sudden environmental change occurred. This sampling process could miss short pulses in N2O values. Blackmer et al. [57] found that soil water and temperature induced diurnal variabilities in N2O emissions can influence the measurement outcomes, e.g., mid-day measurements can greatly differ from late afternoon or early morning measurements. The authors also observed site dependent diurnal patterns, where one study site can show strong patterns, while another exhibits no clear diurnal patterns [57]. Several studies suggest that the static chamber method can overestimate N2O fluxes in the early afternoon; therefore, early morning or late afternoon should be the preferred time interval for measurements [57–59]. At the same time, shaded areas might be less sensitive for diurnal patterns [57] and should be taken into consideration when collecting samples. Good correlations between N2O fluxes and soil water or temperature were not observed in our data. This can either be due to the relatively dry study period or the fact that the weekly sample collection might not be sufficient enough to find definite connections.
Therefore, longer and more frequent investigations, including very dry and very wet years, would be beneficial to further support our deductions. As biochar amendment did affect SWC over time in the present study, especially with faster drying out periods after rainfall, a decrease in N2O emission could be expected as a result. However, for a short period of time, biochar amendment increased the SWC of the soils at rain events, therefore missing measurements at these times could cause an underestimation of soil GHG emission.
Sustainability2018,10, 1811 12 of 15
The treatment sites were selected in close proximity to each other in order to minimize major differences between soil physical properties. However, long-term land use and management (e.g., regularly tilled soils are more prone to erosion, especially in mountainous areas) and environmental factors can influence the soil’s biogeochemical cycles with depth even on a small scale. Therefore, the differences in the temperature and SWC values of manure amended versus non-fertilized soils’ at a 40 cm depth could be a result of the differences in soil physical parameters [60], as soils at the fertilized site have more silt and clay contents (21.1 and 33.6% higher values, respectively) compared to the non-fertilized site. As SWC decreases in sandy soils at a faster rate than in clayey soils after a rainfall event, the differences in SWC can partly be explained by the over 6% less sand content in the manure amended soils. While the soil moisture potentials of the upper soil layers were very similar in the experimental sites, the lower (40 cm depth) layers showed up to a 10.9% lower moisture holding capacity in the case of regularly tilled and fertilizer amended soils. Therefore, these differences in soil physical characteristics can contribute to both soil temperature and SWC differences between treatments.
In general, good correlations between soil moisture and temperature changes and N2O emission could not be clearly defined in the present study, while clear seasonal effects were observed between soil CO2 emissions and temperature. Daily soil temperature range (measured at 15 cm depth) during summer reached 4.8 ◦C, averaging a 3.0 ◦C difference, while during spring and fall, the highest daily changes were 5.1 and 4.2◦C (averaging 2.9 and 1.7◦C), respectively. While these changes are more pronounced in air temperature values, the main soil N2O emission drivers are soil temperature along with soil moisture values changes, rather than air temperature [61].
On the other hand, strong correlations between temperature and soil CO2emissions are more likely as higher temperatures and longer daylight periods affect plant growth, and consequently plant root, heterotrophic, and mycorrhizal respiration, which are the main biogenic sources of soil CO2
efflux [62,63].
5. Conclusions
We observed the significant influence of soil tillage on greenhouse gas productions in the present experiment with a substantial GHG increase compared to no-till management. Biochar amendments resulted in a decrease in N2O and only small changes (both small increases and small decreases) in CO2emission values from the soils. Fertilizer as an animal manure addition resulted in a significantly lower CO2emission compared to no manure amended soils. Hence, we found that in terms of CO2
production, the no till technique is a good management option in temperate vineyard soils to reduce CO2emissions. Our data suggested that the combined addition of manure and biochar to the soil can lower overall soil N2O emissions; however, these factors separately did not prominently reduce N2O emissions. We found that the most significant differences between CO2emission values and treatment types occurred during spring and summer time, highlighting the influence of seasonal effects on soil respiration, and their diminishing effect after plant and fruit maturity. In relation to changes in GHG emissions, we found that manure and biochar addition to the soils together could greatly decrease both CO2and N2O emissions after the harvest period. Our study also highlights the combined effects of soil moisture and temperature on soil GHG emissions, rather than these environmental factors separately. In general, the presented study involved a relatively optimal temperature and precipitation distributed year for the temperate vineyard site, providing us with very useful information which can be a good baseline for a longer term research study to draw new conclusions on soil GHG changes under more extreme (wet versus dry years) environmental conditions.
Author Contributions:I.P. and A.H. designed and performed the experiments; I.P. and M.D. analyzed the data;
E.T. contributed reagents/materials/analysis tools; A.H. and G.G. wrote the paper.
Funding:This research was funded by the Hungarian National Research Fund (OTKA/NKFI) grant number OTKA PD-116157 and PD-116084. This paper was also supported by the János Bolyai Research Scholarship of the Hungarian Academy of Sciences.
Acknowledgments:The authors would also like to thank Nóra Horel and János Májer to allow the field work to be done in their vineyards.
Conflicts of Interest:The authors declare no conflict of interest.
References
1. Raich, J.W.; Schlesinger, W.H. The global carbon dioxide flux in soil respiration and its relationship to vegetation and climate.Tellus B1992,44, 81–99. [CrossRef]
2. Schlesinger, W.H.; Andrews, J.A. Soil respiration and the global carbon cycle.Biogeochemistry2000,48, 7–20.
[CrossRef]
3. IPCC.Mitigation of Climate Change. Contribution of Working Group III to the Fifth Assessment Report of the Intergovernmental Panel on Climate Change; Cambridge University Press: Cambridge, UK, 2014.
4. Smith, A.K. Introduction. InNitrous Oxide and Climate Change; Smith, K., Ed.; Earthscan LLC.: Washington, DC, USA, 2010; pp. 1–3.
5. Smith, P.; Martino, D.; Cai, Z.; Gwary, D.; Janzen, H.; Kumar, P.; McCarl, B.; Ogle, S.; O’Mara, F.; Rice, C.; et al.
Greenhouse gas mitigation in agriculture.Philos. Trans. R. Soc. B Biol. Sci.2008,363, 789–813. [CrossRef]
[PubMed]
6. Huang, Y.A.O.; Tang, Y. An estimate of greenhouse gas (N2O and CO2) mitigation potential under various scenarios of nitrogen use efficiency in Chinese croplands.Glob. Chang. Biol.2010,16, 2958–2970. [CrossRef]
7. Ravishankara, A.R.; Daniel, J.S.; Portmann, R.W. Nitrous oxide (N2O): The dominant ozone-depleting substance emitted in the 21st century.Science2009,326, 123–125. [CrossRef] [PubMed]
8. Fang, C.; Moncrieff, J.B. The dependence of soil CO2efflux on temperature. Soil Biol. Biochem. 2001,33, 155–165. [CrossRef]
9. Tóth, E.; Gelybó, G.; Dencs˝o, M.; Kása, I.; Birkás, M.; Horel,Á. Chapter 19—Soil CO2 emissions in a long-term tillage treatment experiment A2—Muñoz, MaríaÁngeles. InSoil Management and Climate Change; Zornoza, R., Ed.; Academic Press: Cambridge, MA, USA, 2018; pp. 293–307.
10. Franzluebbers, A.J.; Hons, F.M.; Zuberer, D.A. Tillage and crop effects on seasonal dynamics of soil CO2
evolution, water content, temperature, and bulk density.Appl. Soil Ecol.1995,2, 95–109. [CrossRef]
11. Linn, D.M.; Doran, J.W. Effect of water-filled pore space on carbon dioxide and nitrous oxide production in tilled and nontilled soils.Soil Sci. Soc. Am. J.1984,48, 1267–1272. [CrossRef]
12. Ruser, R.; Flessa, H.; Russow, R.; Schmidt, G.; Buegger, F.; Munch, J.C. Emission of N2O, N2and CO2from soil fertilized with nitrate: Effect of compaction, soil moisture and rewetting.Soil Biol. Biochem.2006,38, 263–274. [CrossRef]
13. Weslien, P.; Klemedtsson, Å.K.; Börjesson, G.; Klemedtsson, L. Strong pH influence on N2O and CH4fluxes from forested organic soils.Eur. J. Soil Sci.2009,60, 311–320. [CrossRef]
14. Buchmann, N. Biotic and abiotic factors controlling soil respiration rates inPicea abiesstands.Soil Biol. Biochem.
2000,32, 1625–1635. [CrossRef]
15. Korner, C. Some often overlooked plant characteristics as determinants of plant growth: A reconsideration.
Funct. Ecol.1991,5, 162–173. [CrossRef]
16. Kessavalou, A.; Mosier, A.R.; Doran, J.W.; Drijber, R.A.; Lyon, D.J.; Heinemeyer, O. Fluxes of carbon dioxide, nitrous oxide, and methane in grass sod and winter wheat-fallow tillage management.J. Environ. Qual.1998, 27, 1094–1104. [CrossRef]
17. Doran, J.W. Soil microbial and biochemical changes associated with reduced tillage.Soil Sci. Soc. Am. J.1980, 44, 765–771. [CrossRef]
18. Paustian, K.; Six, J.; Elliott, E.T.; Hunt, H.W. Management options for reducing CO2 emissions from agricultural soils.Biogeochemistry2000,48, 147–163. [CrossRef]
19. Alvarez, R.; Díaz, R.A.; Barbero, N.; Santanatoglia, O.J.; Blotta, L. Soil organic carbon, microbial biomass and CO2-C production from three tillage systems.Soil Tillage Res.1995,33, 17–28. [CrossRef]
20. Hendrix, P.F.; Han, C.-R.; Groffman, P.M. Soil respiration in conventional and no-tillage agroecosystems under different winter cover crop rotations.Soil Tillage Res.1988,12, 135–148. [CrossRef]
21. Drewer, J.; Anderson, M.; Levy, P.E.; Scholtes, B.; Helfter, C.; Parker, J.; Rees, R.M.; Skiba, U.M. The impact of ploughing intensively managed temperate grasslands on N2O, CH4and CO2fluxes.Plant Soil2017,411, 193–208. [CrossRef]
Sustainability2018,10, 1811 14 of 15
22. Ball, B.C.; Crichton, I.; Horgan, G.W. Dynamics of upward and downward N2O and CO2fluxes in ploughed or no-tilled soils in relation to water-filled pore space, compaction and crop presence.Soil Tillage Res.2008, 101, 20–30. [CrossRef]
23. Sun, F.; Lu, S. Biochars improve aggregate stability, water retention, and pore-space properties of clayey soil.
J. Plant Nutr. Soil Sci.2014,177, 26–33. [CrossRef]
24. Novak, J.M.; Lima, I.; Xing, B.; Gaskin, J.W.; Steiner, C.; Das, K.C.; Ahmedna, M.; Rehrah, D.; Watts, D.W.;
Busscher, W.J.; et al. Characterization of designer biochar produced at different temperatures and their effects on a loamy sand.Ann. Environ. Sci.2009,3, 195–206.
25. Jones, D.L.; Murphy, D.V.; Khalid, M.; Ahmad, W.; Edwards-Jones, G.; DeLuca, T.H. Short-term biochar-induced increase in soil CO2release is both biotically and abiotically mediated.Soil Biol. Biochem.
2011,43, 1723–1731. [CrossRef]
26. Schiewer, S.; Horel, A. Biodiesel addition influences biodegradation rates of fresh and artificially weathered diesel fuel in Alaskan sand.J. Cold Reg. Eng.2017,31, 04017012. [CrossRef]
27. Anderson, C.R.; Condron, L.M.; Clough, T.J.; Fiers, M.; Stewart, A.; Hill, R.A.; Sherlock, R.R. Biochar induced soil microbial community change: Implications for biogeochemical cycling of carbon, nitrogen and phosphorus.Pedobiologia2011,54, 309–320. [CrossRef]
28. Horel, A.; Schiewer, S. Impact of VOC removal by activated carbon on biodegradation rates of diesel, Syntroleum and biodiesel in contaminated sand.Sci. Total Environ.2016,573, 106–114. [CrossRef] [PubMed]
29. Spokas, K.A.; Reicosky, D.C. Impacts of sixteen different biochars on soil greenhouse gas production.
Ann. Environ. Sci.2009,3, 179–193.
30. Wang, J.; Zhang, M.; Xiong, Z.; Liu, P.; Pan, G. Effects of biochar addition on N2O and CO2emissions from two paddy soils.Biol. Fertil. Soils2011,47, 887–896. [CrossRef]
31. Roberts, K.G.; Gloy, B.A.; Joseph, S.; Scott, N.R.; Lehmann, J. Life cycle assessment of biochar systems:
Estimating the energetic, economic, and climate change potential.Environ. Sci. Technol.2010,44, 827–833.
[CrossRef] [PubMed]
32. Shen, Y.; Zhu, L.; Cheng, H.; Yue, S.; Li, S. Effects of biochar application on CO2emissions from a cultivated soil under semiarid climate conditions in Northwest China.Sustainability2017,9, 1482. [CrossRef]
33. Maurer, D.; Koziel, J.; Kalus, K.; Andersen, D.; Opalinski, S. Pilot-scale testing of non-activated biochar for swine manure treatment and mitigation of ammonia, hydrogen sulfide, odorous volatile organic compounds (VOCs), and greenhouse gas emissions.Sustainability2017,9, 929. [CrossRef]
34. Yeboah, S.; Lamptey, S.; Cai, L.; Song, M. Short-term effects of biochar amendment on greenhouse gas emissions from rainfed agricultural soils of the semi–arid loess plateau region. Agronomy 2018, 8, 74.
[CrossRef]
35. Ventura, M.; Alberti, G.; Viger, M.; Jenkins, J.R.; Girardin, C.; Baronti, S.; Zaldei, A.; Taylor, G.; Rumpel, C.;
Miglietta, F.; et al. Biochar mineralization and priming effect on SOM decomposition in two European short rotation coppices.GCB Bioenergy2015,7, 1150–1160. [CrossRef]
36. Smith, J.L.; Collins, H.P.; Bailey, V.L. The effect of young biochar on soil respiration.Soil Biol. Biochem.2010, 42, 2345–2347. [CrossRef]
37. Major, J.; Lehmann, J.; Rondon, M.; Goodale, C. Fate of soil-applied black carbon: Downward migration, leaching and soil respiration.Glob. Chang. Biol.2010,16, 1366–1379. [CrossRef]
38. Van Zwieten, L.; Singh, B.; Joseph, S.; Kimber, S.; Cowie, A.; Chan, K.Y. Biochar and emissions of non-CO2 greenhouse gases from soil. InBiochar for Environmental Management: Science, Technology and Implementation;
Lehmann, J., Joseph, S., Eds.; Earthscan: London, UK; Routledge: London, UK, 2009; pp. 227–250.
39. Biederman, L.A.; Harpole, W.S. Biochar and its effects on plant productivity and nutrient cycling: A meta-analysis.GCB Bioenergy2013,5, 202–214. [CrossRef]
40. Jeffery, S.; Abalos, D.; Spokas, K.A.; Verheijen, F.G.A. Biochar effects on crop yield. InBiochar for Environmental Management: Science and Technology, 2nd ed.; Lehmann, J., Joseph, S., Eds.; Earthscan: London, UK, 2015;
pp. 301–326.
41. Wan, S.; Norby, R.J.; Ledford, J.; Weltzin, J.F. Responses of soil respiration to elevated CO2, air warming, and changing soil water availability in a model old-field grassland.Glob. Chang. Biol.2007,13, 2411–2424.
[CrossRef]
42. Lloyd, J.; Taylor, J.A. On the temperature dependence of soil respiration. Funct. Ecol. 1994,8, 315–323.
[CrossRef]