Soil physical properties affected by biochar addition at different plant phaenological phases. Part I**
Ágota Horel1, Gyöngyi Barna1*, and András Makó1,2
1Institute for Soil Sciences and Agricultural Chemistry, Centre for Agricultural Research, Hungarian Academy of Sciences, O. Herman 15, Budapest 1022, Hungary
2University of Pannonia Georgikon Faculty, F. Deák 16, Keszthely 8360, Hungary Received September 15, 2018; accepted December 30, 2018
*Corresponding author e-mail: barna.gyongyi@agrar.mta.hu
**This material is based upon work supported by the Hungarian Research, Development and Innovation Office (NKFIH) pro- jects grant Nr. OTKA PD-116157 (2015-2019) and K119475
(2016-2020). © 2019 Institute of Agrophysics, Polish Academy of Sciences
A b s t r a c t. Soil amendment usage can substantially modify soil structural and hydraulic properties, with the aim of improving its water, air and nutrition management along with crop growth.
The purpose of the present study was to investigate the physical changes in soil through different plant growing stages caused by biochar addition to silt loam soil. This research focused on chang- es in structural stability, and macro- and microaggregate stability.
The soils were amended with different amounts of biochar (con- trol with 0, BC0.5 with 0.5%, BC2.5 with 2.5%, and BC5.0 with 5.0% biochar, by weight). Capsicum annuum L. were planted at a two-four leaf stage. Soil samples were taken at 6, 10 and 12 weeks after planting. The results showed increasing macroaggre- gate stability values with increasing biochar addition; however, higher values were also detectable in control treatments over time.
Increased microaggregate stability values were observed during the plant maturing phase and the decrease, which occurred during fruit development was more pronounced. The largest microaggre- gate stability value was observed in the case of BC2.5 among all treatments, which corresponded better to plant growth rather than to the amount of added biochar. It was also found that the laser diffraction method is a suitable alternative technique to the sieve- pipette method for analysing biochar and biochar-amended soil particle size distribution and structure.
K e y w o r d s: structural stability, macro- and microaggregate stability, laser diffraction method
INTRODUCTION
The development of new soil amendments has been of scientific interest in recent decades to promote crop growth and yield by providing more favourable soil condi- tions for plants. Charcoal, ash, or biochar addition to soils may cause changes in soil chemical (Jien and Wang, 2013;
Liang et al., 2006), microbial (Anderson et al., 2011; Horel et al., 2018a; Schiewer and Horel, 2017), and physical and hydrophysical properties (Jien and Wang, 2013; Liang et al., 2006; Novak et al., 2009; Sun and Lu, 2014), and these modifications may ultimately influence soil productivity, yield, and plant health (An and Huang, 2015; Gascó et al., 2016; Helliwell, 2015). Plant growth at different stages further influences soil hydrological properties, especially the moisture regime (Angers and Caron, 1998; Surda et al., 2015), whereas the addition of biochar, further affects soil and plant health and consequently needs to be carefully investigated prior to its agricultural use.
Soil structure may be considered as the shape, size and spatial arrangement of individual and variously stable aggregated soil particles. It plays an important role in the creation of the soil pore network (shape, size distribution, connectivity, etc.), which also affects the storage and move- ment of water. Aggregate size and stability are important factors in understanding soil erosion and surface sealing (Nimmo, 2004). Soil structure may change dynamically due to various internal and external causes (e.g. wetting and drying, climate, root penetration, soil fauna, agricul- tural management) (Ghezzehei, 2012); however limited studies have been conducted investigating changes in soil aggregate stabilities based on different plant growth stages, especially in the case of microaggregate stability studies (Totsche et al., 2018). Among other soil structure charac- terization methods, the aggregate stability measurements facilitate the determination of the persistence of soil struc- ture under destructive impacting factors. The destructive
Á. HOREL et al.
256
activity of water is most frequently measured by wet siev- ing or a simulated rainfall system (Amézketa, 1999). The particle size distribution (PSD) analysis for determining the stability of microaggregates belongs to this group of testing methods (Amézketa et al., 2003; Bieganowski et al., 2010).
Depending on the type of soil, biochar may have varying effects on aggregate stability, which may increase after bio- char addition to silty clay and clayey soils (Hartley et al., 2016; Ouyang et al., 2013; Sun and Lu, 2014).
When a large amount of organic material is present in a given soil matrix, commonly used PSD methods such as the sieve-pipette method (based on sedimentation) cannot be used with a high degree of reliability. In the case of pure biochar, its specific gravity is lower than 1 so it wouldn’t settle, the sieve-pipette method is very difficult to utilize;
therefore, in the present study the laser diffraction method (LDM) for both PSD measurements and soil microaggre- gate stability studies was applied. Currently, the LDM in aggregate stability measurements is not a commonly used technique yet (Amézketa et al., 2003; Mukherjee and Lal, 2013), therefore the LDM is a relatively new approach when investigating ash, charcoal, or biochar amended soils.
Although many studies have investigated changes in soil physical properties as a result of biochar addition to soils (Hartley et al., 2016; Jeffery et al., 2015; Ouyang et al., 2013), the present study examines many of these charac- teristics over a period of a vegetable growing season, in different phaenological stages, under regular irrigation and natural rainfall conditions.
The aim of the present study was to investigate changes in the physical and structural properties of soil after biochar addition to agricultural silt loam soil over time and its inter- actions within the soil system. Our interests were focused on the changes in i) macroaggregate stability; ii) microag- gregate stability; and iii) aggregate stability indices. The study was based on the hypotheses that i) macro- and microaggregate stability changes will intensify over time at different plant development stages, as a response to plant root development; ii) these soil physical parameters are not only altered by environmental changes such as previous tillage, irrigation, plant growth, and root penetration, but are also affected by the rate of biochar addition.
MATERIALS AND METHODS
The soil samples used in the present study were collect- ed from a silt loam, freshly tilled arable soil (46.92936°N, 17.67033°E; USDA: eroded Alfisol with long-term vine- yard history) from the upper 28 cm (A horizon). The basic soil parameters are presented in Table 1.
Biochar was bought commercially for the experi- ment, from a manufacturer holding a European Biochar Certificate (EBC). Based on information provided by the manufacturer and a certificate of analysis, the biochar was made from paper fibre and grain husk materials using Pyreg-reactor technology at approximately 600ºC. The PSD of the pure biochar amendment used in the experiment is shown in Table 1 along with its chemical properties. At the time of purchase the following additional properties were noted based on the manufacturer’s certificate: bulk density 0.224 g cm-3, hydrogen to carbon molar ratio (H/C) = 0.39, total ash = 38.9%, and surface area correlation = 199 m2 g-1 (dry weight).
For the experiment, 2 kg of previously homogenized soil were placed in each pot, with dimensions of 14 cm in height and an 18 cm diameter with a drain outlet, Capsicum annuum L. (green pepper) were planted at the two to four leaves stages.
There were four different treatments: the control and three biochar dosages, these were studied in three replicates.
Biochar additions to the soils were calculated based on an air-dried soil weight percentage. Soils and biochar amounts were measured separately for each setup and homogenized thoroughly before placing them in pots. Out of the four treatments, one was used as a control and received no bio- char (0%), while the other three were amended with biochar in the amount of 0.5, 2.5, and 5.0% by dry weight; hereafter referred to as C, BC0.5, BC2.5, and BC5.0, respectively.
The pots were then placed in natural environmental set- tings, e.g. natural sunlight and rainfall, in order to better simulate field conditions; however, during periods of water deficiency, irrigation (200 ml tap water per pot per irrigation event) was also performed to reduce plant stress. Natural rain water levels and irrigation activity were monitored using an ECRN-100 rain gauge (Decagon Devices Inc.,
Table 1. Basic parameters of the pure biochar and the control soil sample
Type
Particle size distribution (%)
pH-H2O Organic C (%)
K2O P2O5 Total N (%)
NH4+-N NO3--N CaCO3
< 6.6 6.6- (%)
52.5 52.5- 2000
µm mg kg-1 mg kg-1
Biochar 1.57 13.90 84.52 10.33 27.89 13570.32 5031.10 1.01 1.86 n.d. –
Soil 24.13 50.03 25.84 7.94 0.93 443.14 977.87 0.14 5.84 8.76 10.4
Pullman, WA), where the cumulative amount of precipi- tation including irrigation water was 145.2 mm (week 6), 187.3 mm (week 10), and 248.8 mm (week 12) (Fig. 1).
Selected pots were disassembled at week 0 (W0), 6 (W6), 10 (W10), and 12 (W12) in order to study the changes in the physical and structural characteristics of soil corresponding to three distinguishable plant phaenological phases, with the main focus being on micro- and macroag- gregate stability. W0 data represents the starting parameters all four treatments prior to biochar addition; W6 data signi- fies the end of exponential plant growth; W10 represents the fruit development of mature plants; and W12 represents the time period when fruit harvesting was performed. The different plant growth phases were determined by observa- tion, such as tiller and leaf numbers, flowering stages, fruit development, and root and shoot system biomass weight.
Fruit harvesting took place at W10 of the experiment from selected disassembled pots (two plants per treatment) and at W12 from all of the remaining pots (8 plants per treatment), and the data obtained were used to further evaluate micro- and macroaggregate stability changes in soil. The present study is a part of a more complex study investigating the effects of biochar addition to the biological, chemical, and physical parameters of soil (Horel et al., 2018b).
During the disassembly of selected pots, the roots were carefully removed, soil samples were air dried, gen- tly homogenized, hand-milled and sieved through a 2 mm sieve. All of the soil physical measurements were per- formed in three replicates.
Macroaggregate stability (MaAS, %) was measured by a wet sieving apparatus (Eijkelkamp), where 4 g of soil per sample from 1-2 mm size aggregates were used (Kemper and Rosenau, 1986). After careful pre-moistening, sam- ples were placed into 0.25 mm mesh size sieves, immersed in containers filled with distilled water, and moved in an upward and downward direction for 3 min (stroke = 1.3 cm, at about 34 times min-1, fnd). After transferring the sieves
to alternative containers, they were immersed in sodium pyrophosphate dispersing solution (with a concentration of 2 g l-1) and moved up and down for 8 min, at the end of the operation, the non-dispersed, very stable aggregates were gently separated by a rubber stick ( fd). Both sets of contain- ers (soil suspensions with distilled water and pyrophosphate solution) were dried through evaporation before being oven dried (24 h, 105ºC) prior to mass measurements. The per- centage of the stable fraction was calculated as a ratio of the weight of the soil obtained in the distilled water (fd) divided by the sum of the obtained weights in the dispersing solu- tion and distilled water (fnd + fd; Eq. (1)).
. (1)
Microaggregate stability (MiAS, %) was calculated according to Vageler’s structure factor (Eq. (2)) from the rate of clay fractions determined with dispersion (cd) and without any dispersion (cnd) (Vageler, 1932):
100. (2)
The value of the clay fraction was measured by LDM using a Malvern Mastersizer 2000 device with a HydroG dispersion unit. Soil samples were sieved through a 2 mm sieve prior to LDM analysis. Dry soil samples (without the prior removal of organic matter and calcium carbon- ate) were moistened by adding 1-1.5 ml of Calgon solution (33 g l-1 of sodium-hexametaphosphate and 7 g l-1 sodium- bicarbonate), the soil paste was washed into a ~800 cm3 volume tank of the dispersion unit and a further 25 cm3 of Calgon solution was also added. The soil suspension was treated with ultrasound at 75% of maximum pow- er (0.75 × 35 W or 0.75 × 40 kHz) for 240 s before the measurements were taken (Bieganowski et al., 2010). The obscuration values were between 10 and 20%. The Mie theory was applied (refraction index: 1.33 for water and Fig. 1. The total amount of precipitation and irrigation (vertical bars) and sampling times (x signs) of the experiment. Plant phaenologi- cal stages are presented by dashed lines and arrows.
Á. HOREL et al.
258
1.52 for soil, absorption index: 0.1 for the dispersed phase;
general purpose analysis; irregular shape ratio) (Ryżak and Bieganowski, 2011). The clay-silt fraction boundary was set at 6.6 µm based on Makó et al. (2017), while 52.5 µm was chosen as the silt-sand fraction boundary to make the results more comparable with the sieve-pipette method. In the case of the non-dispersing technique, neither ultrasound application, nor chemical compounds were used. During laser analysis continuous stirring and pumping was applied, which, along with premoistening prevented biochar from floating on the water surface, and hence overcame the limi- tations of the pipette method.
Based on the PSD curves of both the dispersed and non- dispersed particles, the geometric mean diameter (GMD) was calculated. In addition, the aggregate stability index (SIGMD) which is the ratio of the GMD of the non-dispersed to the dispersed particles was calculated.
An Independent-Sample T Test, One-Way ANOVA (Duncan test or Tamhane’s test depending on the homoge- neity of variances examined by Levene’s test) and Boxplot analysis (SPSS 13.0) were conducted to compare the effects of biochar amendment and time on the measured soil physi- cal parameters. The combined effects of treatment and time on the investigated soil physical properties were also tested with the analysis of variance, ANOVA (Univariate General Linear Model; SPSS 13.0). The relationships between the selected soil properties were further investigated with the linear regression method (Linear regression, SPSS 13.0).
RESULTS
In general, macroaggregate stability (MaAS) increased to some extent with increasing biochar addition as com- pared with the control (Fig. 2a). An increase in MaAS was also detectable in the control treatment over time, where a 49.5% higher stable aggregate ratio was found in W6 samples compared with W0 (Fig. 2a). Similar, but more pronounced results were observed at W6 when biochar was present in the soil. 64.7, 131.2, and 174.7% higher MaAS values were found for BC0.5, BC2.5, and BC5.0, respec- tively, compared with the W0 controls (Fig. 2a). Later in the experiment, MaAS ratios were still higher for the dif- ferent treatments compared with the controls; however, due to environmental factors, such as regular irrigation, some decreases in MaAS values were also observed towards the end of the experiment (Fig. 2a). These changes were still not significant among treatments over time, except for the control (W0 compared with W6) and the BC5.0 treatment (between W6 and W12).
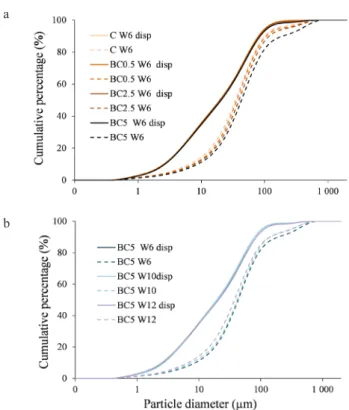
During microaggregate stability measurements, the LDM PSD of differently treated soil samples from different stages of the experiment were measured with and with- out dispersion pretreatment. Figure 3a illustrates the PSD curves of the soils using both methods during the plant maturing period, while Fig. 3b illustrates the BC5.0 dos- ages at different stages of plant growth. The PSD curves of the dispersed samples (which in the present study are
considered the true PSD) did not change significantly either due to different biochar (BC) doses, nor during the different phaenological periods. On the contrary, the non-dispersed PSD curves of the samples, which reflect the structure and aggregate stability of the soil, showed substantial differ- ences depending on BC treatments and plant growth stages.
A greater similarity between the dispersed and non-dis- persed PSD curves of a given sample indicates the reduced
Fig. 2. Differences in (a) macroaggregate stability data; (b) micro- aggregate stability data; and (c) aggregate stability indices. W rep- resents the number of weeks in the experiment, while C, BC0.5, BC2.5, and BC5.0 represent the control, 0.5, 2.5, and 5.0% bio- char additions to soils, respectively. MaAS – macroaggregates stability; MiAS – microaggregates stability; SIGMD denotes the aggregate stability index based on the geometric mean diameter of particles. Means denoted by the same index did not significantly differ at p < 0.05 according to the multiple range test; lowercase letters denote the comparison within biochar treatments, while uppercase letters compare the means of time periods. Error bars indicate ±1 SE.
b a
c
impact of the soil aggregates caused by dispersion processes as well as reduced aggregate stability. The control samples showed the least stable aggregates at W6 (Fig. 3a) and BC5 at W12 (Fig. 3b), which implies that BC can significantly affect the MiAS values. The differently measured PSD data were compared in a USDA soil texture triangle (Fig. 4).
Figure 4 demonstrates that the PSD of the dispersed soil is less dependent on the experimental conditions than on the PSD of the non-dispersed soils. This means that the far- ther apart the measured pairs of points are on the triangle in
both directions, the greater the microaggregate stability of a given soil. The above-mentioned PSD results were used to calculate the indices of microaggregate stability such as the MiAS and the SIGMD values.
The measured MiAS data of the differently treated sam- ples are shown in Fig. 2b. The freshly tilled soil at W0 had an average MiAS value of 47.11%. Significant increases in the MiAS values were observed during W6 when the plants reached maturity, and stability rose with values 30.2 and 49.6% larger (for C and BC5.0, respectively) compared with the W0 data (Fig. 2b). However, these changes slow- ly decreased during the fruit harvesting phase, resulting in overall 8.9, 18.7, 36.5, and 33.6% higher MiAS values in the case of C, BC0.5, BC2.5, and BC5.0, respectively, compared with the W0 data. In general, a small amount of biochar addition increased the MiAS value of the soils, but BC5.0 and BC2.5 showed similar MiAS data. These dif- ferences were statistically detectable in the W6 and W12 samples (Fig. 2b). Similar changes were found in the SIGMD
values over time and different BC doses (Fig. 2c). The calculated stability indexes (MaAS, MiAS and SIGMD) are presented in Fig. 5, where a very good correlation is shown Fig. 3. Comparison between particle size distributions obtained
by (a) different biochar treatment doses measured after dispersion (disp) and without dispersion pretreatment (W6); (b) different phaenological stages measured after dispersion (disp) and without dispersion pretreatment (BC5.0 biochar dose). W represents the number of weeks in the experiment, while C, BC0.5, BC2.5, and BC5.0 represent the control, and 0.5, 2.5, and 5.0% biochar addi- tions to soils, respectively.
a
b Fig. 4. Distribution of soil textures in the USDA textural trian-
gles, where the circle represents the LDM PSD of soil samples originating from different plant phaenological phases and biochar treatments measured after dispersion and the dotted area signifies the LDM for aggregate stability measurements, without chemical dispersion and sonication.
Fig. 5. Correlations between a – SIGMD and MaAS, b – SIGMD and MiAS, and c – MiAS and MaAS aggregate stability indexes. SIGMD
denotes the aggregate stability index based on the geometric mean diameter of particles; MaAS – macroaggregates stability; MiAS – microaggregates stability (n = 13).
Á. HOREL et al.
260
between SIGMD and MiAS (R2 = 0.86), a good correlation was noted between SIGMD and MaAS (R2 = 0.62) and between MiAS and MaAS (R2 = 0.53). In summary, the results of ANOVA tests analysing the effect of biochar treatment and time on the examined soil physical parameters are listed in Table 2.
DISCUSSION
The present paper reports on soil structural and physi- cal parameter changes caused by biochar addition under natural environmental conditions and over the course of plant growth and development. In summary, both biochar dosage and time combined had positive effects on MaAS values. A higher grade of soil aggregation may be directly related to plant growth and health, as bacteria, fungi, and fungal hyphae can also help to hold together soil particles (Kelly et al., 2017; Vergani and Graf, 2016; Warnock et al., 2010). The formation of soil aggregate may be a response to changes in soil organic carbon content (Liu et al., 2014), and with the support of a binding agent present in the soils, microaggregates can develop into macroaggregates. The growth of plant roots may also act as a binding agent in the development of more resilient aggregates via polysaccha- rides or organic residues (Amézketa, 1999). During plant growth both MiAS and MaAS values were substantially higher compared with the W0 data, especially in the case of biochar amended soils, which also indicates improved soil conditions for crop growth. The high MiAS value produced by BC5.0 shows that more coagulated colloids are present in BC5.0 treatment; therefore, more water stable aggregates may be formed. Several publications reported increased aggregate stability after biochar addition (Ouyang et al., 2013; Šimanský et al., 2016), which was also confirmed by the present experiment. Macroaggregate stability is also affected by plant root development over time, without the addition of any soil enhancer materials (Angers and Caron, 1998; Vergani and Graf, 2016). Microbial synthetic prod-
ucts may serve as binding agents for aggregate formation while water may function as the main agent for aggregate breakdown (Bossuyt et al., 2001; Lynch and Bragg, 1985).
Capsicum annuum L. has a high probability of mycorrhizal colonization (Sensoy et al., 2007), which means that fungal hyphae growth may be enabled. The relationship between biochar and mycorrhiza in the root and soil system, howev- er, may be dependent on the types of biochar or soil, among many other environmental conditions. The plant growth, which is enhanced by biochar amendment may result in a different crop yield as well, especially when the soil is not nutrient limited (Alburquerque et al., 2013). An increase in fruit growth may also increase nutrient uptake by the plant from the soil, and consequently less nitrogen may be available for mycorrhizal and microbial growth, which in turn influences aggregate stability. In the present study, the best fruit yield was observed in the case of BC5.0, when only mature (> 25 g) fruit were measured at harvest. When all mature and undeveloped fruit were accounted for in the total fruit yield, then the BC2.5 treatment showed the high- est fruit biomass (8% higher compared to BC5.0). Even though these changes were pronounced, they were statis- tically insignificant (p > 0.05); therefore, the crop yields were not considered as a major factor contributing to soil physical changes.
Soil moisture content may influence the physical char- acteristics of a given soil (e.g. compaction), such as the particle size distribution (PSD) by splash detachment, how- ever, over the course of the experiment this was unlikely to occur. In the present study, the same soil was used for all treatments; therefore, the expected result was to find zero or minimal changes over time in PSD (Fig. 3). It was found in previous studies that biochar may help to retain more water in amended soils resulting in improved soil water holding capacities (Ulyett et al., 2014). On the other hand, biochar amended soils may experience a faster drying period after rainfall events compared with the control or amended soils with lower concentrations of biochar (Horel et al., 2018b), resulting in similar overall water contents in the investi- gated soils. The concentration of biochar however, may reach a limit when soil moisture increases or retention does not result in significantly higher moisture contents (Dugan et al., 2010). Our study showed similar results, the high- est overall soil moisture content was observed in the case of the amended treatments with the most biochar, where the studied soil had a relatively good infiltration capability, which may in turn facilitate more suitable environmental conditions for plant growth and development.
CONCLUSIONS
1. The present study emphasizes the strong connec- tions between soil structure changes and plant development phases, and also emphasizes the importance of soil and site specific analyses prior to amendment with biochar.
Table 2. Effect of biochar treatment and time on the exam- ined soil physical parameters. Summary results of ANOVA tests (Univariate General Linear Model), for macroaggregate stability (MaAS, %), microaggregate stability (MiAS, %), aggregate stabi- lity index (SIGMD). p represents the probability (significance level from ANOVA). Represents significant difference at *p < 0.05 and
**at p < 0.01
Factors Investigated soil parameters
MaAS MiAS SIGMD
p
Treatment <0.001** 0.002** <0.001**
Time 0.111 0.012* <0.001**
Treatment × Time 0.057 0.736 0.117
2. There were changes in aggregate stability without the addition of biochar to silt loam soil; however, these changes were less pronounced when compared to the bio- char amended treatments, indicating better soil structural strength in the presence of biochar.
3. The amount of biochar addition may influence the rate of aggregate stability increase, such that too much bio- char addition may not provide optimal results.
4. There were distinct connections between the physical and structural properties of the investigated soil.
5. Good correlations were found between the inves- tigated soil structural parameters and soil changes due to biochar addition, including changes, which occurred during different plant phaenological stages.
6. Laser diffraction method was used to analyse soil par- ticle size distribution instead of the sieve-pipette method, and shown to be a very useful tool with which to analyse highly organic soils, and soils amended with ash, charcoal, or biochar for particle size distribution.
ACKNOWLEDGEMENT
This paper was supported by the János Bolyai Research Scholarship of the Hungarian Academy of Sciences.
Conflict of interest: The Authors do not declare con- flict of interest.
REFERENCES
Alburquerque J.A., Salazar P., Barrón V., Torrent J., del Campillo M.d.C., Gallardo A., and Villar R., 2013. Enhanced wheat yield by biochar addition under different mineral fertiliza- tion levels. Agronomy for Sustainable Development, 33(3), 475-484. https://doi.org/10.1007/s13593-012-0128-3 Amézketa E., 1999. Soil aggregate stability: a review. J. Sustai-
nable Agric., 14(2-3), 83-151.
https://doi.org/10.1300/j064v14n02_08
Amézketa E., Aragües R., Carranza R., and Urgel B., 2003.
Macro- and micro-aggregate stability of soils determined by a combination of wet-sieving and laser-ray diffraction.
Spanish J. Agric. Res., 1(4), 12.
https://doi.org/10.5424/sjar/2003014-50
An C. and Huang G., 2015. Environmental concern on biochar:
capture, then what? Environmental Earth Sciences, 74(12), 7861-7863. https://doi.org/10.1007/s12665-015-4741-8 Anderson C.R., Condron L.M., Clough T.J., Fiers M., Stewart
A., Hill R.A., and Sherlock R.R., 2011. Biochar induced soil microbial community change: Implications for biogeo- chemical cycling of carbon, nitrogen and phosphorus.
Pedobiologia, 54(5-6), 309-320. https://doi.org/10.1016/j.
pedobi.2011.07.005
Angers D.A. and Caron J., 1998. Plant-induced changes in soil structure: processes and feedbacks. Biogeochemistry, 42(1), 55-72. https://doi.org/10.1007/978-94-017-2691-7_3 Bieganowski A., Ryżak M., and Witkowska-Walczak B., 2010.
Determination of soil aggregate disintegration dynamics using laser diffraction. Clay Minerals, 45, 23-34.
https://doi.org/10.1180/claymin.2010.045.1.23
Bossuyt H., Denef K., Six J., Frey S.D., Merckx R., and Paustian K., 2001. Influence of microbial populations and residue quality on aggregate stability. Appl. Soil Ecol., 16(3), 195-208.
https://doi.org/10.1016/s0929-1393(00)00116-5
Dugan E., Verhoef A., Robinson S., Sohi S., Gilkes R. and Prakpongkep N., 2010. Bio-char from sawdust, maize sto- ver and charcoal: impact on water holding capacities (WHC) of three soils from Ghana. Proc. 19th World Soil Congr., IUSS, August 1-6, Brisbane, Australia.
Gascó G., Cely P., Paz-Ferreiro J., Plaza C., and Méndez A., 2016. Relation between biochar properties and effects on seed germination and plant development. Biol. Agric.
Hort., 32(4), 237-247. https://doi.org/10.1080/01448765.20 16.1166348
Ghezzehei T.A., 2012. Soil structure. In: Handbook of soil sci- ences: properties and processes (Eds P.M. Huang, Y. Li, M.E. Sumner). CRC, Boca Raton, FL, USA.
Hartley W., Riby P., and Waterson J., 2016. Effects of three different biochars on aggregate stability, organic carbon mobility and micronutrient bioavailability. J. Environ.
Manag., 181, 770-778.
https://doi.org/10.1016/j.jenvman.2016.07.023
Helliwell R., 2015. Effect of biochar on plant growth.
Arboricultural J., 37(4), 238-242.
Horel A., Potyó I., Szili-Kovács T., and Molnár S., 2018a.
Potential nitrogen fixation changes under different land uses as influenced by seasons and biochar amendments.
Arabian J. Geosciences, 11, 559. https://doi.org/10.1007/
s12517-018-3916-5
Horel Á., Tóth E., Gelybó G., Dencső M., and Potyó I., 2018b.
Soil CO2 and N2O emission drivers in a vineyard (Vitis vinifera) under different soil management systems and amendments. Sustainability, 10(6), 1811.
https://doi.org/10.3390/su10061811
Jeffery S., Abalos D., Spokas K.A., and Verheijen F.G.A., 2015.
Biochar effects on crop yield. In: Biochar for environmen- tal management: science and technology (Eds J. Lehmann, S. Joseph). Earthscan, London, UK.
Jien S.-H. and Wang C.-S., 2013. Effects of biochar on soil prop- erties and erosion potential in a highly weathered soil.
Catena, 110, 225-233. https://doi.org/10.1016/j.catena.
2013.06.021
Kelly C.N., Benjamin J., Calderón F.C., Mikha M.M., Rutherford D.W., and Rostad C.E., 2017. The incorporation of biochar carbon into stable soil aggregates: the role of clay mineral- ogy and other soil characteristics. Pedosphere, 27, 694-704.
https://doi.org/10.1016/s1002-0160(17)60399-0
Kemper W.D. and Rosenau R.C., 1986. Aggregate stability and size distribution. In: Methods of soil analysis, Part 1. (Ed.
A. Klute). American Society of Agriculture, Soil Science Society of America, Madison, WI, USA.
https://doi.org/10.2136/sssabookser5.1.2ed.c17
Liang B., Lehmann J., Solomon D., Kinyangi J., Grossman J., O’Neill B., Skjemstad J.O., Thies J., Luizão F.J., Petersen J., and Neves E.G., 2006. Black carbon increases cation exchange capacity in soils. Soil Sci. Soc. America J., 70(5), 1719-1730. https://doi.org/10.2136/sssaj2005.0383 Liu Z., Chen X., Jing Y., Li Q., Zhang J. and Huang Q., 2014.
Effects of biochar amendment on rapeseed and sweet potato yields and water stable aggregate in upland red soil. Catena, 123, 45-51. https://doi.org/10.1016/j.catena.2014.07.005
Á. HOREL et al.
262
Lynch J.M. and Bragg E., 1985. Microorganisms and soil aggre- gate stability. In: Advances in soil science (Ed. B.A.
Stewart). Springer New York, New York, NY, USA.
https://doi.org/10.1007/978-1-4612-5088-3_3
Makó A., Tóth G., Weynants M., Rajkai K., Hermann T. and Tóth B., 2017. Pedotransfer functions for converting laser diffraction particle-size data to conventional values.
European J. Soil Sci., 68, 769-782. https://doi.org/10.1111/
ejss.12456
Mukherjee A. and Lal R., 2013. Biochar impacts on soil physi- cal properties and greenhouse gas emissions. Agronomy, 3(2), 313-339. https://doi.org/10.3390/agronomy3020313 Nimmo J.R., 2004. Aggregation: physical aspects. In:
Encyclopedia of soils in the environment (Ed. D. Hillel).
Academic Press, London, UK.
Novak J.M., Lima I., Xing B., Gaskin J.W., Steiner C., Das K.C., Ahmedna M., Rehrah D., Watts D.W., Busscher W.J., and Schomberg H., 2009. Characterization of designer bio- char produced at different temperatures and their effects on a loamy sand. Annals Environ. Sci., 3, 195-206.
https://doi.org/10.2134/jeq2011.0133
Ouyang L., Wang F., Tang J., Yu L., and Zhang R., 2013.
Effects of biochar amendment on soil aggregates and hydraulic properties. J. Soil Sci. Plant Nutrition, 13(4), 991- 1002. https://doi.org/10.4067/s0718-95162013005000078 Ryżak M. and Bieganowski A., 2011. Methodological aspects of
determining soil particle-size distribution using the laser diffraction method. J. Plant Nutrition Soil Sci., 174(4), 624- 633. https://doi.org/10.1002/jpln.201000255
Schiewer S. and Horel A., 2017. Biodiesel addition influences biodegradation rates of fresh and artificially weathered die- sel fuel in Alaskan sand. J. Cold Regions Eng., 31(4), 04017012.
https://doi.org/10.1061/(asce)cr.1943-5495.0000138 Sensoy S., Demir S., Turkmen O., Erdinc C., and Savur O.B.,
2007. Responses of some different pepper (Capsicum ann- uum L.) genotypes to inoculation with two different arbuscular mycorrhizal fungi. Scientia Hort., 113(1), 92-95.
https://doi.org/10.1016/j.scienta.2007.01.023
Sun F. and Lu S., 2014. Biochars improve aggregate stability, water retention, and pore-space properties of clayey soil.
J. Plant Nutrition Soil Sci., 177(1), 26-33.
https://doi.org/10.1002/jpln.201200639
Surda P., Lichner L., Nagy V., Kollar J., Iovino M. and Horel A., 2015. Effects of vegetation at different succession stag- es on soil properties and water flow in sandy soil. Biologia, 70(11), 1474-1479.
https://doi.org/10.1515/biolog-2015-0172
Šimanský V., Horák J., Igaz D., Jonczak J., Markiewicz M., Felber R., Rizhiya E.Y., and Lukac M., 2016. How dose of biochar and biochar with nitrogen can improve the parameters of soil organic matter and soil structure?
Biologia, 71(9), 989-995.
https://doi.org/10.1515/biolog-2016-0122
Totsche K.U., Amelung W., Gerzabek M.H., Guggenberger G., Klumpp E., Knief C., Lehndorff E., Mikutta R., Peth S., Prechtel A., Ray N., and Kögel-Knabner I., 2018.
Microaggregates in soils. J. Plant Nutrition Soil Sci., 181(1), 104-136. https://doi.org/10.1002/jpln.201600451 Ulyett J., Sakrabani R., Kibblewhite M., and Hann M., 2014.
Impact of biochar addition on water retention, nitrification and carbon dioxide evolution from two sandy loam soils.
European J. Soil Sci., 65(1), 96-104. https://doi.org/10.1111/
ejss.12081
Vageler P., 1932. Der Kationen- und Wasserhaushalt des Mineralbodens: Vom Standpunkt der Physikalischen Chemie und Seine Bedeutung für die Land- und Forstwirtschaftliche Praxis. Springer, Verlag Berlin Heidelberg. https://doi.org/10.1002/jpln.19320260511 Vergani C. and Graf F., 2016. Soil permeability, aggregate sta-
bility and root growth: a pot experiment from a soil bioengineering perspective. Ecohydrology, 9(5), 830-842.
https://doi.org/10.1002/eco.1686
Warnock D.D., Mummey D.L., McBride B., Major J., Lehmann J. and Rillig M.C., 2010. Influences of non- herbaceous biochar on arbuscular mycorrhizal fungal abundances in roots and soils: Results from growth-cham- ber and field experiments. Applied Soil Ecology, 46(3), 450-456. https://doi.org/10.1016/j.apsoil.2010.09.002.