Soil physical properties affected by biochar addition at different plant phaenological phases. Part II**
András Makó1,2, Gyöngyi Barna1*, and Ágota Horel1
1Institute for Soil Sciences and Agricultural Chemistry, Centre for Agricultural Research, Hungarian Academy of Sciences, Herman O. St. 15. Budapest 1022, Hungary
2University of Pannonia Georgikon Faculty, Deák F. St. 16. Keszthely 8360, Hungary Received September 15, 2018; accepted April 23, 2019
*Corresponding author e-mail: barna.gyongyi@agrar.mta.hu
**This work was supported by the National Research, Development and Innovation Office (NKFIH) under grant OTKA PD-116157 (2015-2019) and K119475 (2016-2020).
A b s t r a c t. A great emphasis has been placed on biochar addition to soils to improve its physical, chemical, and biologi- cal properties in recent times in order to achieve improved crop growth and yields. The present study explored to soil physical changes through different plant growth stages caused by biochar addition to silt loam soil in a pot-experiment. Our research focused on changes in soil bulk density, aggregate size distribution, and saturated hydraulic conductivity. The soils were amended with different amounts of biochars (control with 0, BC0.5 with 0.5%, BC2.5 with 2.5%, and BC5.0 with 5.0% biochar, by weight).
Capsicum annuum L. were planted at a two-four leaf stage. Soil samples were taken at 6, 10 and 12 weeks after planting. The biochar amendment resulted in a significant decrease in soil bulk density values. Soil saturated hydraulic conductivity values ranged between 5.5 and 7.9 times higher for all treatments com- pared to the controls.
K e y w o r d s: biochar, aggregate size distribution, hydraulic conductivity, bulk density
INTRODUCTION
Biochar is a substance with a high carbon content, which has been widely studied in recent decades as a soil enhancer material to promote soil quality, reduce green- house gas emissions, and to achieve improved crop yields (An and Huang, 2015; Gascó et al., 2016; Helliwell, 2015).
The addition of charcoal, ash, or biochar to soils can change soil chemical (Horel et al., 2019a; Jien and Wang, 2013;
Liang et al., 2006), microbial (Anderson et al., 2011; Horel et al., 2018), and physical-hydrophysical properties (Jien and Wang, 2013; Liang et al., 2006; Novak et al., 2009;
Sun and Lu, 2014). While biochar addition to soils may influence soil and plant health, the different stages of plant
and root growth may also further affect soil hydrological properties, including the moisture regime (Angers and Caron, 1998; Surda et al., 2015), therefore changes in soil properties over time should be carefully investigated before its use.
The soil pore network (shape, pore size distribution, connectivity, etc.) may have a great influence over the stor- age and movement of water within the soil matrix. Internal and external forces such as wetting and drying, climate, root penetration, soil fauna, agricultural management etc.
may cause significant changes in soil structure (Ghezzehei, 2012). While biochar can affect soil characteristics, the type of soil is also a very important factor as biochar addition may result in varying effects on soil aggregates (Hartley et al., 2016; Ouyang et al., 2013; Sun and Lu, 2014).
Soil bulk density (ρb) is a good indicator of soil com- paction, as the higher the bulk density of a given soil the more compact it is. High ρb values tend to negatively influence soil characteristics, significantly affecting soil aeration, water infiltration through the soil profile and the available water capacity which in turn affects root growth and plant nutrient availability. Studies have shown that biochar addition to soil can decrease its ρb values (Laird et al., 2010a; Zhang et al., 2012); thereby positively influenc- ing the porosity of highly compacted soils, especially its macroporosity. Numerous studies found that in the case of coarse textured soils, the water holding capacity could be improved by biochar addition (Dugan et al., 2010; Karhu et al., 2011); however, studies concerning the connection of these changes to plant development phases are lacking in the literature.
© 2020 Institute of Agrophysics, Polish Academy of Sciences
Soil saturated hydraulic conductivity (Ksat) measure- ments may provide information on the rate at which soil water can move within or leave the soil system, indicat- ing possible nutrient leaching rates, which may affect plant growth and health and also lead to the contamination of groundwater. The rate of change in Ksat values as a result of biochar addition to soils may depend, among other factors, on the type of biochar, the rate at which biochar is applied, the particle size distirbution (PSD) of the biochar or soil (Lim et al., 2016), or the physical and chemical characteris- tics of the soil used. Biochar additions to soils have varying effects on changes in their Ksat values. Barnes et al. (2014) observed a 50% decrease in Ksat in coarse textured sandy soils, while the Ksat values of clayey soils increased by over 300%. Laird et al. (2010b); however, did not observe any changes in the Ksat values of fine-loamy soils, neither did Ouyang et al. (2013) concerning silty clay soil.
There are numerous examples of research studying the changes in soil physical properties after biochar addition to soils (Hartley et al., 2016; Jeffery et al., 2015; Ouyang et al., 2013). The present study aims to investigate some of these characteristics over a period of plant growth, divided into different phaenological stages from planting to fruit harvest, under natural environmental conditions (e.g. sun- light, rainfall).
In this study we investigated the effects of biochar addition to silt loam on the physical and structural proper- ties of the soil and its relationship to the state of the soil matrix (Horel et al., 2019b). The second part of the study
mainly focused on changes in i) aggregate size distribution;
ii) saturated hydraulic conductivity; and iii) bulk density of the soils over time while varying the biochar doses. We hypothesized that i) the amount of biochar added to the silt loam soil would have significant effects on soil aggregate size distribution changes at different rates over time; and ii) other soil physical parameters such as soil Ksat or bulk den- sity values are not only altered by environmental changes such as previous tillage, irrigation, plant growth, and root penetration, but are also affected by the rate of biochar addition.
MATERIALS AND METHODS
The soil used was an eroded Alfisol (according to USDA) freshly tilled, silt loam, from the upper 28 cm (A horizon).
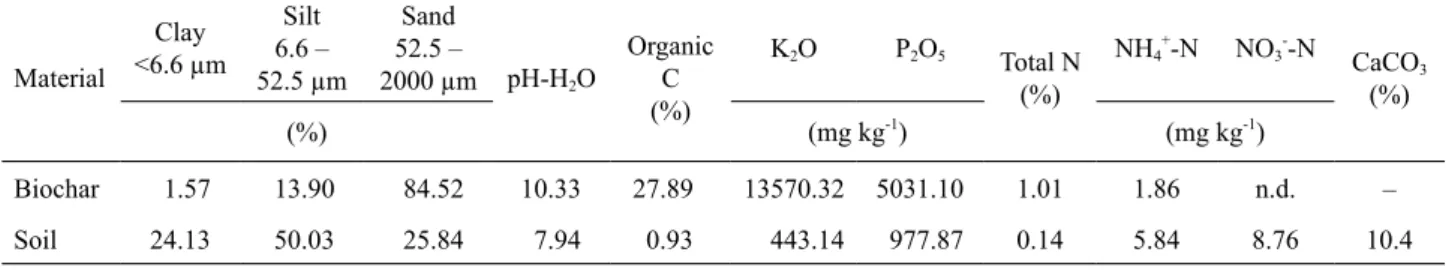
The basic soil parameters are presented in Table 1.
Biochar was obtained commercially; it was certified with a European Biochar Certificate (EBC). The biochar was made from paper fibre and grain husk materials using Pyreg-reactor technology at approximately 600ºC. We list- ed the main parameters of pure biochar in Table 1.
The experimental setup included 2 kg of homogenized soil per pot with dimensions of 14 cm height and 18 cm diameter with a drain outlet. Green pepper (Capsicum ann- uum L.) were planted at the two to four leaves stages.
Four different treatment types were used: a control and three biochar dosages, studied in three replicates per sam- pling time (Fig. 1). We calculated the biochar additions to Table 1. Basic parameters of the pure biochar and the control soil sample
Material
<6.6 µmClay
6.6 –Silt 52.5 µm
52.5 –Sand
2000 µm pH-H2O Organic (%)C
K2O P2O5 Total N (%)
NH4+-N NO3--N CaCO3
(%)
(%) (mg kg-1) (mg kg-1)
Biochar 1.57 13.90 84.52 10.33 27.89 13570.32 5031.10 1.01 1.86 n.d. –
Soil 24.13 50.03 25.84 7.94 0.93 443.14 977.87 0.14 5.84 8.76 10.4
n.d. – not determined.
Fig. 1. Total amount of precipitation and sampling times.
the soils based on the air-dried soil weight percentage. Soil and biochar amounts were measured separately for each setup and homogenized thoroughly before placing them in pots. Out of the four treatments one was used as a control and received no biochar (0%) only plants, while the other three were amended with biochar in the amount of 0.5, 2.5, and 5.0% by dry weight (bw); hereafter referred to as C, BC0.5, BC2.5, and BC5.0, respectively.
Afterwards, we placed the pots under natural environ- mental settings, e.g. natural sunlight and rainfall, to better simulate field conditions; however, during times of water deficiency irrigation (200 ml tap water per pot per irrigation event) was also applied to reduce plant stress. Natural rain water and irrigation were monitored using an ECRN-100 rain gauge (Decagon Devices Inc., Pullman, WA), where the cumulative amount of precipitation including irrigation water at week: six – 145.2 mm, ten – 187.3 mm, and at week 12 it was 248.8 mm (Fig. 1).
Selected pots were disassembled at week 0 (W0), 6 (W6), 10 (W10), and 12 (W12) in order to study the chang- es in the physical and structural characteristics of the soil corresponding to three distinguishable plant phaenological phases, with the main factors of interest being the aggregate size distribution (ASD), bulk density (ρb), and saturat- ed hydraulic conductivity (Ksat). W0 data represents the starting parameters of all four treatments prior to biochar addition; W6 data signifies the end of exponential plant growth; W10 represents the fruit development of mature plants; and W12 when fruit harvesting was performed. We determined the different plant growth phases by observa- tion, such as tiller and leaf numbers, flowering stages, fruit development, and root and shoot system biomass weight.
During the disassembling of selected pots, the roots were carefully removed, the soil samples were air dried, gen- tly homogenized, hand-milled and sieved through a 2 mm sieve. All soil physical measurements were performed in three replicates.
We determined the aggregate size distribution (ASD) by shaker and dry sieve analyses using 100 g soil samples, where the mesh size of the sieves were 0.25 mm, 0.5 mm, and 1 mm, and the shaking time was 5 min (Kemper and Rosenau, 1986). In order to quantify the degree of gradation of the structured soils, we defined a modified coefficient of uniformity (UASD) as the ratio of aggregate diameters cor- responding to 60 and 10% (d60 and d10, respectively) finer on the cumulative ASD curve:
UASD= d60
d10. (mm)
According to equation, smaller UASD values corre- spond to a higher level of soil compactibility (Kézdi, 1974;
Natural Resources Conservation Services, 1994).
We measured the saturated hydraulic conductivity (cm d-1) with an Eijkelkamp permeameter (in a closed sys- tem) using disturbed soil samples, in three replicates. Air dried soil samples (100 g) were filled into a 5 cm in diameter
and 5 cm height sample holder, layer by layer, and manu- ally compacted with a rubber device from the top. It was assumed that the measured Ksat values were determined pri- marily by physical properties, such as compressibility, ρb, or the pore size distribution, of these artificial soil columns and all the treatment effects are reflected by these proper- ties in hydraulic conductivity. Measurements were carried out using tap water, and either the constant or falling head method (Klute and Dirksen, 1986), depending on the flow rate. We determined the geometric mean values from the log-normally distributed Ksat values (Nielsen et al., 1973).
The ρb values were also calculated (presented as g cm-3) of the artificial soil columns used for the Ksat measurements.
An Independent-Sample T Test, One-Way ANOVA (Duncan test or Tamhane’s test depending on the homoge- neity of variances examined by Levene’s test) and Boxplot analysis (SPSS 13.0) were conducted to compare the effects of biochar amendment (Treatment factor) and time (Time factor) on the measured soil physical parameters. The com- bined effects of treatment (Treatment * Time factor) and time on the investigated soil physical properties were also tested with an analysis of variance, ANOVA (Univariate General Linear Model; SPSS 13.0). The relationships between the selected soil properties were further investi- gated with a linear regression method (Linear regression, SPSS 13.0).
RESULTS
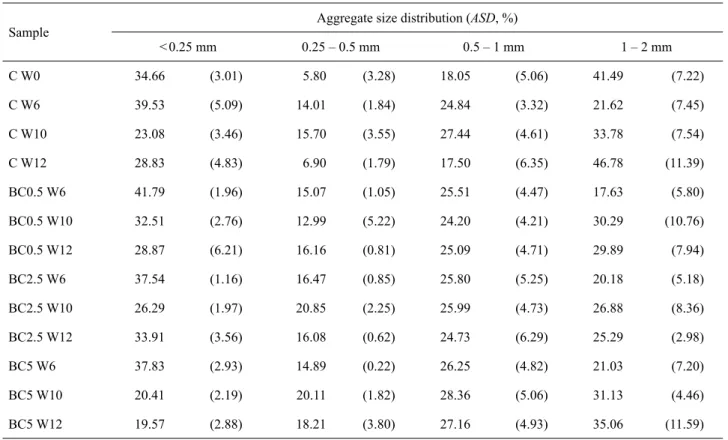
Four aggregate size ranges of below 0.25, 0.25-0.5, 0.5- 1, and 1-2 mm were investigated and analysed in the present study over time. The ASD values of the C W12 control had the highest percentage of aggregates with 1-2 mm aggre- gate sizes compared to each collected soil samples from all of the other treatments, including controls (Table 2). We observed both the smallest and the largest aggregate values in the control samples. The frequency of the 1-2 mm frac- tion increased in all biochar treated samples. In contrast, the frequency of the fraction under 0.25 mm decreased in all cases at the end of the experiment. The most nota- ble difference in aggregate sizes between treatments were observed in the 1-2 mm aggregate range. Aggregate sizes of between 0.5 and 1 mm showed the least changes within treatments over time (Table 2). The deviations for all of the other investigated aggregate sizes were more pronounced, indicating that changes in the lower (<0.25 mm) and higher (1-2 mm) aggregate size range were most likely to occur due to biochar addition and/or external environmental fac- tors, such as irrigation.
During the construction of artificial columns to measure Ksat and ρb values, the soil samples showed varying ρb values despite the exact same column filling method being applied (Fig. 2a). The average ρb of the artificial soil columns was 1.39±0.03 g cm-3 at the beginning of the study. After adding biochar to the soils, the soil ρb values showed a significant de- crease with increasing biochar amount. At W6 these values
Table 2. Aggregate size distributions at different plant growth phases, mean values, standard deviations in brackets
Sample Aggregate size distribution (ASD, %)
< 0.25 mm 0.25 – 0.5 mm 0.5 – 1 mm 1 – 2 mm
C W0 34.66 (3.01) 5.80 (3.28) 18.05 (5.06) 41.49 (7.22)
C W6 39.53 (5.09) 14.01 (1.84) 24.84 (3.32) 21.62 (7.45)
C W10 23.08 (3.46) 15.70 (3.55) 27.44 (4.61) 33.78 (7.54)
C W12 28.83 (4.83) 6.90 (1.79) 17.50 (6.35) 46.78 (11.39)
BC0.5 W6 41.79 (1.96) 15.07 (1.05) 25.51 (4.47) 17.63 (5.80)
BC0.5 W10 32.51 (2.76) 12.99 (5.22) 24.20 (4.21) 30.29 (10.76)
BC0.5 W12 28.87 (6.21) 16.16 (0.81) 25.09 (4.71) 29.89 (7.94)
BC2.5 W6 37.54 (1.16) 16.47 (0.85) 25.80 (5.25) 20.18 (5.18)
BC2.5 W10 26.29 (1.97) 20.85 (2.25) 25.99 (4.73) 26.88 (8.36)
BC2.5 W12 33.91 (3.56) 16.08 (0.62) 24.73 (6.29) 25.29 (2.98)
BC5 W6 37.83 (2.93) 14.89 (0.22) 26.25 (4.82) 21.03 (7.20)
BC5 W10 20.41 (2.19) 20.11 (1.82) 28.36 (5.06) 31.13 (4.46)
BC5 W12 19.57 (2.88) 18.21 (3.80) 27.16 (4.93) 35.06 (11.59)
W – represents the number of weeks in the experiment, while C, BC0.5, BC2.5, and BC5.0 represents the control and 0.5, 2.5, and 5.0%
biochar additions to the soils, respectively.
Fig. 2. Differences in: a – bulk density, b – saturated hydraulic conductivity data (means denoted by the same letter did not significantly differ at p < 0.05 according to the multiple range test; lowercase letters denote the comparison within biochar treatment, while upper- case letters compare the means of the time periods). W represents the number of weeks in the experiment, while C, BC0.5, BC2.5, and BC5.0 represent the control, 0.5, 2.5, and 5.0% biochar additions to soils, respectively. Error bars indicate the ±1 standard error of the mean for each prediction group.
a b
ranged from between 1.25±0.03 and 1.16±0.01g cm-3 for C and BC5.0, respectively. When comparing the W12 results, a further decrease in soil ρb was observed at high biochar additions (1.38±0.03 and 1.14±0.01 g cm-3 for C and BC5.0, respectively). However, these changes did not reflect a clear trend related to plant phaenological phases.
Ksat values showed a general increase with increasing biochar amount, with the extent of the increase decreas- ing over time (Fig. 2b). An increase in Ksat in the control treatments were also found during W6 and W10, while W12 data showed even lower average Ksat values than those measured in W0. The most stable Ksat values were measured in the case of BC0.5, where W6, W10, and W12 showed 5.5, 4.7, and 6.3 times higher values, respectively, indicating a beneficial combination of plant growth and a small amount of biochar in silt loam soil.
We analysed the effect of biochar treatment and time on bulk density, saturated hydraulic conductivity and the coef- ficient of uniformity with ANOVA. Treatment, Time and Treatment * Time factors were statistically significant for all soil physical parameters at p < 0.01. An exception to this trend occurred for the effect of the treatment on U values, where p < 0.02. In examining the possible causes of various degrees of compaction, we used the modified coefficient of uniformity (UASD) which showed a close relationship (R2 = 0.82-0.91) with both the ρb and Ksat values of the samples (Fig. 3a, 3c). Similarly, a good correlation between ρb and the measured Ksat values were found (R2 = 0.77) (Fig. 3b).
DISCUSSION
The results of biochar addition to silt loam soil with a particular emphasis on soil structural and physical changes were studied over the course of plant growth and develop- ment. A higher grade of soil aggregation may be directly related to plant growth and health, as bacteria, fungi, and fungal hyphae can also help to hold together soil particles (Kelly et al., 2017; Vergani and Graf, 2016; Warnock et al., 2010). The formation of soil aggregate may be a response to soil organic carbon (Liu et al., 2014), and with the sup- port of binding agents present in the soils, microaggregates may develop into macroaggregates.
The possible compaction effect due to irrigation, or other environmental conditions, is likely to depend on the particle (PSD) and aggregate size distribution (ASD). In the present study, the same soil was used for all treatments;
therefore it was expected that no changes or minimal changes would occur over time in PSD, and this was indeed found to be the case. On the other hand ASD is a good indi- cator of the aggregation processes within the soil matrix.
Different degrees of the aggregation of soil samples may be explained through biochar treatment, irrigation, precipita- tion or the effects of the plant roots. The ASD in the present study did not show major differences between the control and biochar added treatments during the different plant growth stages. However, as a slight increase in the macro-
aggregate sizes and a decrease in microaggregate sizes was observed in all treatments, the UASD values derived from ASD varied widely. Hartley et al. (2016) observed similar results, and the authors also found that the type of biochar also played a major role in aggregate formation, concluding Fig. 3. Relationships are based on a linear regression between:
a) the modified coefficients of uniformity (UASD) and bulk den- sity (ρb), b) hydraulic conductivity (Ksat) and bulk density, and c) hydraulic conductivity (Ksat) and the modified coefficients of uni- formity (UASD); (n = 13).
a
b
c
that some types of biochar addition may facilitate macro- aggregate formation but others may not affect the process significantly.
Through an investigation of the changes in soil bulk density decreased ρb values were observed compared to the control treatments in all biochar amended soils. In this experiment a decreasing ρb value was also noted in the case of control treatments during the first few weeks of the study, not only in biochar amended soils. However, after the initial reduction in ρb, soil compaction was also observed due to changes in environmental conditions. A significant decrease in soil bulk density was expected, as the specific gravity of the biochar was less than that of the soil, these results were similar to those found by other studies (Laird et al., 2010b; Lim et al., 2016; Zhang et al., 2012). In studying the degree of these changes over plant phaeno- logical phases, a slight increase was observed in ρb at W12 (harvesting) compared to W10 data in the case of higher biochar amended treatments (BC2.5 and BC5.0). Rainfall and irrigation may influence soil properties, such as ASD, the water infiltration rate or ρb. A longer period of rainfall may cause a bulk density increase in the top portion of a soil layer (Fohrer et al., 1999), which may help to explain the ρb values for the control treatment in the present experi- ment, because after the initial tilling, soil compactions take place. Concurrent with changes in ρb we observed a slight reduction in Ksat values, after initial increases. The higher Ksat values in the case of silt loam soil may be beneficial, as soil sealing is less likely to develop, hence soil water man- agement may be improved. Similar results were observed by Barnes et al. (2014), where the authors noted a strong correlation between changes in ρb and Ksat values. The find- ings from the present study were also comparable with a stu- dy done by Jien and Wang (2013). Although increases in Ksat values were observed compared to W0 data, these changes were more likely to be related to initial soil prepa- ration (additional soil tilling prior to planting), plant root growth at later times, and only marginally influenced by biochar addition as indicated by the noted extensive Ksat
increase in the case of the control treatments as well.
Therefore, biochar alone may not cause Ksat changes in soils directly, instead these changes may be caused by the indirect effects of biochar related enhancement in root development, or other factors such as rainfall and irrigation may cause changes in the ASD values and consequently in the UASD values. These environmental factors and changes in UASD may significantly influence soil ρb and the water movement through soil columns. All of these changes in the Ksat and ρb values cannot be explained by biochar addi- tion only; there is also a quantifiable connection between UASD, ρb and Ksat. Therefore it was established that ASD val- ues have substantial effects on ρb and Ksat, while changes in ASD are influenced by irrigation, precipitation, and plant growth. Consequently, a combination of biochar addition and changes in ASD have an impact on ρb and Ksat in soils.
CONCLUSIONS
1. The present study emphasizes the close con- nection between soil structure changes and plant develop- ment phases, it highlights the importance of soil and site specific analyses prior to amendment with biochar.
2. Biochar may positively influence aggregate forma- tion and hydraulic conductivity, it may also reduce the bulk density of the studied silt loam soil over the course of Capsicum annuum L. growth and fruiting cycle.
3. There were distinct relationships between the physi- cal and structural properties of the investigated soil, thus emphasizing soil biotic health.
4. Good correlations were found between the investi- gated soil structural parameters and changes in them due to biochar addition, including changes during different plant phaenological stages. While these results are confirmed for one type of biochar and soil type during a given plant growing phase, further investigation is required to draw larger-scale conclusions.
Conflict of interest: The Authors do not declare con- flict of interest.
REFERENCES
An C. and Huang G., 2015. Environmental concern on biochar:
capture, then what? Environmental Earth Sciences, 74(12), 7861-7863. https://doi.org/10.1007/s12665-015-4741-8 Anderson C.R., Condron L.M., Clough T.J., Fiers M., Stewart
A., Hill R.A., and Sherlock R.R., 2011. Biochar induced soil microbial community change: Implications for biogeo- chemical cycling of carbon, nitrogen and phosphorus.
Pedobiologia, 54(5-6), 309-320.
https://doi.org/10.1016/j.pedobi.2011.07.005
Angers D.A. and Caron J., 1998. Plant-induced changes in soil structure: processes and feedbacks. Biogeochem., 42(1), 55-72. https://doi.org/10.1007/978-94-017-2691-7_3 Barnes R.T., Gallagher M.E., Masiello C.A., Liu Z., and
Dugan B., 2014. Biochar-induced changes in soil hydraulic conductivity and dissolved nutrient fluxes constrained by laboratory experiments. PLoS One, 9(9), e108340.
https://doi.org/10.1371/journal.pone.0108340
Dugan E., Verhoef A., Robinson S., Sohi S., Gilkes R., and Prakpongkep N., 2010. Bio-char from sawdust, maize stover and charcoal: impact on water holding capacities (WHC) of three soils from Ghana. IUSS, August 1-6, Brisbane, Australia.
Fohrer N., Berkenhagen J., Hecker J.M., and Rudolph A., 1999. Changing soil and surface conditions during rainfall:
Single rainstorm/subsequent rainstorms. Catena, 37(3-4), 355-375. https://doi.org/10.1016/s0341-8162(99)00026-0 Gascó G., Cely P., Paz-Ferreiro J., Plaza C., and Méndez A.,
2016. Relation between biochar properties and effects on seed germination and plant development. Biological Agric.
Hortic., 32(4), 237-247.
https://doi.org/10.1080/01448765.2016.1166348
Ghezzehei T.A., 2012. Soil structure. In: Handbook of soil sci- ences: properties and processes (Eds P.M. Huang, Y. Li, M.E. Sumner). CRC, Boca Raton, FL, USA.
Hartley W., Riby P., and Waterson J., 2016. Effects of three different biochars on aggregate stability, organic carbon mobility and micronutrient bioavailability. J. Environ.
Manag., 181, 770-778.
https://doi.org/10.1016/j.jenvman.2016.07.023
Helliwell R., 2015. Effect of biochar on plant growth.
Arboricultural J., 37(4), 238-242.
Horel Á., Gelybó G., Potyó I., Pokovai K. and Bakacsi Z., 2019a.
Soil nutrient dynamics and nitrogen fixation rate changes over plant growth in temperate soil. Agronomy, 9(4), 179.
https://doi.org/10.3390/agronomy9040179
Horel Á., Barna Gy., and Makó A., 2019b. Soil structural and physical properties affected by biochar addition at different plant phaenological phases I. Int. Agrophys., 33(2), 255- 262. https://doi.org/10.31545/intagr/109535
Horel Á., Potyó I., Szili-Kovács T., and Molnár S., 2018.
Potential nitrogen fixation changes under different land uses as influenced by seasons and biochar amendments.
Arabian J. Geosciences, 11, 559.
https://doi.org/10.1007/s12517-018-3916-5
Jeffery S., Abalos D., Spokas K.A. and Verheijen F.G.A., 2015.
Biochar effects on crop yield. In: Biochar for environmen- tal management: science and technology (Eds J. Lehmann, S. Joseph). Earthscan, London, UK.
Jien S.-H. and Wang C.-S., 2013. Effects of biochar on soil prop- erties and erosion potential in a highly weathered soil.
Catena, 110, 225-233.
https://doi.org/10.1016/j.catena.2013.06.021
Karhu K., Mattila T., Bergström I., and Regina K., 2011.
Biochar addition to agricultural soil increased CH4 uptake and water holding capacity – Results from a short-term pilot field study. Agric. Ecosys. Environ., 140(1-2), 309-313.
https://doi.org/10.1016/j.agee.2010.12.005
Kelly C.N., Benjamin J., Calderón F.C., Mikha M.M., Rutherford D.W., and Rostad C.E., 2017. The incorpora- tion of biochar carbon into stable soil aggregates: the role of clay mineralogy and other soil characteristics. Pedosphere, 27, 694-704. https://doi.org/10.1016/s1002-0160(17)60399-0 Kemper W.D. and Rosenau R.C., 1986. Aggregate stability and
size distribution. In: Methods of soil analysis, Part 1. (Ed.
A. Klute). American Society of Agriculture, Soil Sci. Soc.
America, Madison, WI, USA, 425-442.
https://doi.org/10.2136/sssabookser5.1.2ed.c17
Kézdi Á., 1974. Handbook of soil mechanics: soil physics.
Elsevier Scientific Publ. Company, Budapest, Hungary.
Klute A. and Dirksen C., 1986. Hydraulic conductivity and dif- fusivity: Laboratory methods. In: Methods of soil analysis.
Part 1. Physical and mineralogical methods (Ed. A. Klute).
American Society of Agriculture, oil Sci. Soc. America, Madison, WI, USA, 687-734.
https://doi.org/10.2136/sssabookser5.1.2ed.c28
Laird D., Fleming P., Wang B., Horton R. and Karlen D., 2010a.
Biochar impact on nutrient leaching from a Midwestern agricultural soil. Geoderma, 158(3-4), 436-442.
https://doi.org/10.1016/j.geoderma.2010.05.012
Laird D.A., Fleming P., Davis D.D., Horton R., Wang B., and Karlen D.L., 2010b. Impact of biochar amendments on the quality of a typical Midwestern agricultural soil. Geoderma, 158(3-4), 443-449.
https://doi.org/10.1016/j.geoderma.2010.05.013
Liang B., Lehmann J., Solomon D., Kinyangi J., Grossman J., O’Neill B., Skjemstad J.O., Thies J., Luizão F.J., Petersen J., and Neves E.G., 2006. Black carbon increases cation exchange capacity in soils. Soil Sci. Soc. America J., 70(5), 1719-1730. https://doi.org/10.2136/sssaj2005.0383 Lim T.J., Spokas K.A., Feyereisen G., and Novak J.M., 2016.
Predicting the impact of biochar additions on soil hydraulic properties. Chemosphere, 142, 136-144.
https://doi.org/10.1016/j.chemosphere.2015.06.069 Liu Z., Chen X., Jing Y., Li Q., Zhang J., and Huang Q., 2014.
Effects of biochar amendment on rapeseed and sweet potato yields and water stable aggregate in upland red soil. Catena, 123, 45-51. https://doi.org/10.1016/j.catena.2014.07.005 Natural Resources Conservation Services N.R.C.S., 1994.
Gradation design of sand and gravel filters, Part 633 nation- al engineering handbook. U.S. Department of Agriculture, Washington, DC, USA.
Nielsen D.R., Biggar I.W., and Erh K.T., 1973. Spatial variability of field-measured soil-water properties. Hilgardia, 42(7), 215-260. https://doi.org/10.3733/hilg.v42n07p215
Novak J.M., Lima I., Xing B., Gaskin J.W., Steiner C., Das K.C., Ahmedna M., Rehrah D., Watts D.W., Busscher W.J., and Schomberg H., 2009. Characterization of designer biochar produced at different temperatures and their effects on a loamy sand. Annals of Environ. Sci., 3, 195-206. https://doi.org/10.2134/jeq2011.0133
Ouyang L., Wang F., Tang J., Yu L., and Zhang R., 2013.
Effects of biochar amendment on soil aggregates and hydraulic properties. J. Soil Sci. Plant Nutrition, 13(4), 991- 1002. https://doi.org/10.4067/s0718-95162013005000078 Sun F. and Lu S., 2014. Biochars improve aggregate stability,
water retention, and pore-space properties of clayey soil. J.
Plant Nutr. Soil Sci., 177(1), 26-33.
https://doi.org/10.1002/jpln.201200639
Surda P., Lichner L., Nagy V., Kollar J., Iovino M. and Horel A., 2015. Effects of vegetation at different succession stag- es on soil properties and water flow in sandy soil. Biologia, 70(11), 1474-1479. https://doi.org/10.1515/biolog-2015-0172 Vergani C. and Graf F., 2016. Soil permeability, aggregate sta- bility and root growth: a pot experiment from a soil bio- engineering perspective. Ecohydrology, 9(5), 830-842.
https://doi.org/10.1002/eco.1686
Warnock D.D., Mummey D.L., McBride B., Major J., Lehmann J., and Rillig M.C., 2010. Influences of non-herbaceous biochar on arbuscular mycorrhizal fungal abundances in roots and soils: Results from growth-chamber and field experiments. Appl. Soil Ecol., 46(3), 450-456.
https://doi.org/10.1016/j.apsoil.2010.09.002
Zhang A., Bian R., Pan G., Cui L., Hussain Q., Li L., Zheng J., Zheng J., Zhang X., Han X., and Yu X., 2012. Effects of biochar amendment on soil quality, crop yield and green- house gas emission in a Chinese rice paddy: A field study of 2 consecutive rice growing cycles. Field Crops Res., 127, 153-160. https://doi.org/10.1016/j.fcr.2011.11.020