Postal address: NÓRA PÉTERFALVI, Department of Crop Production Technology, NARIC Institute of Agricultural Engineering, Gödöllő, Tessedik S. u. 4. 2100.
E-mail: peterfalvi.nora@mgi.naik.hu
PM
10emission from crop production and agricultural soils
NÓRA PÉTERFALVI,BOGLÁRKA KELLER,MARIANNA MAGYAR Department of Crop Production Technology, NARIC Institute of Agricultural
Engineering, Gödöllő, Hungary Abstract
The emission of particulate matter from agricultural sources is a worldwide environmental issue due to health concerns.
The main factors influencing PM10 emission from crop production are the origin of particles, the physical and chemical properties of soils, meteorological conditions, and the mechanical impacts of farm operations. Several studies have been made to determine PM10 emission factors for tillage operations, but these emission factors varied depending on soil properties, especially soil texture and water content, and environmental conditions (e.g. relative humidity, and variability in wind speed and direction). This is why the use of a single emission factor for a given tillage operation is inadequate.
To estimate the yearly amount of PM10 emitted from agricultural soils and crop production, emissions originating from different sources at different temporal division must be summarized. Because 56 % of the total territory of Hungary is cropland, relatively high PM10 emission occurs from crop production and agricultural soils. If this is to be reduced, research should focus on the identification of soil and environmental properties related to PM10 emission on characteristic Hungarian soils.
Keywords: PM10 emission estimation, agriculture, crop production, soil, emission factor
Introduction
Particulate matter (PM) is an air pollutant that can be characterized by its size, consistence, matter and source (primary or secondary generated). These pollutants consist of solid and liquid particles, suspended in the air, including mineral or artificial (anthropogenic) matter (e.g. sulphates, nitrates, ammonium, inorganic ions, organic and elemental carbon, heavy metals, radioactive particles, pesticides, etc.) and also biological components (microbial compounds, allergens) (VAN DER
ZEE et al., 1998; WHO, 2013). Agricultural activities are important sources of atmospheric particulate matter emission.
The particulate matter (particles with an aerodynamic diameter equal to or less than 10 micrometres (µm), PM10) suspended in the air can have negative effects on
human health, and potential effects on the climate, so they are considered as high- risk airborne pollutants (PEARCE et al.,1996). PM10 is a mixture of fine particulate matter (particles with a diameter of less than 2.5 µm, PM2.5) and coarse particulate matter (particles measuring between 2.5 and 10 µm). In most locations around Europe, PM2.5 constitutes 50–70% of PM10 (WHO,2013). In 2014 the European Environment Agency estimated that almost 12,000 premature deaths were attributable to fine particulate matter in Hungary (EEA,2017).
In order to reduce air pollution, including particulate matter emission, a new National Emissions Ceilings (NEC) Directive (2016/2284/EC) came into force in the European Union on 31 December 2016. Replacing earlier legislation (Directive 2001/81/EC), the new NEC Directive sets 2020 and 2030 emission reduction commitments for five main air pollutants (sulphur dioxide, nitrogen oxides, non- methane volatile organic compounds, ammonia and particulate matter). It also ensures that the emission ceilings for 2010, set in the earlier directive, remain applicable for Member States until the end of 2019 (DIRECTIVE,2016/2284/EC).
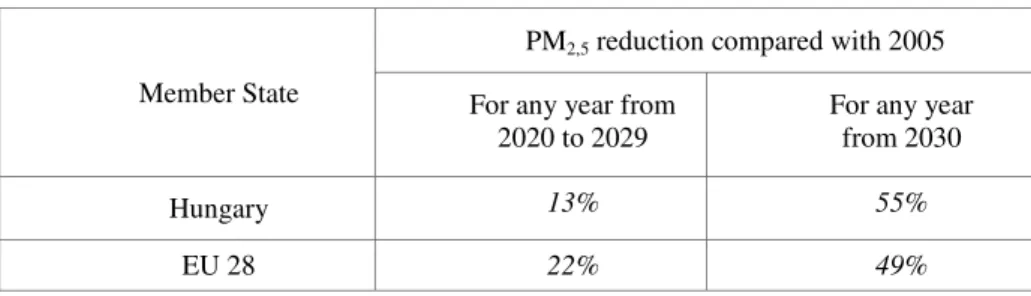
Table 1 shows the emission reduction commitments for fine particulate matter (PM2.5). The reduction commitments considered 2005 as the baseline year and, for road transportation, apply to emissions calculated on the basis of fuels sold.
Table 1
PM2.5 emission reduction commitments (NECDIRECTIVE)
Member State
PM2,5 reduction compared with 2005 For any year from
2020 to 2029
For any year from 2030
Hungary 13% 55%
EU 28 22% 49%
In the case of PM10 in the ambient air, the daily threshold limit should not be exceeded more than 35 times per year, and the annual pollution threshold limit should not be exceeded (DIRECTIVE 2008/50/EC). Breaches in air quality requirements for PM10, which have severe negative effects on health and the environment, are followed up by the European Commission through infringement procedures covering all the Member States concerned, including Hungary. The aim is to put adequate measures in place in order to bring all zones into compliance.
Therefore Government Decree No 1330 on the Cross-Sectoral Action Programme for the Reduction of PM10 was adopted in Hungary on 12 October 2011 and is now being implemented (http://pm10.kormany.hu/).
The main sources of PM10 emission are residential (heating), industrial, traffic and agricultural. PM10 emission can be detected from agricultural activities like manure management and crop production and also from agricultural soils in
general. To solve the problem, specific action is required to reduce PM10 emission related to agriculture (EU2017).
Under the terms of the UNECE Convention on Long-range Transboundary Air Pollution, countries have to report emission inventories yearly, based on guidelines in the EMEP/EEA air pollutant emission inventory guidebook (2016). Data in the Informative Inventory Report 2015 - Hungary (2017) show that the agricultural sector was a significant contributor to PM10 emissions in 2015; manure management had a 4.6% share in total Hungarian emissions, and crop production and agricultural soils a 9.2 % share. The relatively high emission level from these sources is reasonable, since 56% of the total area of the country is cropland. Trends show a decrease in emission categories related to manure management, crop production and agricultural soil from 2005 to 2015, but if the 2000–2015 interval is examined it can be seen that PM10 emission from crop production and agricultural soils increased by more than 10% (Table 2).
Table 2
Emission trends for agricultural PM10 2000–2015 Source:INFORMATIVE INVENTORY REPORT 2015-HUNGARY (2017)
Year
Manure
management Crop production and
agricultural soils Agriculture total Gg
2000 3.8 5.8 9.6
2001 3.8 6.6 10.4
2002 4.1 6.6 10.7
2003 4.3 6.6 10.9
2004 3.9 6.7 10.6
2005 3.5 6.7 10.1
2006 3.4 6.6 10.0
2007 3.3 6.7 10.0
2008 3.3 6.6 10.0
2009 3.2 6.6 9.9
2010 3.4 6.6 10.0
2011 3.4 6.5 9.9
2012 3.2 6.6 9.7
2013 3.2 6.6 9.8
2014 3.2 6.6 9.8
2015 3.2 6.5 9.7
Share in Hungarian total in 2015 4.6% 9.2% 13.8%
Trend 2000–2015 -15.9% 12.3% 1.1%
Trend 2005–2015 -6.9% -2.6% -4.1%
Main factors influencing PM10 emission in crop production
Wind erosion is the main cause of natural soil erosion, and several studies are underway in European countries, some of which are focused on wind erosion in agricultural areas (PÁSZTOR et al., 2016).
The transport of soil particles by the wind can occur in several ways, depending on particle size and wind speed. These can be divided into four (not discrete) modes: long-term suspension (< ~20 µm diameter), short-term suspension (~20–70 µm), saltation (~70–500 µm) and reptation and creep (> ~500 µm), but these transport modes may switch from one to the other as the wind speed and particle size distribution change (KOK et al.,2012).
Anthropogenic impacts on the soil surface may comprise direct emissions due to mechanical impact or wind erosion on disturbed soils (ZENDER et al.,2004). At the same time there are many factors that may influence emission rates negatively or positively. The main factors will be summarized below.
Origin of the particles
The emission of particles from topsoils is an important but hardly visible process. The particles may remain suspended in the air for a long time and can be transported long distances. The effect of tillage on fine particle emission has been studied in less detail than that of wind erosion (GOOSSENS et al., 2001). PM10
particles may originate from various sources during tillage (e.g. soil, plant, tractor engine, etc.). The size and material of the particles is highly dependent on their origin.
The cultivation process can be divided into several parts, namely the tilling season, growing season and harvesting season, all of which have a characteristic PM10 composition. CHEN et al. (2015) examined the temporal variability of atmospheric particulate matter and its chemical composition at an agricultural site during the growing season. Observations on PM10 and PM2.5 concentrations were made from April to October 2012 in Dehui City, China.
Mineral dust elements (Al, Ca, Fe and Mg) dominated the PM10 chemical composition during the tilling season, OC (organic carbon), NO3-, SO42- and NH4+
during the growing season, and carbonaceous species (i.e. organic and elemental carbon) during the harvesting season. The results indicated that the soil particles emitted by farm tillage and the organic matter released from straw burning were the two most significant sources of PM10 emissions (CHEN et al.,2015).
Pesticides can also be identified in PM10 emissions. COSCOLLA et al.(2014) reported that a total of 16 pesticides were detected, including six fungicides, seven insecticides and three herbicides. The total concentrations in the particulate phase ranged from 3.5 to 383.1 pg m-3. Most of these particles belonged to the ultra-fine (<1 µm) and coarse (2.5–10 µm) particle size fractions (COSCOLLA et al.,2014).
In some cases burning is part of the harvesting process. LE BLOND et al.(2016) examined emissions originating from sugarcane burning and found the concentrations of airborne PM10 to be statistically much higher during pre-harvest
sugarcane burning (1807 µg m-3) than during either sugarcane cutting after burning (~123 µg m-3) or in the sugarcane processing factory (~175 µg m-3).
Soil properties
The PM10 emission originating from agricultural areas (CLAUSNITZER AND
SINGER,1996;FUNK et al.,2008) is obviously determined partly by the textural and aggregational characteristics of a given soil. Several studies have reported the environmental outcomes for various soil texture categories. The PM10 emissions increased from coarse-textured soil through medium-textured soil to fine-textured soil, and also increased with the number of tillage operations (LOVARELLI et al., 2017). AVECILLA et al.(2016) studied the saltation efficiency for PM10 emission in a wind tunnel study and found that the soil texture is a decisive factor during this process. The saltation efficiency increased in the case of fine texture (clay, silt) and decreased in the case of coarse texture (sand). Similar observations were made by other authors (ZOBECK et al.,1999;HAGEN et al.,2010;CARVACHO et al.,2004;
FUNK et al.,2008;ALFARO,2008). MENDEZ et al.(2013) found that the relationship between soil texture and PM10 concentrations followed the sequence loamy-sand <
sandy loam < silt loam < clay loam.
The emission process is mainly affected by soil aggregation and aggregate stability (SWET AND KATRA, 2006) and by other aggregation parameters such as clay and organic matter content. AIMAR et al.(2012) observed the positive effect of organic matter on PM10 emissions, since it has a positive effect on the cohesion of fine-sized particles (less than 10 µm).
The soil texture determines the water-binding characteristics, which greatly influence the soil moisture content (CORNELIS AND GABRIELS,2003;DARKE AND NEUMAN,2008;CHEPIL,1956;WEINAN et al.,1996).This in turn is closely related to the silt and organic matter content (AIMAR et al., 2012), thus affecting PM10
emission. ITURRI et al. (2017) measured the particulate matter at different heights and observed that SOC contents increased with height. They found selectivity in the transport capacity of different types of organic matter, since aromatic organic matter occurred close to the ground, while other forms of organic matter (plant debris, polysaccharides) dominated at greater heights. Higher SOC content was detected in coarser than in fine-textured soils. Because of the selectivity process, the more stable organic matter is transported at lower levels. In Hungary wind selectivity and organic matter translocation were reported by FARSANG et al. (2013), who also found that a wind velocity of 15 m s-1 on the soil surface could change the aggregate size composition. NÉGYESI et al. (2015) determined the following threshold wind velocities for soils with sandy loam texture: 7.4–9.8 m s–1, loam texture: 9.3–11.6 m s-1, and silt loam texture: 10.0–11.6 m s–1.
PEASE et al.(2002) found that loamy sand soils emitted proportionally more PM10 fractions than sandy loam, while RONEY AND WHITE (2006) found the contrary, with sandy loam soil having higher emissions. MADDEN et al.(2010) and FUNK et al. (2008) found that the maximum PM10 emissions measured at low moisture content depended on the silt to clay ratio. On loessy sandy loam soils, a
4% soil moisture level was found to be the most critical (CHEN et al., 1996), while other authors found that a 4–5% moisture level was critical for sandy and fine sand soils (BOLTE et al., 2011; SELAH AND FRYREAR, 1995). In contrast, FUNK et al.
(2008) gave the following soil moisture thresholds for fine dust emissions: sand (2–
5%), silt (5–10%), clay (30%), and organic soils (25–45%). HOFFMANN AND FUNK
(2015) suggested that early morning tillage operations reduced fine dust emissions during dry seasons.
AVECILLA et al. (2017) observed that the state of the soil surface was also correlated with dust emission, crusted surfaces being more prone to PM10 emission.
In general crusted soils are less prone to wind erosion but KJELGAARD et al.(2004) also found that these surfaces are important under certain environmental conditions.
SHARATT AND VADDELLA (2014) studied the effect of crusted surfaces on the friction velocity threshold, which has a great impact on wind erosion and dust emission. They found that the clay content has great importance for the crusting process, which can cause an exponential increase in the friction velocity.
Atmospheric conditions
Several authors emphasize the importance of meteorological conditions for dust emissions. AVECILLA et al.(2017) found that PM10 concentrations were closely correlated with wind speed, relative humidity and air temperature. HUSSEIN AND
KARPPINEN (2006) also reported that the wind speed and air temperature were the most decisive variables. When the air humidity dropped below 20%, PM10
emissions increased drastically (AVECILLA et al.,2017;CSAVINA et al.,2014), but decreased to zero at above 75% air humidity (STOVEN et al.,2015). Regarding the wind speed, AVECILLA et al. (2017) found that the minimum wind speed that resulted in wind erosion on bare soil was 8 m s-1, while this figure was reported by DE ORO AND BUSCHIAZZO (2009) to be 6–8 m s-1. The other most important variable is the temperature, with emission increasing significantly above 25 °C.
Impact of human activity
Farming operations like tillage, harvesting procedures and residue management have a great influence on the physical and chemical properties of soils.
Aggregate size distribution, aggregate particle composition, OM contents and plant coverage are all related to PM10 emission from soils (AIMAR et al.,2012;GAO et al., 2014). GOOSSENS et al. (2001) emphasised the relevance of tillage operations in dust generation, finding that the dust production from tillage was six times higher than wind erosion in their northwest German study area in 1999. The reason for the difference was the long period of tillage.
Two main periods can be distinguished for farming operations over a one-year period: spring and late summer operations, when the soil moisture conditions are different. Generally soil moisture is higher in spring than in late summer, at the end of the vegetation period, when the field capacity decreases greatly due to high evaporation and to the water uptake of crops, leading to higher dust emission.
During agricultural operations (mainly tillage and harvest) the particles most typically generated are between 2.5 and 10 µm in diameter (CAPAREDA et al.,2004;
MATSUMURA et al.,2003;KASUMBA et al.,2011). Emission is also affected by the speed and type of operation and the surface characteristics (e.g. roughness).
SHARRATT et al.(2010) found that PM10 concentrations decreased with a decrease in the number or intensity of tillage operations in a winter wheat–summer fallow system.
Many studies have examined the effect of conservation tillage methods on PM10 emission compared with the conventional form, several of which found that a decrease in the number of tillage operations resulted in reduced emissions as well.
MENDEZ et al.(2015) studied the PM10 emissions associated with different tillage methods and proved that conservation tillage systems produce three times higher concentrations than non-tillage systems. MADDEN et al. (2008) and GAO et al.
(2014) found similar results for the effect of conservation and non-till methods based on portable wind tunnel simulations. The non-tillage method is also better with respect to dust emissions than the conventional form. SHARATT AND FENG
(2009) compared the effects of conventional and undercutter tillage on PM10 and reported that the undercutter reduced soil loss compared to conventional tillage.
SHARATT et al. (2012) studied conventional, reduced, minimum and non-tillage operations during the fallow period, and measured the residue biomass, surface roughness, soil crust, soil aggregation, strength and soil water content. In this study minimum tillage resulted in greater crust, 15% residue cover, greater ridge roughness, higher mean aggregate diameter and penetration resistance with 50%
less soil loss compared with conventional tillage. SINGH et al. (2012) compared traditional and non-tillage fallow, where traditional tillage with a tandem disk resulted in higher PM10 loss. Basically, conservation tillage promotes the accumulation of organic matter in the soil and improves aggregate stability and soil water conservation, therefore reducing PM10 emission (GAO et al.,2014;SHARRATT et al.,2010;SINGH et al.,2012).
FAULKNER et al. (2012) studied the impact of almond harvesting on PM10
emissions in California, comparing two sweeping technologies, one with the sweeper setting recommended by the manufacturer and one with a 1.27 cm lower sweeper setting. The PM10 emissions during the pickup of windrows formed using lower sweeper settings were approximately 2.5 times higher than the pickup of those formed using the manufacturer’s recommendations (FAULKNER et al.,2012).
Emission factors for soil cultivation and crop harvesting
The main sources of PM emissions from the soil are tillage and crop harvesting, which together account for more than 80% of the total PM10 emissions from tillage land (CEIP, 2015). These emissions originate from sites where tractors and other machinery operate, and are thought to consist of a mixture of organic fragments from the crop, soil minerals and soil organic matter. A considerable amount of dust settles close to the sources and fine particles are washed out by large particles. Field operations may also lead to the re-suspension of dust that has
already settled (re-entrainment). Emissions of PM are dependent on climatic conditions, and in particular the moisture of the soil and crop surfaces (EMEP/EEA GUIDEBOOK,2016).
COWHERD et al. (1974) were the first to calculate the atmospheric dust emission factors of tillage operations, and reported that surface soil texture, surface soil moisture content and implement speed had a significant impact on emission.
They elaborated corrected emission factors for three particle size ranges: less than 2 µm, 2–30 µm, and more than 30 µm, based on the % silt content of the surface soil, the soil water status (Thornthwaite’s precipitation-evaporation index) and implement speed.
VAN DER HOEK et al. (2007) laid the foundations for guidelines in the UNECE emission inventory in connection with PM. They divided methods for determining emission factors into three types:
• Direct measurements of primary emissions from cultivation machinery, and the calculation of field-related emission factors.
• Indirect estimations, which measure concentrations with equipment placed in the driver’s cab, and the layer- or plume-based modelling of treated areas.
• Measurement of PM concentrations at the borders of the field, and the use of inverse dispersion modelling.
Several studies have been performed on the PM10 emissions of agricultural activity. The most extensive study started in 1994 in California’s San Joaquin Valley (HOLMÉN et al., 2001a,b; FLOCCHINI et al., 2001; CASSEL et al., 2003;
MADDEN et al.,2008).In EuropeGOOSSENS et al.(2001),FUNK and REUTER (2004), HINZ (2004),BOGMAN et al.(2005),OETTL et al.(2005) and HINZ andTAMOSCHAT- DEPOLT (2007) carried out studies with great impact, but there is still no standard procedure for measuring and calculating fine dust emission from arable production.
In some previous studies only the PM10 emission rate or emission factor was calculated. FLOCCHINI et al.(2001) drew the conclusion that the direct comparison of average emissions from a given implement is not reliable because of differences in environmental conditions (e.g. relative humidity, wind direction variability).
Individual tests that measure emissions are more reliable than calculations based on implement type.
ÖTTL AND FUNK (2007) also showed that very different emissions may be recorded for the same soil and operation type, depending on environmental conditions. FUNK et al. (2008) demonstrated the importance of the vertical soil moisture profile for the PM emissions from tillage operations.
HOLMEN et al.(2001b), BAKER et al.(2005)andMADDEN et al.(2008) reported an inverse relationship between the gravimetric water content of the soil and PM10
emission.
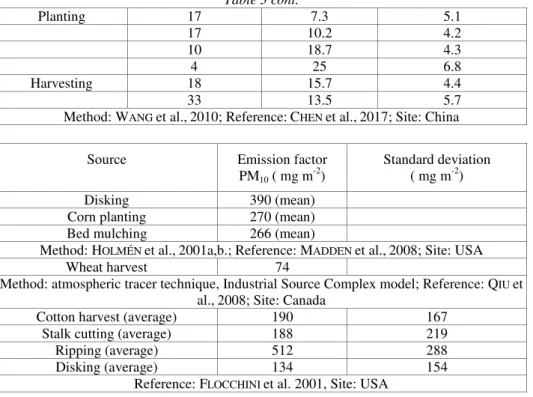
Great variability can be found if the PM10 emission factors given for agricultural activities in the literature are compared (Table 3). In some cases tillage operations are comparable. MADDEN et al.(2008) found that disking leads to higher PM10 emission, while conservation tillage reduced PM10 emission. CHEN et al.
(2017) found that tilling resulted in the highest PM10 emission, followed by harvesting and planting.
Table 3
Emission factors reported in the literature Source Emission
factor PM10
(mg m-2)
Standard deviation (mg m-2)
Number
of tests Relative
humidity (%) Soil moisture
(%) Disking
cotton 78 42 14 59 13
garbonzos 313 402 2 51 6
melon 380 278 5 55 11
tomatoes 545 284 10 40 4
wheat 1375 881 13 43 3
Floating
melon 119 0 1 53 11
tomatoes 2322 0 1 40 2
wheat 1569 1277 15 40 3
Land planning
garbonzos 1704 1042 7 34 2
tomatoes 1226 1318 7 42 3
Method: HOLMÉN et al.,2001A; Reference: CASSEL et al.,2003; Site: USA Source Emission factor PM10
( mg m-2) Relative
humidity (%) Wind speed
(m s-1) Temperature (°C)
Ploughing and packing 120 40 2.7 24
Harrowing 82 34 1.9 27
Disking 137 45 3.1 13
Cultivating 186 29 1.1 27
Method: Graz Lagrangian Model; Reference: OETTL et al.,2005; Site: Germany Source Emission factor
PM10 ( mg m-2) Soil moisture (%) Wind speed (m s-1)
Near-source disking 78–239 1.16–2.44 2.04–5.48
Far-source disking 8–89 1.76–2.34 1.81–4.53
Reference: KASUMBA et al.,2011., Site: USA
Tilling 119 7.3 6.7
96 10.2 5.5
31 18.7 5.4
9 25 6.2
Table 3 cont.
Planting 17 7.3 5.1
17 10.2 4.2
10 18.7 4.3
4 25 6.8
Harvesting 18 15.7 4.4
33 13.5 5.7
Method: WANG et al.,2010; Reference:CHEN et al.,2017; Site: China
Source Emission factor
PM10 ( mg m-2) Standard deviation ( mg m-2)
Disking 390 (mean)
Corn planting 270 (mean)
Bed mulching 266 (mean)
Method: HOLMÉN et al.,2001a,b.; Reference: MADDEN et al.,2008; Site: USA
Wheat harvest 74
Method: atmospheric tracer technique, Industrial Source Complex model; Reference: QIU et al.,2008; Site: Canada
Cotton harvest (average) 190 167
Stalk cutting (average) 188 219
Ripping (average) 512 288
Disking (average) 134 154
Reference: FLOCCHINI et al. 2001, Site: USA
It is clear that considering a single emission factor for a given tillage operation is inadequate. The emission factors should take into consideration variations in soil properties, especially soil texture and water content (MADDEN et al.,2010), and also the environmental conditions (e.g. relative humidity, variability in wind speed and direction) (FLOCCHINI et al.,2001).
To estimate the yearly amount of PM10 emitted from agricultural soils and crop production, emissions from different sources at different times must be summarized: soil cultivation, sowing, harvesting, post-harvest treatments and soil cultivation from spring to autumn.
Figure 1
Sources of particulate matter in arable production (VAN DER HOEK et al., 2007)
The mass flow of emitted particles is governed by many parameters (see above: Main factors influencing PM10 emission in crop production).
PM10 emissions from arable production are related to the cultivated area of each crop (VAN DER HOEK et al., 2007):
where
EPM10 PM10 emission (in kg year-1) EFPM10 PM10 emission factor (in kg ha-1) A annual treated area (in ha) n annual repetitions of treatment.
Based on the work of VAN DER HOEK AND HINZ (2007), the Tier 1 approach for PM10 emission from crop production and agricultural soils uses the general equation in the EMEP/EEAGUIDEBOOK (2016), representing a simplification and aggregation of the detailed data to give a single value for PM emissions per hectare:
where
EPM10 amount of pollutant emitted (in kg year-1) ARarea area covered by the crop (in ha)
EFPM10 PM10 emission factor (in kg ha-1 year-1).
The value of ARarea is equal to the agricultural area utilised, which includes all cropland, permanent pasture and grazing land.
Based on the Tier 2 approach, the PM10 emission is calculated by multiplying the cultivated area of each crop by an EF and by the number of times the operation causing emission is carried out (EMEP/EEA GUIDEBOOK, 2016). This requires country-specific information on the number of times that each operation is performed for each crop type during the course of a year. Care should also be taken to account for crop areas that provide more than one harvest per year. Moreover, different EFs are valid for dry climate conditions (Mediterranean climate) and wet climate conditions (all other climates).
Countries use Tier 2 or Tier 1 methodology depending on the presence or absence of data. In the Inventory, however, the emission factors are fixed and do not change in connection with the soil properties.
References
AIMAR,S.B.,MENDEZ,M.J.,FUNK,R.,BUSCHIAZZO,D.E., 2012. Soil properties related to potential particulate matter emissions (PM10) of sandy soils. Aeolian Res. 3. 437–443.
ALFARO,S.C., 2008. Influence of soil texture on the binding energies of fine mineral dust particles potentially released by wind erosion. Geomorphology 93. 157– 167.
AVECILLA F.,PANEBIANCO J.E.,BUSCHIAZZO D.E., 2016. A wind-tunnel study on saltation and PM10 emission from agricultural soils. Aeolian Research. 22. 73–
83.
AVECILLA F.,PANEBIANCO J.E.,BUSCHIAZZO D.E.,2017. Meteorological conditions during dust (PM10) emission from a tilled loam soil: Identifying variables and thresholds. Agricultural and Forest Meteorology. 244–245. 21- 32.
BAKER,J.B.,SOUTHARD,R.J.,MITCHELL,J.P.,2005. Agricultural dust production in standard and conservation tillage systems in the San Joaquin Valley. Journal of Environmental Quality. 34. 1260–1269.
BOGMAN,P.,CORNELIS,W.,ROLLE,H.,GABRIELS,D.,2005. Prediction of TSP and PM10 emissions from agricultural operations in Flanders, Belgium. In: 14th International Conference “Transport and Air Pollution”, Graz, Austria, June 1- 3, 2005.
BOLTE,K.,HARTMANN,P.,FLEIGE,H.,HORN,R.,2011. Determination of critical soil water content and matric potential for wind erosion. J. Soils Sediments.
11. 209–220
CAPAREDA,S.C.,WANG,L.,PARNELL JR.,C.B., andSHAW,B.W.,2004. Particle size distribution of particulate matter emitted by agricultural operations:
Impacts on FRM PM10 and PM2.5 Concentration Measurements. In: Proc. of the 2004 Beltwide Cotton Production Conferences, National Cotton Council, Memphis, Tenn.
CARVACHO,O.F.,ASHBAUGH,L.L.,BROWN,M.S.,FLOCCHINI,R.G., 2004.
Measurement of PM2.5 emission potential from soil using the UC Davis resuspension test chamber. Geomorphology. 59. 75–80.
CASSEL T,TRZEPLA-NABAGLO K,FLOCCHINI R.2003. PM10 emission factors for harvest and tillage of row crops. International Emission Inventory Conference
‘Emission Inventories – Applying New Technologies’, San Diego, 29 April to 1 May. https://www3.epa.gov/ttn/chief/conference/ei12/poster/cassel.pdf CEIP, 2015, ‘Officially reported emission data’, the Convention on Long-range
Transboundary Air Pollution Centre on Emission Inventories and Projections (http://www.ceip.at/ms/ceip_home1/ceip_home/webdab_emepdatabase/reporte d_emissiondata/), last accessed September 2016.
CLAUSNITZER,H.,SINGER,M.J.,1996. Respirable-dust production from agricultural operations in the Sacramento Valley, California. J. Environ. Qual. 25. 877–
884.
CHEN,W.N.,DONG,Z.B.,LI,Z.S.,YANG,Z.T.,1996. Wind tunnel test of the influence of moisture on the erodibility of loessial sandy loam soils by wind. J.
Arid Environ. 34. 391–402.
CHEN,W.,TONG,D.,ZHANG,S.,DAN,M.,ZHANG,X.,ZHAO,H., 2015. Temporal variability of atmospheric particulate matter and chemical composition during a growing season at an agricultural site in northeastern China. Journal of Environmental Science. 38. 133-141.
CHEN W.,TONG,D.Q.,ZHANG S.,ZHANG,X,ZHAO,H.,2017. Local PM10 and PM2,5 emission inventories from agricultural tillage and harvest in northeastern China. Journal of Environmental Science. 57. 15-23.
CHEPIL W.S. 1956. Influence of moisture on erodibility of soil by wind. Soil Science Society of America Journal. 20. 288–292.
CORNELIS,W.M.,GABRIELS,D.,2003. The effect of surface moisture on the entrainment of dune sand by wind: an evaluation of selected models.
Sedimentology. 50. 771–790.
COSCOLLA,C.,MUNOZ,A.,BORRAS,E.,VERA,T.,RODENAS,M.,YUSA,V.,2014.
Particle size distributions of currently used pesticides in ambient air of an agricultural Mediterranean area. Atmospheric Environment. 95. 29-35.
COWHERD C.,AXETELL K.,GUENTHER,C.M.,JUTZE,G.A.1974. Development of Emission Factors for Fugitive Dust Sources, USEPA-450/3-74-037. United States Environmental Protection Agency (USEPA), Research Triangle Park, NC.
CSAVINA J.,FIELD J.P.,FELIX O.,CORRAL-AVITIA A.Y.,SAEZ A.E.,BETTERTON
E.A., 2014. Effect of wind speed and relative humidity on atmospheric dust concentrations in semi-arid climates. Sci. Total Environ. 487. 82-90
DARKE,I.,NEUMAN,C.M., 2008. Field study of beach water content as a guide to wind erosion potential. J. Coastal Res. 24. 1200–1208.
DE ORO L.,BUSCHIAZZO D.E., 2009. Threshold wind velocity as an index of soil susceptibility to wind erosion under variable climatic conditions. Land Degrad.
Develop. 20. 14-21.
DIRECTIVE 2008/50/EC OF THE EUROPEAN PARLIAMENT AND OF THE COUNCIL of 21 May 2008 on ambient air quality and cleaner air for Europe DIRECTIVE 2016/2284/EC OF THE EUROPEAN PARLIAMENT AND OF THE
COUNCIL of 14 December 2016 on the reduction of national emissions of certain atmospheric pollutants, amending Directive 2003/35/EC and repealing Directive 2001/81/EC
EEA, 2017. Air quality in Europe - 2017 report, EEA Report No 13/2017, European Environment Agency, 2017, https://www.eea.europa.eu/publications/air- quality-in-europe-2017
EMEP/EEA, 2016. EMEP/EEA air pollutant emission inventory guidebook 2016
— Technical guidance to prepare national emission inventories, EEA Technical Report No 21/2016, European Environment Agency
(http://www.eea.europa.eu/emep-eea-guidebook), accessed 30 September 2016.
EU, (2017) The EU Environmental Implementation Review Country Report – HUNGARY Brussels, 3.2.2017 SWD 46 final, COMMISSION STAFF WORKING DOCUMENT, EUROPEAN COMMISSION, 2017 http://ec.europa.eu/environment/eir/country-reports/index2_en.htm
FARSANG A.,DUTTMANN R.,BARTUS M.,SZATMÁRI J.,BARTA K.,BOZSÓ G.
(2013): Estimation of soil material transportation by wind based on in situ wind tunnel experiments. Journal of Environmental Geography 6. (3–4) 13–
20.
FAULKNER,W.B.,CAPAREDA,S.C., 2012. Effects of sweeping depth on particulate matter emissions from almond harvest operations. Atmospheric Pollution Research. 3. 219-225.
FLOCCHINI,R.G.,JAMES,T.A.,ASHBAUGH,L.L.,BROWN,M.S.,CARVACHO,O.F., HOLMÉN,B.A.,MATSUMURA,R.T.,TRZEPLANABAGLO,K.,TSUBAMOTO,C.
2001. Sources and Sinks of PM10 in the San Joaquin Valley – Interim Report.
United States Department of Agriculture Special Research Grants Program;
Contract Nos. 94-33825-0383 and 98-38825-6063. Air Quality Group, Crocker Nuclear Laboratory, University of California, Davis.
FUNK,R.,REUTER,H.I., 2004. Dust production from arable land caused by wind erosion and tillage operations. In: Eurosoil 2004, September 4th to 12th, Freiburg, Germany: Abstracts: 254; Freiburg (Albert-Ludwigs-Universität).
FUNK,R.,REUTER,H.I.,HOFFMANN,C.,ENGEL,W.,ÖTTL,D., 2008. Effect of moisture on fine dust emission from tillage operations on agricultural soils.
Earth Surf. Proc. Land. 33. (12) 1851–1863.
GAO F.,FENG G.,SHARRATT B.,ZHANG M., 2014. Tillage and straw management affect PM10 emission potential in subarctic Alaska. Soil Tillage Res. 144. 1-7.
GILLETTE,D.A.,FRYREAR,D.W.,GILL,T.E.,LEY,T.,CAHILL,T.A.,GEARHART, E.A., 1997a. Relation of vertical flux of particles smaller than 10 µm to total aeolian horizontal mass flux at Owens Lake. J. Geophys. Res. 102. 26009–
26015.
GOOSSENS D.,GROSS J.,SPAAN W.,2001.Aeolina dust dynamics in agricultural land areas n Lower Saxony, Germany. Earth Surface Processes and Landforms 26. 701–720 (2001) DOI: 10.1002/esp.216
HAGEN,L.J.,VAN PELT,S.,SHARRATT,B., 2010. Estimating the saltation and suspension components from field wind erosion. Aeolian Res. 1. 147–153.
HINZ,T.,2004. Agricultural PM10 emission from plant production. Proceedings of the PM Emission Inventories Scientific Workshop.
HINZ,T.,TAMOSCHAT-DEPOLT,K.(eds.),2007. ‘Particulate Matter in and from Agriculture’, Landbauforschung Völkenrode. Special Issue 308.
HOFFMANN C.,FUNK R.,2015. Diurnal changes of PM10-emission from arable soils in NE-Germany. Aeolian Research. 17. 117–127.
HOLMÉN,B.A.,JAMES,T.A.,ASHBAUGH,L.L.,FLOCCHINI,R.G., 2001a. LIDAR- assisted measurement of PM10 emissions from agricultural tilling in
California’s San Joaquin Valley - Part I: lidar. Atmospheric Environment. 35.
3251-3264.
HOLMÉN,B.A.,JAMES,T.A.,ASHBAUGH,L.L.,FLOCCHINI,R.G., 2001b. LIDAR- assisted measurement of PM10 emissions from agricultural tilling in
California’s San Joaquin Valley - Part II: Emission factors. Atmospheric Environment. 35. 3265–3277.
HUSSEIN T.,KARPPINEN A., 2006. Meteorological dependence of size-fractionated number concentrations of urban aerosol particles. Atmos. Environ. 40. 1427- 1440.
INFORMATIVE INVENTORY REPORT 2015–HUNGARY.,2017.Hungarian Meteorological Service pp. 176.
http://www.ceip.at/ms/ceip_home1/ceip_home/status_reporting/2017_submiss ions/
ITURRI L.A.,FUNK R.,LEUE M.,SOMMER M.,BUSCHIAZZO D.E., 2017. Wind sorting affects differently the organo-mineral composition of saltating and particulate materials in contrasting texture agricultural soils. Aeolian Research.
28. 39–49.
KASUMBA,J.,HOLMEN,B.A.,HISCOX,A.,WANG,J.,MILLER,D., 2011.
Agricultural PM10 emissions from cotton field disking in Las Cruces, NM.
Atmospheric Environment. 45. 1668–1674.
KJELGAARD J.,CHANDLER D.,SAXTON K., 2004. Evidence for direct suspension of loessial soils on the Columbia Plateau. Earth Surf. Process. Landforms. 29.
221-236.
KOK J.F.,PARTELI E.J.R.,MICHAELS T.I.,KARAM D.B., 2012. The physics of wind-blown sand and dust. Rep. Prog. Phys. 75. 106901.
https://arxiv.org/ftp/arxiv/papers/1201/1201.4353.pdf
LE BLOND,J.S.,WOSKIE,S.,HORWELL,C.J.,WILLIAMSON,B.J., 2016. Particulate matter produced during commercial sugarcane harvesting and processing: A respiratory health hazard? Atmospheric Environment. 149. 34-46.
MADDEN N.M.,SOUTHARD R.J.,MITCHELL J.P., 2008. Conservation tillage reduces PM10 emissions in dairy forage rotations. Atmospheric Environment. 42. (16) 3795-3808.
MADDEN N.M.,SOUTHARD R.J.,MITCHELL J.P., 2010. Soil water and particle size distribution influence laboratory-generated PM10. Atmos. Environ. 44. 745- 752.
MATSUMURA,R.T.,ASHBAUGH,L.,JAMES,T.,CARVACHO,O.,FLOCCHINI,R., 2003. Size distribution of PM10 soil dust emissions from harvesting crops. In:
RAPPORT,D.J.,LASLEY,W.L.,ROLSTON,D.E.,NIELSEN,N.O.,QUALSET, C.O.,DAMANIA,A.B.(eds.), Managing for Healthy Ecosystems. Boca Raton, FL: CRC Press. pp. 801–806.
MENDEZ M.J.,PANEBIANCO J.E.,BUSCHIAZZO D.E., 2013. A new dust generator for laboratory dust emission studies. Aeolian Research. 8. 59-64.
MENDEZ M.J.,AIMAR S.B.,BUSCHIAZZO D.E., 2015. PM10 emissions from aggregate fractions of an Entic Haplustoll under two contrasting tillage systems. Aeolian Research. 19. 195-201.
NÉGYESI G,LÓKI J.,BURÓ B.,SZABÓ J.,BAKACSI Z.,PÁSZTOR L. (2015): The potential wind erosion map of an area covered by sandy and loamy soils – based on wind tunnel measurements. Zeitschrift für Geomorphologie. 59. (1) 59–77.
ÖTTL,D.,FUNK,R.,STURM,P., 2005. PM emission factors for farming activities.
In: Proceedings of the 14th Symposium Transport and Air Pollution, 1–3.6 2005, Technical University Graz, Austria
ÖTTL D.,FUNK R., 2007. PM emission factors for farming activities by means of dispersion modeling. Landbauforschung Völkenrode. SH308. 173-177.
PÁSZTOR L.,NÉGYESI G.,LABORCZI A.,KOVÁCS T.,LÁSZLÓ E.,BIHARI Z. (2016):
Integrated spatial assessment of wind erosion risk in Hungary. Nat. Hazards Earth Syst. Sci. 16. 2421–2432.
PEARCE,D.,CROWARDS,T., 1996. Particulate matter and human health in the United Kingdom. Energy Policy. 24. (7) 609-619.
PEASE,P.,GARE,P.,LECCE,S., 2002. Eolian dust erosion from an agricultural field on the North Carolina Coastal Plain. Phys. Geogr. 23. 381–400.
QIU,G.,PATTEY,E., 2008. Estimating PM10 emissions from spring wheat harvest using an atmospheric tracer technique. Atmospheric Environment. 42. 8315- 8321.
RONEY,J.A.,WHITE,B.R., 2006. Estimating fugitive dust emission rates using an environmental boundary layer wind tunnel. Atmos. Environ. 40. (40) 7668–
7685.
SELAH,A.,FRYREAR,D.W., 1995. Threshold wind velocities of wet soils as affected by wind blown sand. Soil Sci. 160. 304–309.
SHARRATT B.,FENG G., 2009. Windblown dust influenced by conventional and undercutter tillage within the Columbia Plateau, USA. Earth Surf. Process.
Landf., 34. 1323-1332.
SHARRATT B.S., VADDELLA V., 2014. Threshold friction velocity of crusted windblown soils in the Columbia Plateau. Aeolian Res. 15. 227-234.
SHARRATT B.,WENDLING L.,FENG G., 2010. Windblown dust affected by tillage intensity during summer fallow Aeolian Res. 2. 129-134.
SHARRATT B., WENDLING L., FENG G., 2012. Surface characteristics of a windblown soil altered by tillage intensity during summer fallow. Aeolian Res.
5. 1–7.
SINGH P., SHARRATT B., SCHILLINGER W.F., 2012. Wind erosion and PM10
emission affected by tillage systems in the world’s driest rainfed wheat region.
Soil & Tillage Research. 124. 219–225.
STOVERN M., RINE K.P., RUSSELL M.R., FÈLIX O., KING M., SÀEZ A.E., BETTERTON E.A., 2015. Development of a dust deposition forecasting model for mine tailings impoundments using in situ observations and particle transport simulations. Aeolian Res. 18. 155-167.
SWET, N., KATRA, I., 2016. Reduction in soil aggregation in response to dust emission processes. Geomorph. 268. (1) 177-183.
VAN DER HOEK, K., HINZ, T., 2007. Particulate matter emissions from arable production - A guide for UNECE emission inventories. In: HINZ, T., TAMOSCHAT,DEPOLT,K. (eds.). Particulate Matter in and from Agriculture.
Landbauforschung Völkenrode. Special Issue 308. 15–19.
VAN DER ZEE, S.C., HOEK, G., HARSSEMA, H., BRUNEKREEF, B., 1998.
Characterization of particulate air pollution in urban and non-urban areas in the Netherlands. Atmospheric Environment. 32. (21) 3717—3729.
WEINAN C.,ZHIBAO D., ZHENSHAN L.,ZUOTAO Y. 1996. Wind tunnel test of the influence of moisture on the erodibility of loessial sandy loam soils by wind.
Journal of Arid Environment. 34. 391– 402.
WANG J.,MILLER,D.R.,SAMMIS,T.W.,HISCOX,A.L.,YANG,W.L.,HOLMÉN,B.A.
2010. Local dust emission factors for agricultural tilling operations. Soil Sci.
175. (4.) 194-200.
WHO, 2013. Health effects of particulate matter. Policy implications for countries in eastern Europe, Caucasus and central Asia, WORLD HEALTH
ORGANIZATION
http://www.euro.who.int/__data/assets/pdf_file/0006/189051/Health-effects- of-particulate-matter-final-Eng.pdf
ZENDER C.S., MILLER R.L., TEGEN I., 2004. Quantifying mineral dust mass budgets: terminology, constraints, and current estimates. EOS. 85. (48) 509- 512.
ZOBECK,T.M.,GILL,T.E.,POPHAM,T.W.,1999. A two-parameter Weibull function to describe airborne dust particle size distributions. Earth Surf. Process.
Landforms. 24. 943–955.