Konkoly Observatory Budapest
05 April 2018
HU ISSN 0374 – 0676
2MASS J06422218-0226285 - A NEW OUTBURST SOURCE†
BLEX, SUSANNE1; HACKSTEIN, MORITZ1; HAAS, MARTIN1; KIMESWENGER, STEFAN2,3; CHINI, ROLF1,2; HODAPP, KLAUS4
1Astronomisches Institut, Ruhr-Universit¨at Bochum, Germany; e-mail: sublex@astro.rub.de
2Instituto de Astronom´ıa, Universidad Cat´olica del Norte, Chile
3Institute for Astro- and Particle Physics, University of Innsbruck, Austria
4Institute for Astronomy, University of Hawaii, USA
Abstract
We discovered the outburst of 2MASS J06422218–0226285. Between end 2012 and early 2014, this object brightened by 3 mag in r andi, and by 3.7 mag in J. Since then, it has stayed at high brightness of about 16 mag in r and 15 mag in i. Possible explanations for this kind of light curve might be a Catalysmic Variable, a Symbiotic Binary or a FUor or EXor type Young Stellar Object.
The color properties favor an outbursting Young Stellar Object.
2MASS J06422218–0226285 brightened between the end of 2012 and early 2014 by about 3 mag in r and i, and by 3.7 mag in J, and has stayed at high brightness since then.
This object has been photometrically surveyed by several missions at optical and in- frared wavelengths. Among these surveys are GSC II in 1991 (Lasker et al. 2008), 2MASS in 1998 (Skrutskie et al. 2006), DENIS in 2000 (Epchtein et al. 1994), IPHAS in 2006 (Barentsen et al. 2014), and WISE in 2010 (Wright et al. 2010). Viironen et al. (2009) described J06422218–0226285 as a planetary nebula (PN) and also have found that Hα probably has been in emission before the outburst. There is no prominent star forming region close to the object.
While analyzing exceedingly red and variable objects among the Galactic Disc Survey (GDS, Haas et al. 2012, Hackstein et al. 2015), Blex (2017) discovered the brightening of 2MASS J06422218–0226285 (or GDS J064221-022628). The discovery of the outburst motivated further measurements at the Universit¨atssternwarte Bochum (USB) near Cerro Armazones, Chile. Between November 23rd and December 12th in 2017, the latest optical data in the B, V, r, and i filters have been collected. During three nights in February to March 2018, we were able to obtain narrow-band spectro-photometry of HeI, H2 (1-0) S1, Brγ, CO, and Kc, as wll as JHKs broadband photometry. Our search for Hα emission after the outburst using narrow bands at 6450, 6563 and 6721 ˚A has failed due to a too low object brightness and poor S/N at these wavelengths.
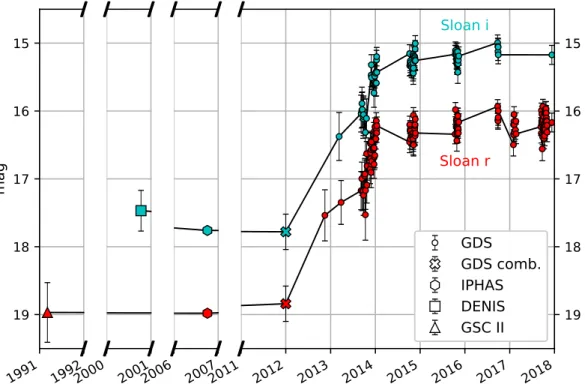
Figure 1 shows the r- and i-band light curves from the GDS together with previous photometry of GSC II, DENIS, and IPHAS (Barentsen et al. 2014) data points. The light
†Based on data collected under the ESO/RUB — USB agreement at the Paranal Observatory
2 IBVS6240
1991 1992 15
16 17 18 19
ma g
2000 20012006 20072011 2012 2013 2014 2015 2016 2017 2018 15 16 17 18 19 Sloan r
Sloan i
GDS GDS comb.
IPHAS DENIS GSC II
Figure 1. GDS light curve in r andi with additional IPHAS, DENIS, and GSC II data points; the IPHAS error is smaller than the symbol size.
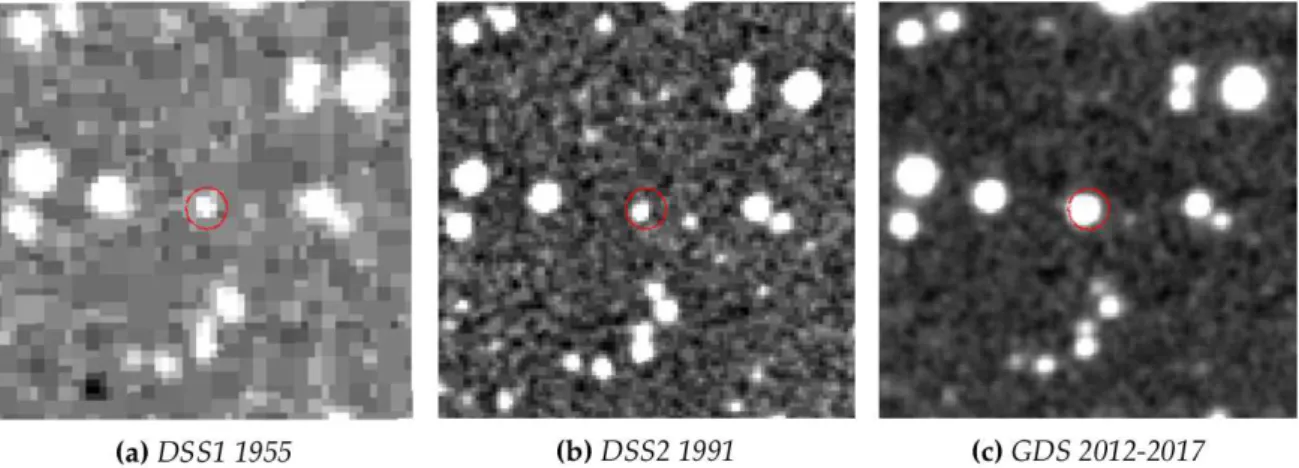
curve values are listed in Tables 2 and 3 (at the end of the paper). The latest measurement in December 2017 yielded an r magnitude of 16.170 ±0.139 and an i magnitude of 15.173±0.140. A check of the single segments of the GDS light curve showed no short-term periodicity. The GSC II, IPHAS, and GDS measurements suggest a constant brightness of about r = 19 mag between 1991 and 2012. A constant faint state lasting back from 1991 to 1955 is further supported by the sequence of past DSS1, DSS2, and present GDS image cutouts (Fig. 2).
The optical to mid-infrared spectral energy distribution (SED) is depicted in Fig. 3, separated for both faint and bright states. Already before 2012, J06422218–0226285 has shown an infrared excess in the 2MASS and WISE color-color diagrams, consistent with a classical T Tauri star surrounded by circumstellar dust. After the outburst, the star has become much redder, suggesting dispersed dust. Although Hα does not appear in emission after the outburst, a strong P Cygni-type absorption could balance out potential emission.
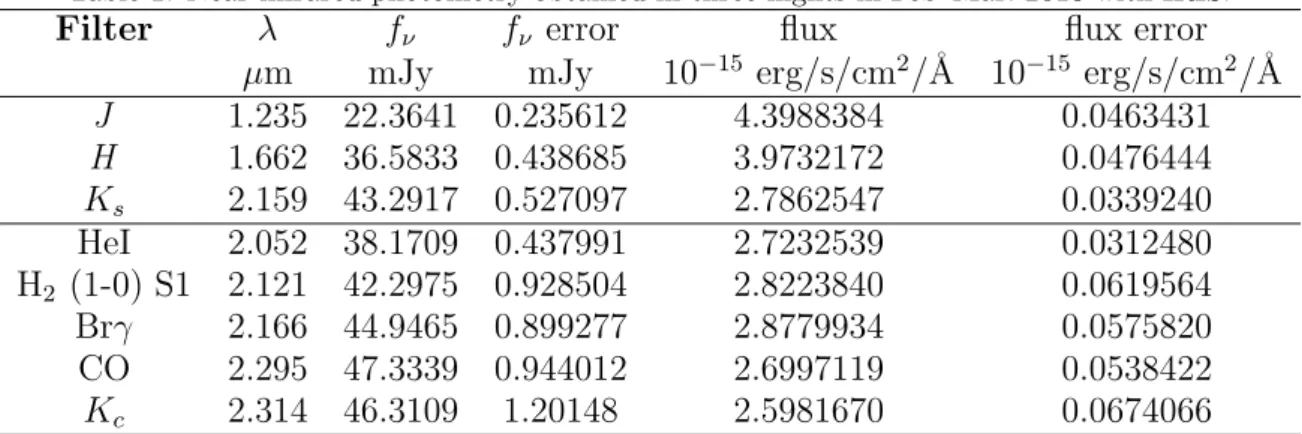
Our near-infrared JHKs and narrow-band spectro-photometry reveals a potential Brackett–gamma (Brγ) emission (Fig. 4, Tab. 1). The resulting Brγ flux would be about 5.1·10−17 W/m2, comparable to the range found by Carr et al. (1990) for Young Stellar Objects (YSOs). The large Brγ equivalent width of about 19 ˚A would place J06422218–
0226285 among strongly accreting YSOs. In this scenario, the increase in brightness can be explained as a FUor- or EXor-type outburst.
Furthermore, matching with 2MASS allowed for searching the environment of J06422218–0226285 for K-excess objects in the JHKs color-color diagram, which lie at least 2σ right-hand of the slope (J −H) = 1.7 (H −K)−0.12. We considered only
Figure 2. Comparison of the cutouts from the red filter of the DSS and the Sloanr filter of the GDS;
angular size: approximately 100×100′′.
1 10
wavelength [ µm ] 10-1
100 101 102
flux density [ mJy ]
IPHAS 2006 DENIS 2000 2MASS 1998 WISE 2010 GDS before 2012 GDS 2017/2018
Figure 3. Spectral energy distribution; depicted GDS filters: B,V,r,i,J,H,Ks; error bars (if not seen) are smaller than the symbol size.
4 IBVS6240
J06422218 − 0226285, avg
1.0 1.2 1.4 1.6 1.8 2.0 2.2 2.4 Wavelength [ µm ]
2.0 2.5 3.0 3.5 4.0 4.5 5.0
10−15 erg/s/cm2 /Å
Brγ = 5.1 x 10⁻¹⁷W/m2
S1 = 3.2 x 10⁻¹⁷W/m2 HeI BrγS1 COKc
J H Ks
1.0 1.2 1.4 1.6 1.8 2.0 2.2 2.4 0
2 4 6 8 10
1.0 1.2 1.4 1.6 1.8 2.0 2.2 2.4 0
1 2 3 4 5 6
J06421954−0225587 J06420843−0227058
Figure 4. Average near infrared photometry of 2MASS J06422218–0226285 (left large panel) and two nearby stars of similar brightness (right, two small panels). The photometry was obtained in three nights in Feb–Mar 2018 with the IRIS telescope at USB in the broadband filtersJ HKs and five narrow bands (FWHM = 275 ˚A) centered at 2.05, 2.121, 2.167, 2.29 and 2.314µm (HeI, H2 (1-0) S1, Brγ, CO, Kc, black filled circles connected with a red line). The horizontal dashed lines indicate the bandwidth and error range of the broadbandJ,H,Ks. For 2MASS J06422218-0226285 the error range in all bands
is∼2%, thus significantly larger than for other nearby stars of similar brightness (<0.5%); this indicates a remaining small variability of 2MASS J06422218–0226285. For 2MASS J06422218–0226285
the flux in the Brγ filter lies above both theKs broadband flux and the continuum as interpolated between HeI and CO andKc (blue dotted line). While HeI and CO absorption cannot be ruled out yet,
for an outbursting object it appears more likely that Brγ and hydrogen S1 are in emission.
Table 1: Near-infrared photometry obtained in three nights in Feb–Mar. 2018 with IRIS.
Filter λ fν fν error flux flux error µm mJy mJy 10−15 erg/s/cm2/˚A 10−15 erg/s/cm2/˚A J 1.235 22.3641 0.235612 4.3988384 0.0463431 H 1.662 36.5833 0.438685 3.9732172 0.0476444 Ks 2.159 43.2917 0.527097 2.7862547 0.0339240 HeI 2.052 38.1709 0.437991 2.7232539 0.0312480 H2 (1-0) S1 2.121 42.2975 0.928504 2.8223840 0.0619564 Brγ 2.166 44.9465 0.899277 2.8779934 0.0575820 CO 2.295 47.3339 0.944012 2.6997119 0.0538422 Kc 2.314 46.3109 1.20148 2.5981670 0.0674066
a 1200′′ box around the target to maintain a balance between the consideration of only the close environment of the star and sufficient statistics. This yields a rate of 1.49 % (16 out of 1077)Ks excess stars near J06422218–0226285. The resulting rate needs to be compared with the expected frequency ofKsexcess stars near the galactic plane. For this purpose, we used the center coordinates of 15 randomly selected GDS fields with 6h <
RA<11h and investigated the 2MASS stars in a 1200′′ box around these coordinates. In total, 26588 2MASS stars (with flag A, B) are covered by these boxes with 151 of them (0.57 %) being K-excess stars. To estimate the field-to-field fluctuation, the fraction of K-excess stars is calculated individually for each field and then averaged, resulting in a mean of 0.62 % and standard deviation of 0.31 %. Thus, the rate of Ks excess stars near J06422218–0226285 is almost 3σ above that of the mean. Note that only in one of the 15 boxes the rate of K-excess stars is as high as in the case of J06422218–0226285.
Hence, one might speculate that J06422218–0226285 is located in a region of thin star formation or a star forming region at the end of its lifespan. Additionally, IRAS-IRIS and AKARI images indicate a nebulous surrounding. These findings, Hαemission before and Brγ emission after the outburst, and the present and past infrared excess support the claim of a YSO; albeit it is not close to a known star-forming region and there are no emission or reflection nebulae nor a high number of Hα objects near J06422218–0226285 and the amplitude is rather low for a FUor. Accordingly, these indications require further confirmation by spectroscopy.
Alternatively to a YSO, J06422218–0226285 could be a cataclysmic variable (CV). As already noted in Warner (1995a), some subclasses of CVs show stable high states after an outburst for several years up to decades (see, e.g., MV Lyr in Warner, 1995b, and RX And and TZ Per in Simonsen et al., 2014). It is believed that this is caused by a mass transfer feedback heating the secondary star. In this case, the Hα and Brγ emission can be explained by the surrounding accretion disk. Also, the irregular r−icolor variations of up to 0.8 mag fit this scenario.
Several features of J06422218–0226285 in the light curve and the SED are reminiscent of a symbiotic binary. Among them are the signs of circumstellar gas and dust and different variability effects on the time scales of days to months. These could explain the shape of the SED and the minor variations of the light curve after the outburst. Since the novae of symbiotic binaries rise up to 3 mag in the optical in a couple of years at most and last for up to a century (see Skopal, 2015 and Munari, 2012), the characteristics of the outburst of J06422218–0226285 fit this scenario as well.
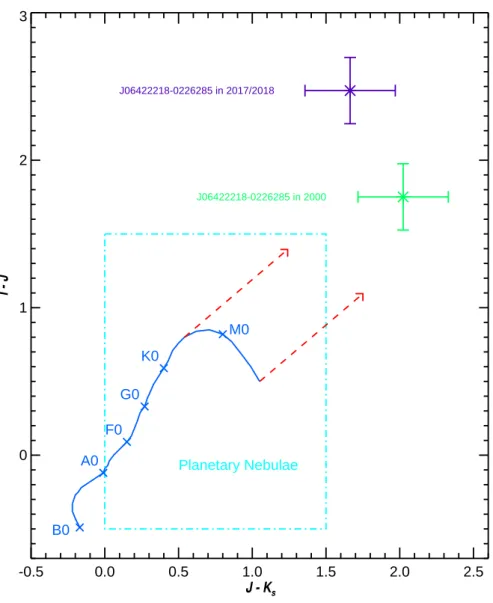
Viironen et al. (2009) identified J06422218-0226285 as a planetary nebula candidate due to its position in IPHAS and 2MASS color-color diagrams. However, in a DENIS IJKs color-color diagram (Fig. 5), the object lies outside of the area of PNs; instead it exhibits symbiotic Mira colors (see Schmeja & Kimeswenger, 2001 and Schmeja &
Kimeswenger, 2003). Furthermore, the light curve does not fit a pulsating star, and the increase in brightness certainly is too vast and rapid for Post-AGB evolution. After the outburst, J06422218–0226285 still resides outside the area of PNs. Here, theI magnitude has been estimated from a black-body fit to the SED (Fig. 3).
To summarize, based on the Bochum Galactic Disk Survey, we detected a remarkable 3–4 mag outburst of J06422218–0226285 in 2013. The nature of the star is still puzzling.
The multi-band photometry is consistent with a FUor- or EXor-type YSO, albeit the star is located in a thin star forming region. Also, the alternatives of a cataclysmic variable or a symbiotic binary or a PN/post-AGB are possible. In any case, the system shows
6 IBVS6240
-0.5 0.0 0.5 1.0 1.5 2.0 2.5
J - Ks 0
1 2 3
I - J
J06422218-0226285 in 2000 J06422218-0226285 in 2017/2018
Planetary Nebulae
B0 A0
F0 G0
K0
M0
Figure 5. IJ Kscolor-color diagram: blue curve – main sequence stars; blue crosses – position of B0, A0, F0, G0, K0, M0 stars; red dashed-dotted lines – reddening paths forAV = 3.5; cyan area –
expected colors for planetary nebulae; green and purple cross – 2MASS J06422218–0226285.
or X-ray or radio).
Acknowledgements: We thank the referee for the instructive comments.
References:
Barentsen, G., Farnhill, H. J., Drew, J. E., et al., 2014, MNRAS, 444, 3230 DOI
Blex, S., 2017, Variable Infrared Excess Objects from the Bochum Galactic Disk Survey, Master Thesis, Ruhr-Universit¨at Bochum
Carr, J. S. & Tokunaga, A. T., 1992,ApJL,393, L67 DOI
Epchtein, N., de Batz, B., Copet, E., et al., 1994, ApSS,217, 3 DOI
Haas, M., Hackstein, M., Ramolla, M., Drass, H., Watermann, R., Lemke, R., & Chini, R., 2012, AN, 333, 706 DOI
Hackstein, M., Fein, C., Haas, M., et al., 2015,AN, 336, 590 DOI
Lasker, B. M., Lattanzi, M. G., McLean, B. J., et al., 2008, AJ, 136, 735 DOI Munari, U., 2012,JAAVSO, 40, 572
Schmeja, S. & Kimeswenger, S., 2001, A&A,377, L18 DOI Schmeja, S. & Kimeswenger, S., 2003, ASPC Series, 303, 446 Simonsen, M., Boyd, D., Goff, W., et al., 2014, JAAVSO,42, 177 Skopal, A., 2015, ASPC Series,496, 226
Skrutskie, M. F., Cutri, R. M., Stiening, R., et al., 2006,AJ, 131, 1163 DOI Viironen, K., Mampaso, A., Corradi, R. L. M., et al., 2009, A&A, 502, 113 DOI
Warner, B., 1995a, Cataclysmic Variable Stars, Cambridge Astrophysics Series 28, Cam- bridge University Press
Warner, B., 1995b, ApSS,230, 83 DOI
Wright, E. L., Eisenhardt, P. R. M., Mainzer, A. K., et al., 2010, AJ, 140, 1868 DOI
8 IBVS6240
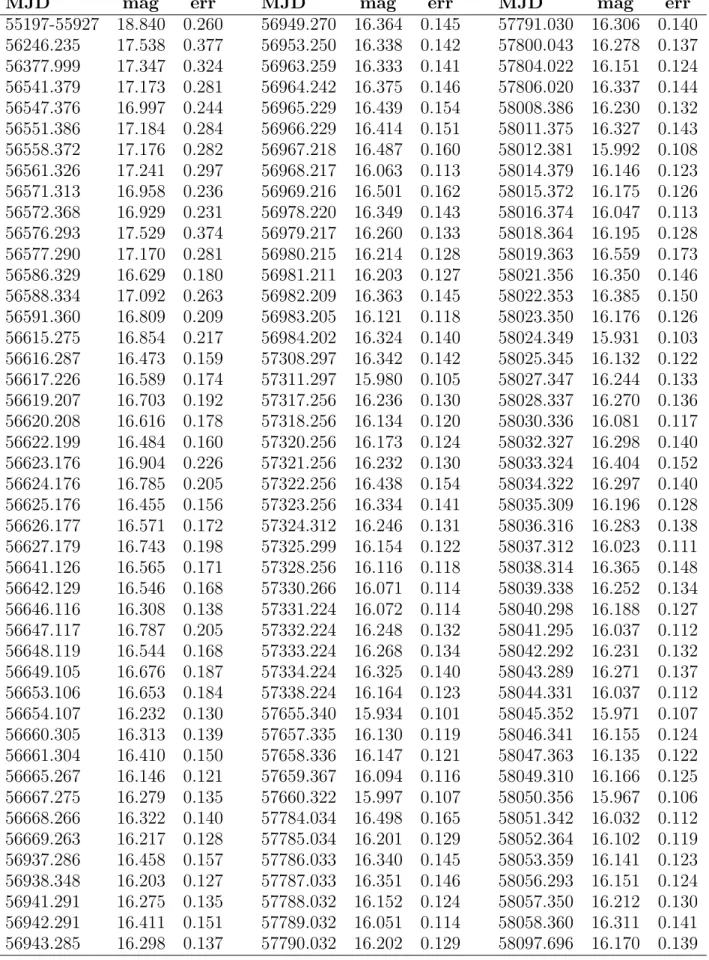
Table 2: GDS r magnitudes; the first line gives the magnitude of co-added images between 2010 and 2012.
MJD mag err MJD mag err MJD mag err
55197-55927 18.840 0.260 56949.270 16.364 0.145 57791.030 16.306 0.140 56246.235 17.538 0.377 56953.250 16.338 0.142 57800.043 16.278 0.137 56377.999 17.347 0.324 56963.259 16.333 0.141 57804.022 16.151 0.124 56541.379 17.173 0.281 56964.242 16.375 0.146 57806.020 16.337 0.144 56547.376 16.997 0.244 56965.229 16.439 0.154 58008.386 16.230 0.132 56551.386 17.184 0.284 56966.229 16.414 0.151 58011.375 16.327 0.143 56558.372 17.176 0.282 56967.218 16.487 0.160 58012.381 15.992 0.108 56561.326 17.241 0.297 56968.217 16.063 0.113 58014.379 16.146 0.123 56571.313 16.958 0.236 56969.216 16.501 0.162 58015.372 16.175 0.126 56572.368 16.929 0.231 56978.220 16.349 0.143 58016.374 16.047 0.113 56576.293 17.529 0.374 56979.217 16.260 0.133 58018.364 16.195 0.128 56577.290 17.170 0.281 56980.215 16.214 0.128 58019.363 16.559 0.173 56586.329 16.629 0.180 56981.211 16.203 0.127 58021.356 16.350 0.146 56588.334 17.092 0.263 56982.209 16.363 0.145 58022.353 16.385 0.150 56591.360 16.809 0.209 56983.205 16.121 0.118 58023.350 16.176 0.126 56615.275 16.854 0.217 56984.202 16.324 0.140 58024.349 15.931 0.103 56616.287 16.473 0.159 57308.297 16.342 0.142 58025.345 16.132 0.122 56617.226 16.589 0.174 57311.297 15.980 0.105 58027.347 16.244 0.133 56619.207 16.703 0.192 57317.256 16.236 0.130 58028.337 16.270 0.136 56620.208 16.616 0.178 57318.256 16.134 0.120 58030.336 16.081 0.117 56622.199 16.484 0.160 57320.256 16.173 0.124 58032.327 16.298 0.140 56623.176 16.904 0.226 57321.256 16.232 0.130 58033.324 16.404 0.152 56624.176 16.785 0.205 57322.256 16.438 0.154 58034.322 16.297 0.140 56625.176 16.455 0.156 57323.256 16.334 0.141 58035.309 16.196 0.128 56626.177 16.571 0.172 57324.312 16.246 0.131 58036.316 16.283 0.138 56627.179 16.743 0.198 57325.299 16.154 0.122 58037.312 16.023 0.111 56641.126 16.565 0.171 57328.256 16.116 0.118 58038.314 16.365 0.148 56642.129 16.546 0.168 57330.266 16.071 0.114 58039.338 16.252 0.134 56646.116 16.308 0.138 57331.224 16.072 0.114 58040.298 16.188 0.127 56647.117 16.787 0.205 57332.224 16.248 0.132 58041.295 16.037 0.112 56648.119 16.544 0.168 57333.224 16.268 0.134 58042.292 16.231 0.132 56649.105 16.676 0.187 57334.224 16.325 0.140 58043.289 16.271 0.137 56653.106 16.653 0.184 57338.224 16.164 0.123 58044.331 16.037 0.112 56654.107 16.232 0.130 57655.340 15.934 0.101 58045.352 15.971 0.107 56660.305 16.313 0.139 57657.335 16.130 0.119 58046.341 16.155 0.124 56661.304 16.410 0.150 57658.336 16.147 0.121 58047.363 16.135 0.122 56665.267 16.146 0.121 57659.367 16.094 0.116 58049.310 16.166 0.125 56667.275 16.279 0.135 57660.322 15.997 0.107 58050.356 15.967 0.106 56668.266 16.322 0.140 57784.034 16.498 0.165 58051.342 16.032 0.112 56669.263 16.217 0.128 57785.034 16.201 0.129 58052.364 16.102 0.119 56937.286 16.458 0.157 57786.033 16.340 0.145 58053.359 16.141 0.123 56938.348 16.203 0.127 57787.033 16.351 0.146 58056.293 16.151 0.124 56941.291 16.275 0.135 57788.032 16.152 0.124 58057.350 16.212 0.130 56942.291 16.411 0.151 57789.032 16.051 0.114 58058.360 16.311 0.141 56943.285 16.298 0.137 57790.032 16.202 0.129 58097.696 16.170 0.139
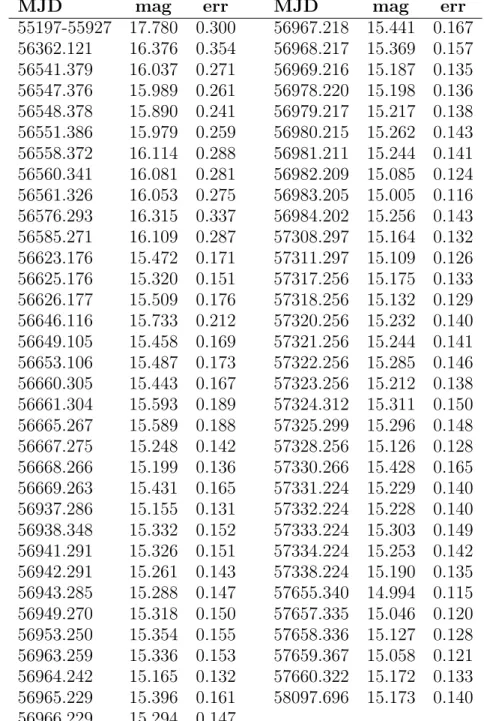
Table 3: GDS i magnitudes; the first line gives the magnitude of co-added images between 2010 and 2012.
MJD mag err MJD mag err
55197-55927 17.780 0.300 56967.218 15.441 0.167 56362.121 16.376 0.354 56968.217 15.369 0.157 56541.379 16.037 0.271 56969.216 15.187 0.135 56547.376 15.989 0.261 56978.220 15.198 0.136 56548.378 15.890 0.241 56979.217 15.217 0.138 56551.386 15.979 0.259 56980.215 15.262 0.143 56558.372 16.114 0.288 56981.211 15.244 0.141 56560.341 16.081 0.281 56982.209 15.085 0.124 56561.326 16.053 0.275 56983.205 15.005 0.116 56576.293 16.315 0.337 56984.202 15.256 0.143 56585.271 16.109 0.287 57308.297 15.164 0.132 56623.176 15.472 0.171 57311.297 15.109 0.126 56625.176 15.320 0.151 57317.256 15.175 0.133 56626.177 15.509 0.176 57318.256 15.132 0.129 56646.116 15.733 0.212 57320.256 15.232 0.140 56649.105 15.458 0.169 57321.256 15.244 0.141 56653.106 15.487 0.173 57322.256 15.285 0.146 56660.305 15.443 0.167 57323.256 15.212 0.138 56661.304 15.593 0.189 57324.312 15.311 0.150 56665.267 15.589 0.188 57325.299 15.296 0.148 56667.275 15.248 0.142 57328.256 15.126 0.128 56668.266 15.199 0.136 57330.266 15.428 0.165 56669.263 15.431 0.165 57331.224 15.229 0.140 56937.286 15.155 0.131 57332.224 15.228 0.140 56938.348 15.332 0.152 57333.224 15.303 0.149 56941.291 15.326 0.151 57334.224 15.253 0.142 56942.291 15.261 0.143 57338.224 15.190 0.135 56943.285 15.288 0.147 57655.340 14.994 0.115 56949.270 15.318 0.150 57657.335 15.046 0.120 56953.250 15.354 0.155 57658.336 15.127 0.128 56963.259 15.336 0.153 57659.367 15.058 0.121 56964.242 15.165 0.132 57660.322 15.172 0.133 56965.229 15.396 0.161 58097.696 15.173 0.140 56966.229 15.294 0.147