Konkoly Observatory Budapest
16 August 2018 HU ISSN 0374 – 0676
PHOTOMETRY OF OV BOOTIS AT THE 2017 OUTBURST
TANABE, KENJI1; AKAZAWA, HIDEHIKO1; FUKUDA, NAOYA1
1 Department of Biosphere-Geosphere Science, Okayama University of Science, Ridaicho 1-1,Okayama 700- 0005, Japan, e-mail: tanabe@big.ous.ac.jp
Abstract
We present our photometric results of OV Boo obtained during the 2017 outburst.
On March 14.63 UT, 2017, a Japanese observer, Masaru Mukai detected, a bright outburst of the dwarf nova OV Bootis which showed the system increasing from qui- escent magnitude of ∼ 18.5 to a magnitude of 11.4. Mukai’s detection was performed under the collaboration with Seiichi Yoshida (the leader of the MISAO Project, see http://www.aerith.net/misao/, an image-data analysis group). Soon after the discov- ery, at 14.76 UT, Hidehiko Akazawa, one of the co-authors of the present paper, started time-series photometry at his personal observatory. Observational journal is given in Ta- ble 1. During this early stage, photometric observations were performed using both Rc and clear filter. Here we present only the data with RC filter which will highlight the behaviour due to Hα emission.
OV Boo was originally discovered as one of 32 new cataclysmic variable stars (CVs) by the Sloan Digital Sky Survey (SDSS) in 2003. During its quiescence stage, OV Boo (previous designation was SDSS J1507+52, or simply J1507) was first investigated by Szkody et al.(2005) together with other CVs. They obtained its orbital period to be 67 min, an exceptionally short period (below the so-called period minimum: (≈75 min; see for example, Paczynski (1981)), from its light curve that showed deep eclipses. They also obtained its spectrum, with double-peaked Hα emission line possibly from its accretion disk. However, the star was too faint to obtain its radial velocity curve. This object seems to have experienced a long-lasting (33 years) quiescence (Bengtsson 2017). From this point of view, the behaviour of this variable star was similar to a WZ Sge-type dwarf nova (DN), a subclass of SU UMa-type DN with larger outburst amplitude, having very short orbital period(≈ 80 min) and very long (some 10 years) quiescence interval (so-called supercycle) between successive outbursts. However, its orbital period is much shorter than the period minimum and seems to be against the standard theory of dwarf nova evolution (see, for example, Hellier (2001), chapter 4). In fact Littlefair et al. (2007) investigated the binary structure of this star by high speed photometry and obtained each mass of the binary system, suggesting that this DN is an exotic one because of their low mass (below the hydrogen-burning limit) secondary star. Uthas et al. (2011; see also the chapter 5 in her PhD Thesis) proposed that this binary system has a possibility of being a member of Galactic halo.
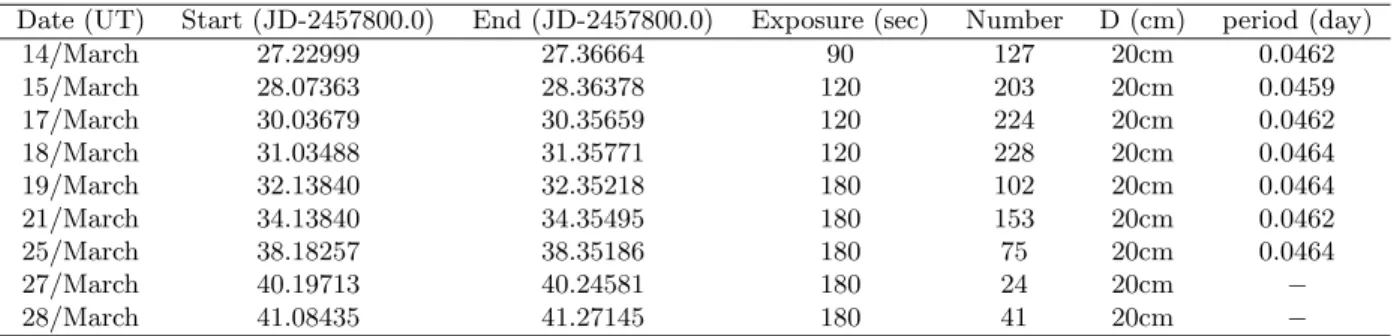
Table 1: Journal of CCD Observation by H. Akazawa
Date (UT) Start (JD-2457800.0) End (JD-2457800.0) Exposure (sec) Number D (cm) period (day)
14/March 27.22999 27.36664 90 127 20cm 0.0462
15/March 28.07363 28.36378 120 203 20cm 0.0459
17/March 30.03679 30.35659 120 224 20cm 0.0462
18/March 31.03488 31.35771 120 228 20cm 0.0464
19/March 32.13840 32.35218 180 102 20cm 0.0464
21/March 34.13840 34.35495 180 153 20cm 0.0462
25/March 38.18257 38.35186 180 75 20cm 0.0464
27/March 40.19713 40.24581 180 24 20cm −
28/March 41.08435 41.27145 180 41 20cm −
The 2017 outburst of OV Boo is a good (probably the best and lucky) chance to investigate the nature of this peculiar cataclysmic variable star. One of the most important problems is to determine whether this outburst of OV Boo is the superoutburst of SU UMa-type (or WZ Sge-type) or not.
Photometric precision is up to 0.015 magnitude but depends on daily sky condition.
Time-series photometric data are processed by the software AIP4Win ver.2. The basic properties of variable star (OV Boo) and comparison stars for calibration are shown in Table 2.
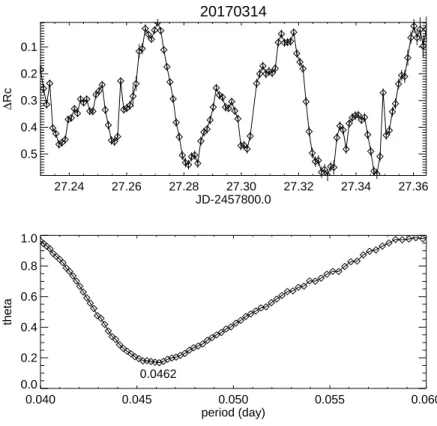
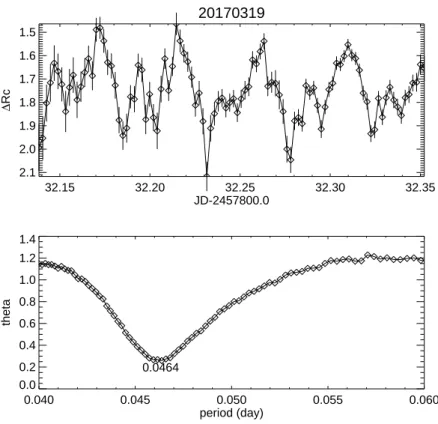
Overall light curve at the early stage (the first 2 weeks) is given in Figure 1. Repre- sentative light curves are given in the upper panel of Figures 2 and 3. Tentative period analysis for the daily humps are performed by the Phase Dispersion Minimization (PDM) method (Stellingwerf 1978). The values of the period (day) of hump for each night are in the last column of Table 1. The complete period analysis by PDM for the entire data during the early stage of the outburst is given below. Also we calculate the error of the obtained period by applying the linear regression to the O–C diagram.
28 30 32 34 36 38 40 42
JD-2457800.0 3.0
2.5 2.0 1.5 1.0 0.5 0.0 -0.5
∆Rc
Figure 1. Overall light curve of theRC data during the early stage of outburst. ∆RC denotes theRC magnitude difference from the peak outburst brightness.
Temporal change of the outburst during the early stage is shown in Figure 4. From this, we can see the double-peaked profile in the light curve. This may be due to multiple sources of bright regions on its accretion disk. Such a profile suggests us a connection
Table 2: The Basic Properties on Variable Star and Comparison Stars used: Positions and magnitudes
Star GSC RA Dec V R
15h +52◦
V OV Boo 07m22.35s 30′07.7′′ var var C1 03868-01067 07m16.48s 33′14.82′′ 11.5 11.2 C2 03868-00859 06m20.81s 28′32.41′′ 12.2 11.9
with the spectroscopic feature of Hα emission obtained by Szkody et al. (2005).
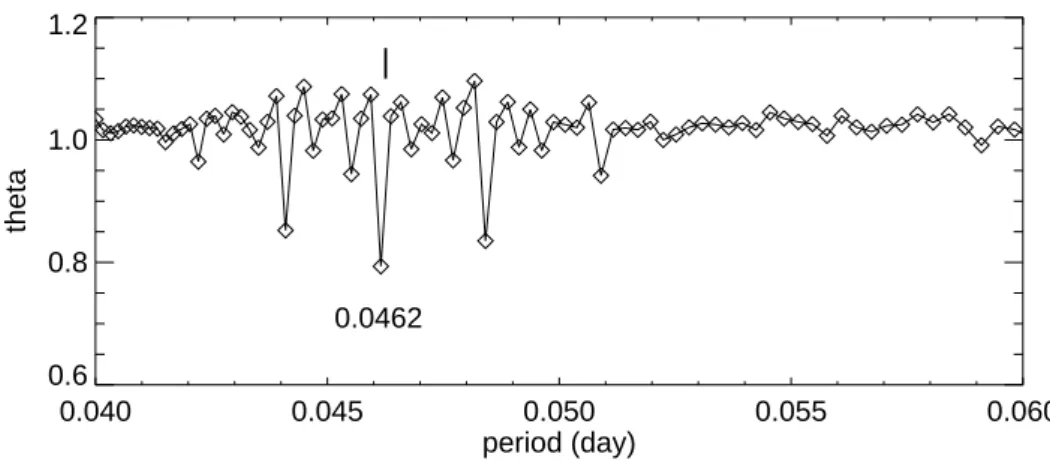
Overall period by PDM for the entire data of the early stage of the 2017 outburst is given in Figure 5. The obtained period is 0.0461538 day = 66.46 min. Taking into account the time-resolution (from 1.5 min to 3 min), this value of the period is close to the orbital one obtained by Littlefair et al. (2007) (66.61 min).
The error of the above period obtained can be estimated by making use of the O–C diagram. If we take the tentative period derived from the PDM and the earliest recorded maximum as an epoch, we can present an O–C diagram of this stage (Figure 6). A tentative ephemeris used here is as follows:
Tmax = 2457827.26654 + 0.04615E ; E = 1,2,3,· · · Applying a linear regression to our O–C diagram,we obtain as follows:
P = 66.613±0.009 min.
20170314
27.24 27.26 27.28 27.30 27.32 27.34 27.36
JD-2457800.0 0.5
0.4 0.3 0.2 0.1
∆Rc
0.040 0.045 0.050 0.055 0.060
period (day) 0.0
0.2 0.4 0.6 0.8 1.0
theta
0.0462
Figure 2. Representative light curve (upper panel) and correspondingθdiagram: March 14th.
20170319
32.15 32.20 32.25 32.30 32.35
JD-2457800.0 2.1
2.0 1.9 1.8 1.7 1.6 1.5
∆Rc
0.040 0.045 0.050 0.055 0.060
period (day) 0.0
0.2 0.4 0.6 0.8 1.0 1.2 1.4
theta
0.0464
Figure 3. Representative light curve (upper panel) and correspondingθdiagram: March 19th.
-1.0 -0.5 0.0 0.5 1.0
phase 2.5
2.0 1.5 1.0 0.5 0.0
∆Rc
Mar. 14 Mar. 15
Mar. 17 Mar. 18 Mar. 19 Mar. 21 Mar. 25
Figure 4. Daily change ofRC light curve during the early stage of 2017 outburst. Abscissa is the phase corresponding 0.04615 day. Ordinate is the same as Fig. 1
This value of the period together with the error is thought to be almost identical to the orbital periodPorb obtained by Littlefair et al. (2007).
In addition, we could not detect the so-called common superhump. We are now prepar- ing a report on the later stage of OV Boo’s 2017 outburst.
We conclude that from the behaviour of the early stage of 2017 outburst, in spite of high (≈ 7 mag) amplitude, this ultra-short period cataclysmic binary star seems to be different from either WZ Sge-type or SU UMa-type DNe. Moreover OV Boo is a different type of DN from other ultra-short orbital period DNe including EI Psc (64.87 min) and CSS130418 (64.84 min). This may be due to too small mass of the secondary star of OV Boo (Littlefair et al., 2007) to give rise to elliptical disk around the primary (white dwarf) star.
0.040 0.045 0.050 0.055 0.060
period (day) 0.6
0.8 1.0 1.2
theta
0.0462
Figure 5. θ diagram for the entire data of the early stage (March of 2017) outburst. Abscissa is the period (day). Vertical line denotes the orbital period obtained by Littlefair et al. (2007).
28 30 32 34 36 38 40
JD-2457800.0 -0.02
-0.01 0.00 0.01 0.02 0.03 0.04
O-C (day)
p=0.046259
Figure 6. A tentative O–C diagram during the early stage of 2017 outburst.
OV Boo. One of the authors (K. Tanabe) expresses gratitude to Rosa Poggiani (University of Pisa) for her advice.
References:
Bengtsson, H.; Kato, T., 2017, vsnet-alert, ♯20792 Hellier, C., 2001, Cataclysmic Variable Stars, Cambridge Littlefair, S.P. et al., 2007, MNRAS, 381, 827
Paczynski, B., 1981, AcA,31, 1 Szkody, P. et al., 2005, AJ, 129, 2386 Stellingwerf, R. F., 1978, ApJ, 224, 953 Uthas, H. et al., 2011, MNRAS, 414, L85 Uthas, H., 2011, PhD Thesis