Volume 63 Number 6257 DOI: 10.22444/IBVS.6257
Konkoly Observatory Budapest
19 January 2019 HU ISSN 0374 – 0676
UU Aqr – NO SUPERHUMPS BUT VARIATIONS ON THE TIME SCALE OF DAYS
BRUCH, ALBERT
1 Laborat´orio Nacional de Astrof´ısica, Rua Estados Unidos, 154, CEP 37504-364, Itajub´a – MG, Brazil
Abstract
Recently, brightness variations occurring ontwicethe accretion disk precession period in the old nova and permanent superhump system V603 Aql have been observed by Bruch & Cook (2018). In an attempt to detect a similar effect in other cataclysmic variables reported to contain permanent superhumps the novalike variable UU Aqr was observed during 11 nights in September 2018. While no traces of superhumps were seen in the data, rendering the quest for variations related to the disk precession period obsolete, the system exhibits regular variations with a period of ∼4 days.
The light curves of some cataclysmic variables exhibit photometric variations, termed superhumps, with periods slightly longer than their orbital periods. They are thought to be caused by stresses induced by the periodic passage of the secondary star close to the extended part of the accretion disk which in these cases is not circular but elliptically deformed (Whitehurst, 1988). The period is longer than the orbital period because the major axis of the accretion disk precesses. An alternative model is promoted by Smak (2009): the irradiation of the secondary star by the primary component varies because of rotating non-axisymmetric vertical structures in the accretion disk, leading to a modula- tion of the mass transfer rate and in consequence to variable dissipation of kinetic energy.
The superhump phenomenon occurs always during supermaxima of the short-period dwarf novae of SU UMa subtype. However, some novalike variables and old nova also exhibit su- perhumps (see, e.g., Patterson, 1999). (Although these are normally termed “permanent superhumpers”, superhumps in these systems may not always be that permanent!)
One of them is the old nova V603 Aql which has an orbital period of Porb = 3.32 h and a well established (albeit slightly variable) superhump period of PSH ≈ 3.5 h. Recently, Bruch & Cook (2018) found an additional period in the light curve of V603 Aql which is related to the beat between Porb and PSH, confirming marginal evidence for this phe- nomenon presented earlier by Suleimanov et al. (2004). Some other permanent superhump systems with limited evidence for a similar behaviour are listed by Yang et al. (2017).
On the other hand, in SU UMa type dwarf novae with high orbital inclination variations of the system brightness on the beat period are common (Smak, 2009; 2013) and can readily be explained in Smak’s model by the non-axisymmetric structures in the outer disk. As confirmed observationally by Smak (2009) such modulation should therefore not be seen in low inclination systems. Consequently, the beat period related variations seen in V603 Aql can not be explained within Smak’s model because the orbital inclination of 13o±2o (Arenas et al. 2000) is far to low. Moreover, quite intriguingly and in contrast to
2 IBVS6257
the finding of Suleimanov et al. (2004) the period observed very clearly by Bruch & Cook (2018) is not equal to the beat betweenPorb andPSHand thus the precession period,Pprec, of the accretion disk, but exactly twice this value. While there is no obvious reason why the system brightness should change with the precession period in this low inclination system a modulation with 2×Pprec is even more mysterious.
In an attempt to verify if similar variations related to Pprec occur in other systems exhibiting permanent superhumps as a first step towards an understanding, I observed a series of light curves of the novalike cataclysmic variable UU Aqr. This is an eclipsing system with an orbital period of 0.16580429 days (≈ 3h56m) (Baptista et al. 1994).
Patterson et al. (2005) observed a strong superhump in 2000 with a period of 4h12m. But note that in 1998 their observations yielded only marginal evidence for superhump-like variations. The orbital and superhump periods imply a precession period for the accretion disk of 3.12 days.
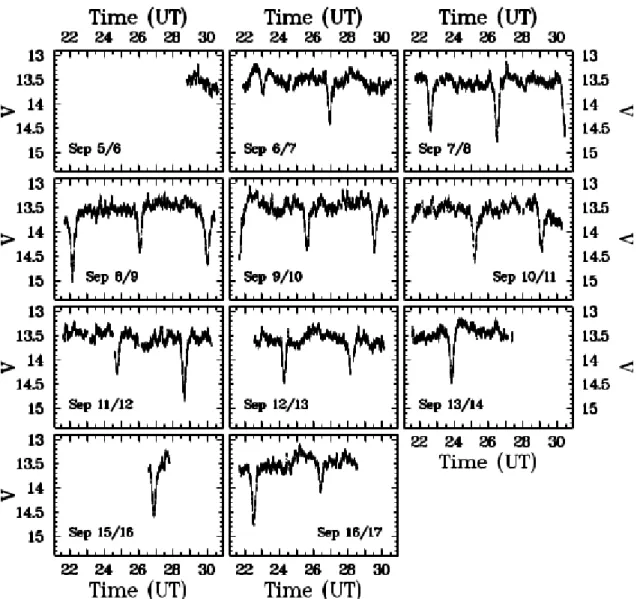
I used the 60 cm Boller & Chivens telescope of the Observat´orio do Pico dos Dias, Brazil, to observe UU Aqr in 11 nights between 2018, September 6 and 17. Light curves in unfiltered light spanning more than 8 hours in most of the nights were obtained at a time resolution of 5 sec. Synthetic aperture photometry of UU Aqr was performed on the original images (using a blue-sensitive IKon-L936-BEX2-DD CCD) after bias subtraction and flat-fielding, employing the MIRA software system (Bruch 1993). Magnitudes were measured relative to the primary comparison star #05 (Henden & Honeycutt, 1995;V = 13.804). For cataclysmic variables the throughput of the instrumentation corresponds roughly to V (Bruch, 2018). The light curves are shown in Fig. 1 where the time and magnitude scales are the same for all frames. Apart from eclipses they are characterized by rather strong flickering and modest variations on the time scale of hours which, however, exhibit no obvious regularity.
As an aside I draw attention to the strong variability of the eclipse depth which occurs even during subsequent cycles. This is particularly striking on September 6/7, where the eclipse close to UT 23 h hardly stands out in the light curve. Apparently, the secondary star in UU Aqr only partially covers the brighter parts of the primary and variations in the brightness of the central region of the accretion disk can strongly modulate the eclipse depth.
Turning now to the main purpose of the observations of UU Aqr, i.e., the investigation of a possible relationship between orbital, superhump and accretion disk precession period, I first masked the eclipses because they would dominate any period search algorithm. In order to remove any light travel time effects in the solar system, time was then transformed into barycentric Julian Dates on the Barycentric Dynamical Time scale, using the online tool of Eastman et al. (2010). Thereafter, all light curves were combined into a single data set. The result is shown in the upper frame of Fig. 2.
A power spectrum of the combined light curve was calculated using the Lomb-Scargle algorithm (Lomb 1976; Scargle 1982). The lower frame of Fig. 2 contains the resulting periodogram. Several peaks are visible, but none of them stands out among the others.
Moreover, the power spectra of subsets of all data do not contain significant signals at the same frequencies. Therefore, none of the peaks in the power spectra of the combined data indicates a stable period in UU Aqr. In particular, neither the orbital period nor the previously observed superhump period manifest themselves in the power spectrum.
The respective frequencies are marked by the blue and red vertical lines in the figure, respectively. The right hand inset contains a blown-up version of a small frequency range around 1/Porb and 1/PSH. It must therefore be concluded that the superhumps seen in
Figure 1. Light curves of UU Aqr observed in 11 nights in 2018 September, all drawn on the same time and magnitude scale.
4 IBVS6257
Figure 2. Top: The combined light curves of UU Aqr of 2018, September, after removal of eclipses.
The dots below the light curves represent the nightly averages of the magnitude difference between the primary comparison star and a check star. Bottom: Lomb-Scargle periodogram of the light curves shown in the upper frame. The broken vertical lines indicate the orbital (red) and previously observed
superhump frequency (blue). In inserts show blown up versions of a small part of the periodogram around the orbital and superhump frequencies (right) and of the low frequency part of the spectrum
(left), with some prominent peaks marked by vertical lines.
2000 by Patterson et al. (2005) have vanished. The absence of any signal at 1/Porb also indicates that apart from the eclipses UU Aqr does not exhibit orbital variations such as a an orbital hump – often seen in cataclysmic variables – caused by a hot spot at the location where the matter transferred from the secondary star hits the accretion disk.
The absence of superhumps turns the quest for variations related to the beat between orbit and superhump obsolete. Even so, the combined light curve (upper frame of Fig. 2) contains systematic night-to-night variations which apparently are not random. Their significance can be assessed through the behaviour of the comparison and check stars.
Since the nightly averages of the magnitude differences between the primary comparison star and 4 check stars revealed a slight (amplitude≤0.02 mag) systematic variation of the former, well approximated by a third order polynomial, a corresponding correction has been applied to all light curves. The comparison – check star light curves then becomes virtually flat. One of them is plotted (shifted in magnitude by an arbitrary constant) below the UU Aqr light curve in Fig. 2.
The long-term variations should reveal themselves also at the low frequency end of the power spectrum which is plotted at an enlarged scale in the left-hand inset of the figure.
The strongest peaks are marked by coloured vertical lines and correspond to periods of 3.966, 2.304 and 1.773 days. There is no obvious mutual relationship between these values or with the orbital or superhump period. Moreover, it is not straightforward to assess their statistical significance. Least squares sine fits with these periods yield half amplitudes of 0.042, 0.045, and 0.051 mag, respectively. The shorter periods do not reveal themselves intuitively to the eye. They are also not seen clearly in the power spectra of subsets of the data. However, trusting in the high capability of the human brain for pattern recognition, the reality of the ∼4 day period (red curve in the figure) is more convincing. While the data may not be sufficient to claim that this variation is really periodic and stable over time, it occurs on the same order of magnitude of the expected disk precession period if the superhumps were present. However, this may be a mere coincidence.
Concluding, I remark that in September 2018 UU Aqr did not exhibit superhumps and that these are thus not a permanent feature in the light curve of the system. This renders impossible the original purpose of this work, i.e., the investigation of brightness variations related to the precession period between the orbit and superhump periods. Nevertheless, UU Aqr exhibits systematic brightness variations on similar time scales, although the data do not permit a definite claim for their stability and repeatability.
Acknowledgements: This work is exclusively based on observations obtained at the Observat´orio do Pico dos Dias, maintained by the Laborat´orio Nacional de Astrof´ısica, a branch of the Minist´erio da Ciˆencia, Tecnologia, Inova¸c˜ao e Comunica¸c˜oes da Rep´ublica Federativa do Brasil.
References:
Arenas, J., Catal´an, M.S., Augusteijn, T., Retter, A., 2000, MNRAS, 311, 135 DOI Baptista, R., Steiner, J.E., Cieslinski, D., 1994, ApJ, 433, 332 DOI
Bruch, A. 1993, “MIRA: A Reference Guide”, Astron. Inst. Univ. M¨unster Bruch, A., 2018,New Astr., 58, 53 DOI
Bruch, A., Cook, L.M., 2018, New Astr., 63, 1 DOI
Eastman, J., Siverd, R., Gaudi, B.S., 2010, PASP,122, 935 DOI Henden, A.A., Honeycutt, R.K., 1995,PASP,107, 324 DOI
6 IBVS6257
Lomb, N.R., 1976, Ap&SS, 39, 447 DOI
Patterson, J., 1999, in S. Mineshige & C. Wheeler (eds.) “Disk Instabilities in Close Binary Systems”, Universal Academy Press, Tokyo, p. 61
Patterson, J., Kemp, J., Harvey, D.A., et al., 2005, PASP, 117, 1204 DOI Scargle, J.D., 1982, ApJ, 263, 853 DOI
Smak, J., 2009, Acta Astr.,59, 121 Smak, J., 2013, Acta Astr.,63, 369
Suleimanov, V., Bikmaev, I., Belyakov, K., et al., 2004, Astron. Lett., 30, 615 DOI Whitehurst, R., 1988, MNRAS, 232, 35 DOI
Yang, M.T.-C., Chou, Y., Ngeow, C.-C., et al., 2017,PASP,129, 4202 /DOI10.1088/1538- 3873/aa7a99