Volume 63 Number 6241 DOI: 10.22444/IBVS.6241
Konkoly Observatory Budapest
17 May 2018
HU ISSN 0374 – 0676
MULTICOLOR LIGHT CURVES AND PERIOD ANALYSIS OF IL Cnc
ALTON, K.B.
70 Summit Ave, Cedar Knolls, NJ, USA, email: kbalton@optonline.net Abstract
The spectral type and orbital period were estimated from multicolor (B, V and Ic) ccd-based photometric observations acquired in 2014 and 2018. Period analysis from eclipse timing differences indicate that no significant change in the orbital period 0.267656 d has occurred since 2003.
IL Cnc (V=12.m6; 08h55m51.s507 +20◦03′38.′′56 (epoch=J2000)) was first reported to be a W UMa-type variable star by Rinner et al. (2003) based on unfiltered ccd data.
Photometric data were also collected from this system during the ROTSE-I survey (NSVS;
Wo´zniak et al. 2004) and later captured by the ASAS Survey (Pojma´nski et al. 2005).
Sparsely sampled light curve data acquired over the time span between 1999 and 2005 were folded by period analysis. This report describes the results from the first multicolor (BVIC) ccd-based photometric study conducted on this variable target. The analysis of eclipse time differences (ETD) calculated from times-of-minima published in the literature and new data presented herein has resulted in an improved ephemeris for IL Cnc.
Time-series images were taken (90-sec) in 2014 with an SBIG ST-8XME CCD camera mounted at the Cassegrain focus of a 0.28-m catadioptric telescope. This f/6.4 instrument located in UnderOak Observatory (UO; NJ, USA) produces an image scale of 2.06′′/px (bin=2×2) and a field-of-view (FOV) of 17.5′×26.3′. Image acquisition (raw lights, darks, and flats) at UO was performed as described elsewhere (Alton 2016) and produced at least 282 values in each bandpass (B,V andIC). Similarly at Desert Bloom Observatory (DBO;
AZ, USA), an SBIG STT-1603ME CCD camera mounted at the Cassegrain focus of a 0.4-m catadioptric telescope was used for imaging IL Cnc in 2018. This f/6.8 instrument produces an image scale of 1.36′′/px (bin=2×2) and a FOV of 11.5′×17.2′. At DBO, image acquisition (75-sec) was performed using MaxIm DL Version 6.13 (Diffraction Limited) or TheSkyX Pro Version 10.5.0 (Software Bisque). This most recent imaging campaign pro- duced at least 235 individual photometric values in each bandpass. Both ccd cameras were equipped with B, V and IC filters manufactured to match the Johnson-Cousins-Bessell prescription. Calibration and registration of all images collected at UO and DBO were performed with AIP4Win v2.4.0 (Berry and Burnell 2005). Instrumental readings were reduced to catalog-based magnitudes using the reference MPOSC3 star fields (Warner 2007) built into MPO Canopus v10.7.1.3 (Minor Planet Observer). The 2014 and 2018 light curves (LC) used an identical ensemble of five non-varying comparison stars in the same FOV. The identity, J2000 coordinates and color index (B −V) of these stars are listed in Table 1. Only data from images taken above 30◦ altitude (airmass <2.0) were accepted in order to minimize error due to differential refraction and color extinction.
2 IBVS6241
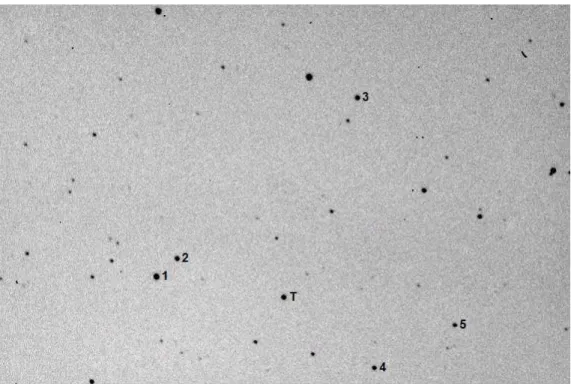
Table 1. FOV identity, name, coordinates and color index (B−V) for the target (T) and comparison stars (1-5) used for ensemble aperture photometry.
FOV Name α2000
.0 δ2000
.0 MPOSC3
Identity hh:mm:ss ◦ ′ ′′ (B−V)
1 GSC 01400-0523 08 56 04.26 +20 00 08.2 0.560 2 GSC 01400-0279 08 56 04.97 +20 01 06.8 0.711 3 GSC 01400-0330 08 56 11.63 +20 09 37.5 0.652 4 GSC 01400-0161 08 55 35.04 +20 05 05.6 0.588 5 GSC 01400-0406 08 55 34.19 +20 08 21.6 0.557
T IL Cnc 08 55 51.51 +20 03 38.6 0.983
Figure 1. Observed field-of-view for IL Cnc (T) obtained at UO. The comparison stars are marked according to the numbers (1-5) assigned in Table 1.
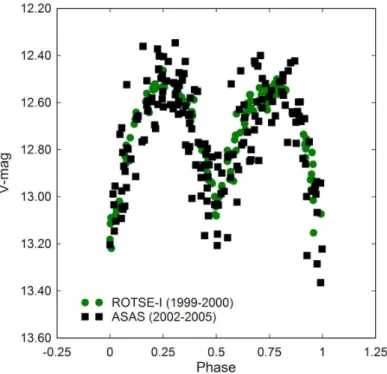
Sparsely sampled LC data from the ROTSE–I (1999–2000) and ASAS surveys (2002–
2005) were adjusted to the same average magnitude and subjected to period analysis using the ANOVA routine proposed by Schwarzenberg-Czerny (1996) and implemented within Peranso v2.5 (Vanmunster 2006). The period-folded (P = 0.267656±0.000009 d) results (Fig. 2) indicate that significant differences in the brightness at maximum and minimum light can occur.
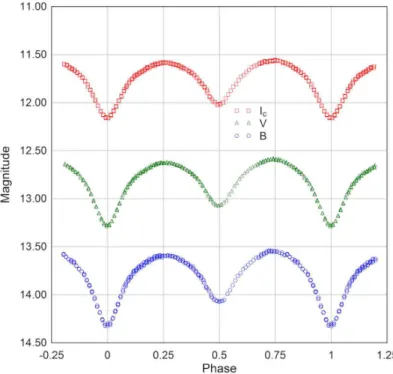
Photometric data from 2014 (Fig. 3) and 2018 (Fig. 4) could be folded using an identical period solution (0.267656±0.000001 d) derived by Fourier analysis (FALC; Harris et al.
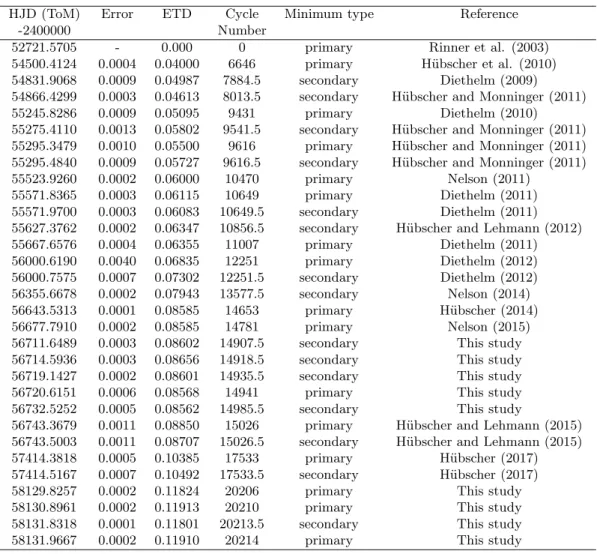
1989). This period was independently verified using ANOVA (Schwarzenberg-Czerny 1996). Nine new times-of-minima (ToM) were calculated using the method of Kwee and van Woerden (1956). A mean ToM value was calculated for each night time session since no obvious color dependency (BVIC) was observed. These are summarized in Table 2 along with other published ToM values dating back to 2003. Cycle number and ETD values were calculated from the reference ephemeris (Rinner et al. 2003) where:
HJ D0 = 2452721.5705 + 0.d26765×E.
Figure 2. Folded (P = 0.267656±0.000009 d) light curves (V-mag) for IL Cnc produced from the ROTSE–I and ASAS Surveys.
Regression analysis of the ETD values calculated from all the observed and predicted minimum times versus the period cycle number produced a straight-line relationship in- dicating that the orbital period for this system does not appear to have substantially changed since 2003 (Fig. 5). These data lead to an improved linear ephemeris:
HJ D = 2458131.9657(9) + 0.2676559(1)×E.
It is clear from the steep slope of the ETD vs. epoch plot represented in Fig. 5, that the initial estimate for the orbital period (P=0.26765 d) was not sufficiently accurate, otherwise the data would have fallen on a line nearly parallel to the x-axis. If one were to substitute the improved value (P=0.2676559 d) for the original value reported by Rinner et al. 2003, then the resulting linear fit would illustrate this effect (Fig. 6). Since all but the first value represents data collected over a relative short time span (≈10 y), it is far too early to establish whether some underlying periodicity may remain hidden in the data.
Additional ToMs will be necessary to more thoroughly examine the secular behavior of this system.
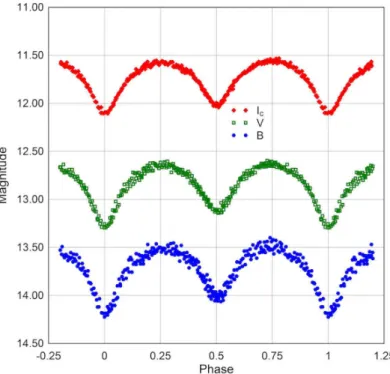
The multicolor LCs (BVIC) for IL Cnc shown in Fig. 3 (2014) and Fig. 4 (2018) exhibit a shape characteristic of an eclipsing W UMa-type binary system. Peak asymmetry is observed in the 2018 LCs during maximum light such that Max II>Max I whereas not as much difference was observed at quadrature in 2014. This behavior, also called the O’Connell effect (O'Connell 1951), is generally attributed to hot or cold spots which can be large enough to affect the brightness in localized regions of either star. W UMa-type overcontact systems are well known to be photospherically active and from year-to-year can show large differences in maximum and minimum light. LC data collected from IL Cnc during the ASAS Survey dramatically illustrate this effect particularly during Min I and Max II (Fig. 2). No high resolution classification spectrum is available for IL Cnc, however an estimate from (B–V) and (V–IC) color indices generated from the new LCs herein
4 IBVS6241
Table 2. Eclipse time differences (ETD) calculated from published times-of-minima for IL Cnc along with eight new values reported for the first time in this study.
HJD (ToM) Error ETD Cycle Minimum type Reference
-2400000 Number
52721.5705 - 0.000 0 primary Rinner et al. (2003)
54500.4124 0.0004 0.04000 6646 primary H¨ubscher et al. (2010) 54831.9068 0.0009 0.04987 7884.5 secondary Diethelm (2009) 54866.4299 0.0003 0.04613 8013.5 secondary H¨ubscher and Monninger (2011) 55245.8286 0.0009 0.05095 9431 primary Diethelm (2010) 55275.4110 0.0013 0.05802 9541.5 secondary H¨ubscher and Monninger (2011) 55295.3479 0.0010 0.05500 9616 primary H¨ubscher and Monninger (2011) 55295.4840 0.0009 0.05727 9616.5 secondary H¨ubscher and Monninger (2011) 55523.9260 0.0002 0.06000 10470 primary Nelson (2011)
55571.8365 0.0003 0.06115 10649 primary Diethelm (2011) 55571.9700 0.0003 0.06083 10649.5 secondary Diethelm (2011) 55627.3762 0.0002 0.06347 10856.5 secondary H¨ubscher and Lehmann (2012) 55667.6576 0.0004 0.06355 11007 primary Diethelm (2011) 56000.6190 0.0040 0.06835 12251 primary Diethelm (2012) 56000.7575 0.0007 0.07302 12251.5 secondary Diethelm (2012) 56355.6678 0.0002 0.07943 13577.5 secondary Nelson (2014) 56643.5313 0.0001 0.08585 14653 primary H¨ubscher (2014) 56677.7910 0.0002 0.08585 14781 primary Nelson (2015) 56711.6489 0.0003 0.08602 14907.5 secondary This study 56714.5936 0.0003 0.08656 14918.5 secondary This study 56719.1427 0.0002 0.08601 14935.5 secondary This study
56720.6151 0.0006 0.08568 14941 primary This study
56732.5252 0.0005 0.08562 14985.5 secondary This study
56743.3679 0.0011 0.08850 15026 primary H¨ubscher and Lehmann (2015) 56743.5003 0.0011 0.08707 15026.5 secondary H¨ubscher and Lehmann (2015) 57414.3818 0.0005 0.10385 17533 primary H¨ubscher (2017) 57414.5167 0.0007 0.10492 17533.5 secondary H¨ubscher (2017)
58129.8257 0.0002 0.11824 20206 primary This study
58130.8961 0.0002 0.11913 20210 primary This study
58131.8318 0.0001 0.11801 20213.5 secondary This study
58131.9667 0.0002 0.11910 20214 primary This study
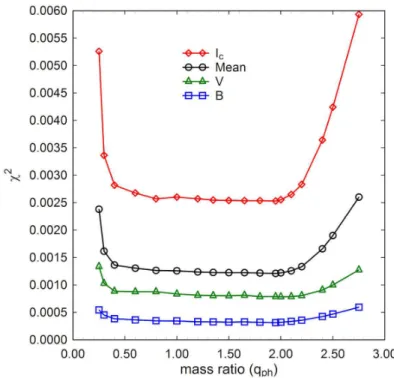
and those reported by four other surveys (USNO-B1, 2MASS, SDSS-DR9 and UCAC4) cataloged in VizieR (Lasker et al. 1996) suggests that it is an early K type system. This assignment is supported by a recent publication (Qian et al. 2017) in which low resolution (R ≈ 1800) spectra were obtained from over 7900 stars; therein IL Cnc is classified as a main sequence K3 system. Nonetheless, additional high resolution spectroscopic data may be required to unequivocally classify this system. Attempts to model these data with PHOEBE 0.31a (Prˇsa and Zwitter 2005), a GUI front-end to the Wilson-Devinney code (Wilson and Devinney 1971), failed to produce a unique solution for the mass-ratio since IL Cnc only exhibits a partial eclipse (i ≈ 74◦). As such any photometric solution will suffer from degeneracy while trying to simultaneously optimize orbital inclination (i) and mass-ratio (qph) unless there is a total eclipse (Terrell and Wilson 2005). This behavior is manifestly confirmed (Fig. 7) during a procedure called “q-search” or “grid-search” to find a best value for the mass-ratio. Essentially q is incrementally changed within a fixed interval during Roche modeling while the orbital inclination (i), surface potential of the primary (Ω1) and effective temperature of the secondary (T2) were allowed to vary during optimization by differential corrections to minimize χ2. As can be seen (Fig. 7) there is essentially no meaningful difference in the curve fits when qph varies between 1.5 and 2.
In this case it is evident that radial velocity data will be necessary to produce an accurate mass-ratio and Roche model for IL Cnc.
In summary, LC and eclipse timing data for IL Cnc has revealed a W UMa-type sys- tem in which the orbital period has not meaningfully changed since 1999. A preliminary classification of IL Cnc based on color index (B–V) and (V–IC) and low resolution spec- troscopic data suggests that the primary component is an early K-type star. A comparison of LCs produced from photometric data collected during the ROTSE-I and ASAS surveys along with those new data reported herein suggest that IL Cnc has an active photosphere like most other overcontact binary systems possessing a strong magnetic dynamo. Due to limitations imposed by a partial eclipse, it is not possible to derive a reliable value for the mass-ratio for this system without supporting radial velocity data.
Figure 3. Folded (P = 0.267656±0.000001 d) light curves (BVIC) for IL Cnc produced at UnderOak Observatory in 2014
Acknowledgments: This research has made use of the SIMBAD and VizieR databases, operated at Centre de Donn´ees astronomiques de Strasbourg, France. In addition, the International Variable Star Index maintained by the AAVSO, the ASAS Catalogue of Variable Stars and the Northern Sky Variability Survey were mined for valuable informa- tion. The diligence and dedication of all associated with these organizations is greatly appreciated. Many thanks to the anonymous referee who provided valuable feedback on this report.
6 IBVS6241
Figure 4. Folded (P = 0.267656±0.000001 d) light curves (BVIC) for IL Cnc produced at Desert Bloom Observatory in 2018
Figure 5. Linear ephemeris for IL Cnc determined from eclipse timing differences observed between 2003 and 2018 using the period (P = 0.26765d) defined by Rinner et al. 2003
Figure 6. Linear ephemeris for IL Cnc determined from eclipse timing differences observed between 2003 and 2018 using the improved value for orbital period (P = 0.2676559±0.0000001d)
Figure 7. Results from q-search illustrating failure to find a unique value for the photometric mass-ratio (qph) where the best LC model fit reaches a distinct minimum error (χ2)
8 IBVS6241
References:
Alton, K.B., 2016, JAAVSO, 44, 87
Berry, R. and Burnell, J., 2005, The Handbook of Astronomical Image Processing, 2nd Ed, Richmond VA, Willmann-Bell
Diethelm, R., 2009, IBVS, 5959 Diethelm, R., 2010, IBVS, 5945 Diethelm, R., 2011, IBVS, 5992 Diethelm, R., 2012, IBVS, 6029
Harris, A.W., Young, J.W., Bowell, E., et al., 1989, Icarus, 77, 171 DOI H¨ubscher, J., 2014,IBVS,6118
H¨ubscher, J., 2017,IBVS,6196 DOI
H¨ubscher, J. and Lehmann, P.B., 2012, IBVS,6026 H¨ubscher, J. and Lehmann, P.B., 2015, IBVS,6149
H¨ubscher, J., Lehmann, P.B., Monninger, G., et al., 2010, IBVS, 5918 H¨ubscher, J. and Monninger, G., 2011, IBVS,5871
Kwee, K.K. and Woerden, H. van, 1956, BAN, 12, 327
Lasker, B.M., Sturch, C.R., Lopez, C., et al., 1996,VizieR Online Data Catalog, Version 1.1
Nelson, R.H., 2011,IBVS,5966 Nelson, R.H., 2014,IBVS,6092 Nelson, R.H., 2015,IBVS,6131
O’Connell D.J.K., 1951, Pub. Riverview College Obs., 2, 85
Qian, S.-B., He, J.-J., Zhang, J., et al., 2017, Research in Astron. Astrophys., 17, 087 DOI
Pojma´nski, G., Pilecki, B., Szczygiel, D., 2005, AcA, 55, 275 Prˇsa, A., and Zwitter, T., 2005, ApJ, 628, 426 DOI
Rinner, C., Starkey, D. Demeautis, Ch., et al., 2003, IBVS,5428 Schwarzenberg-Czerny, A., 1996, ApJ, 460, L107 DOI
Terrell, D. and Wilson, R.E., 2005, ApSS, 296, 221 DOI
Vanmunster, T., 2006,Peranso v2.5, Perios Analysis Software, CBA Belgium Observatory Warner, B. 2007,Minor Planet Bulletin, 34, 113
Wilson, R. E. and Devinney, E. J., 1971, ApJ, 166, 605 DOI
Wo´zniak, P.R., Vestrand, W.T. Akerlof, C.W., et al., 2004, AJ, 127, 2436 DOI