EVOLUTION OF THE INTERPRETATION OF POVERTY IN HUNGARY BETWEEN 2007 AND 2019
Eszter Siposné Dr Nándori1
ABSTRACT: The author applies the cultural consensus model to the domain of poverty and investigates the subjective interpretation of poverty. Inglehart’s modernization hypothesis is tested in a peripheral county in Hungary through the interpretation of poverty. The results of data collection in 2019 are compared to the results of two similar surveys from 2007 and 2011. The finding is that consensus theory proves to be adequate for examining the public interpretation of poverty.
The paper concludes that poverty is mainly linked to material values and that the values of the adult population did not change significantly from 2007 to 2019. This time period was probably not long enough to modify the basic values of the adult population and the subjective interpretation of poverty.
KEYWORDS: interpretation of poverty, systematic data collection, value change, Hungary
INTRODUCTION
The paper examines how the interpretation of poverty changed from 2007 in Borsod-Abaúj-Zemplén County, one of the poorest areas in Hungary, and how this is linked to the hierarchy of human goals. The examined period includes the global economic crisis and the subsequent recovery. The research work aims at revealing the changes in the interpretation of poverty that happened during these times of remarkable economic change.
1 Eszter Siposné Dr Nándori is associate professor at Institute of World and Regional Economics, University of Miskolc, Hungary – email: stsne@uni-miskolc.hu. Support received from Tempus Public Foundation gratefully acknowledged.
The paper aims at testing the validity of the modernization hypothesis, put forward by Inglehart (2000), in relation to the interpretation of poverty. It examines whether there were any changes in the value priorities in the examined period. According to Inglehart’s scarcity hypothesis, if a significant part of the population experiences existential insecurity, material values take priority.
When, however, the satisfaction of basic human needs can be taken for granted, post-materialist values become dominant. According to the socialization hypothesis (Inglehart 2000), value changes are possible only in the long term, as the value priorities of adults hardly ever change.
The novelty of the current research is its methodology. It uses cultural consensus theory and the methods of systematic data collection to obtain information about the interpretation of poverty. Consensus theory in cultural anthropology is used to estimate the knowledge shared among informants in relation to the domain of interest (Webster et al. 2002). The methods of the systematic collection of data take into account the cultural competence of the population, which can contribute to a remarkable decrease in the sample size that is necessary, while the reliability of the research results remain high.
Moreover, these methods do not use predefined attributions about the specific field, but informants are first asked to list items they associate with poverty.
This ensures that the items to be used in the last step of the data collection are culturally relevant.
Another novelty of the research is that it covers a period of over a decade and makes the examination of changes in the interpretation of poverty since 2007 possible. Statistics on income and living conditions (EU-SILC) of the European Union refer to similar topics (like life satisfaction and income level), but focus on individuals’ beliefs about their own position instead of their interpretation of poverty.
I first describe theories about the relationship between economy and culture and give a short overview of the socio-economic conditions of Borsod-Abaúj- Zemplén County. I next outline the procedure for collecting data in 2019. I then present the main features of the interpretation of poverty in Borsod- Abaúj-Zemplén County in 2019, make a comparison over time, and discuss the implications of my findings.
THEORETICAL BACKGROUND
The relationship between economy and culture
Experts have long debated the relationship between economic conditions and cultural values. Mainstream economics argues that they are independent of each other. Another approach argues that cultural values change with economic development (DiMaggio 1994). Three different theories are associated with this approach: economic materialism, cultural determinism, and modernization theory (Havasi 2009).
Economic materialism argues that economic relations take priority, and they determine the value system (Clark 1998). This implies that acquiring material possessions is the main goal of human life and the key to happiness. Success is determined by individuals’ material wealth and the material goods they can acquire (Richins 1994). Contrarily, cultural determinism implies that culture determines economic and political arrangements. Weber (1979) argues that the Protestant ethic contributed to the development of capitalism, to many people starting to work in the secular world, and to wealth being obtained. Modernization theory argues that economic and cultural changes are intercorrelated. This implies that “economic development is linked with coherent and, to some extent, predictable changes in culture” (Inglehart–Baker 2000: 21).
Evidence from the World Value Surveys supports the claim that economic development is associated with major changes in value systems (Inglehart–
Baker 2000). Inglehart and Baker (2000) measured economic development using annual per-capita gross national product and survival/self-expression (linked with the rise of the service economy) and traditional/secular dimensions (associated with the transition from agricultural societies to industrial societies).
Inglehart (2000) argued that individuals in advanced societies with significant economic growth have given priority to post-materialist values (like the need for self-actualization or self-expression). He distinguishes between scarcity and socialization hypotheses regarding the relationship between economy and culture.
The scarcity hypothesis is an interpretation of Maslow’s hierarchy of human goals and the law of diminishing marginal utility. It implies that as long as the satisfaction of basic human needs cannot be taken for granted and scarcity prevails, materialist needs, which are biological requirements for survival, take priority. These needs, directly related to human survival – like the satisfaction of hunger, thirst, the need for rest, shelter, sustenance, or physical security – are more pressing than post-materialist values, unless they are satisfied. When material needs are satisfied, however, priority will
be given to post-material needs like belonging, intellectual satisfaction, recognition, self-expression, personal freedom, self-esteem, or protecting the environment.
Financial conditions and value priorities, however, do no adjust to each other immediately. According to Inglehart (2000)’s socialization hypothesis, the adjustment of cultural values to socio-economic conditions needs some time and is not possible in the short term because the basic values of adults are largely fixed. Cohorts that have often experienced scarcity award high priority to material values (basically related to psychological needs and safety needs), while cohorts that have experienced economic boom conditions consider post- materialist values to be more important. The basic values of individuals are determined by the circumstances that they experienced before their becoming adults. Cohorts that grow up among good economic conditions will have post-materialist values (Inglehart 2000). The value priorities of adults do not change significantly; therefore, changes in value priorities are possible only intergenerationally. A new generation needs to grow up to make value changes possible (Rokeach 1968). Duch and Taylor (1993) also concluded that whether the satisfaction of material needs can be taken for granted during an early period of an individual’s life has a strong and long-lasting influence on post-materialist attitudes later in life.
Siposné Nándori (2016) concluded that, except for some slight changes in the subjective interpretation of poverty (demographic circumstances became less important, while financial conditions became more relevant from 2007 to 2011), the value priorities of the adult population did not change from 2007 to 2011, thus the basic nature of the interpretation of poverty among residents of Borsod-Abaúj-Zemplén County, remained unchanged. The fact that the time period between 2007 and 2011 was not long enough to modify the value priorities of the adult population and the interpretation of poverty supports the socialization hypothesis. The covered time period, however, might have been too short. Extending the time frame of the analysis by adding results from 2019 might make it possible to examine the value changes of adults.
Money-metric and subjective poverty
As described above, Inglehart (2000) concluded that value priorities are linked to material conditions. One’s financial condition can be described by money- metric measures of poverty, among other ways. Absolute concepts of poverty assume that the basic necessities of life are independent of space and time. Poor people are those who are not able to satisfy their basic needs. This definition
makes it possible to make a comparison of poverty across countries or over time. Another way of measuring poverty is to use relative poverty indicators.
Relative concepts of poverty define the poor as individuals whose income level is a defined percentage below some relative poverty threshold, such as below 60% of the median income level. The relative poverty threshold can also be defined as an income level below which a certain part (e.g. one-tenth or one- fifth) of the population live (Hegedűs–Monostori 2005).
Values can translate living conditions into subjective well-being (Campbell et al. 1976; Diener 1995; Delhey 2004) and into the interpretation of poverty.
Existential security changes value priorities, and therefore the public perception of poverty.
Value priorities can be reflected by interpretations of poverty, which is one form of subjective poverty (Spéder 2002). The latter refers to which individuals people consider poor, and how people define poverty. The other form of subjective poverty is associated with individuals’ beliefs about their own position in the system of inequalities, and their perceptions of their own material situation.
The socioeconomic position of Borsod-Abaúj-Zemplén County
Borsod-Abaúj-Zemplén County is situated in Northern Hungary. The bulk of its settlements belong to peripheral backward areas (Pénzes 2014). The county is faced with multiple disadvantages. It has a low ability to retain its population. The high rate of emigration is due to an adverse labor market and income positions and the lack of prospects (G. Fekete et al. 2013). The unfavorable socioeconomic position of the county is reflected in its labor market characteristics as well.
The unemployment rate has been higher than the national average for several decades.
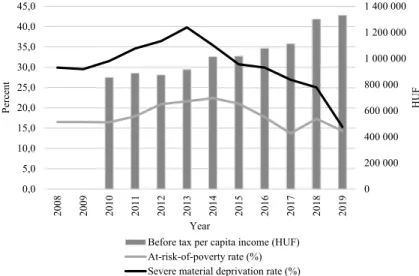
In relation to poverty (refer to Figure 1), both the at-risk-of-poverty rate (the proportion of persons with a disposable income below the risk-of-poverty threshold, which is set at 60% of the national median disposable income) and the severe material deprivation rate increased after the financial crisis of 2008.
However, both measures have decreased since 2013, reaching their current value of around 15% in 2019. Disposable per-capita income has increased since 2010.
The evolution of these measures suggests that Borsod-Abaúj-Zemplén County’s economy has fully recovered from the financial crisis.
Figure 1. Selected poverty measures and before-tax per-capita income (Hungarian forints) in the Northern Hungarian region, 2008–2019
Source: Author’s compilation based on data from Eurostat and the Hungarian Central Statistical Office (HCSO).
RESEARCH QUESTIONS AND METHODOLOGY
The paper aims at analyzing changes in the interpretation of poverty since 2007 in Borsod-Abaúj-Zemplén County, Hungary. It examines how the list of poverty-related items perceived by the population changed from 2007 to 2019. It also examines how the perceptions of precise meanings of poverty-related items changed over time.
Based on the scarcity hypothesis, the importance of material aspects of poverty might have changed in the examined period. During the crisis years (between 2007–2011) it might be expected that material aspects of poverty would have become more important, while during the recovery period (2011–2019) material aspects of poverty could have been expected to decline in importance.
The analysis compares the subjective assessment of poverty in three surveys (2007, 2011, and 2019) and reveals changes over time.
0 200 000 400 000 600 000 800 000 1 000 000 1 200 000 1 400 000
0,0 5,0 10,0 15,0 20,0 25,0 30,0 35,0 40,0 45,0
2008 2009 2010 2011 2012 2013 2014 2015 2016 2017 2018 2019 HUF
Percent
Year
Before tax per capita income (HUF) At-risk-of-poverty rate (%) Severe material deprivation rate (%)
The primary data collection effort of 2019 was carried out in order to:
– obtain knowledge about the interpretation of poverty in Borsod-Abaúj- Zemplén County and,
– enable comparison over time using the results of two similar surveys from 2007 and 2011.
The first step was to define the public interpretation of poverty. Using qualitative research methods, the items most often related to poverty and their precise perceived definitions were determined. Interviews were first conducted to elicit a list of poverty-related items using the method of free listing. In the other part of the interviews, informants were asked to rank these items to identify those most closely/most often related to poverty, and to describe their perceived precise meaning. As ranking a large number of items can be difficult and take a lot of time, consensus theory and the method of systematic data collection were used to simplify the task, therefore reducing the time required for data collection. Formal methods of systematic data collection (like quicksort, balanced incomplete block designs, and rating scales) can contribute to increasing the understanding of experimental and observational data (Weller–
Romney 1988). These methods are also applied because they make comparison over time possible, as the interpretation of poverty was also examined with these methods in Wave 1 and Wave 2 (for details, refer to Siposné Nándori (2011;
2016)).
Consensus theory, used mainly by cultural anthropologists, is applied to answer research questions when the investigator does not know the answers to questions ahead of time (Weller 2007). It has been used in a variety of fields like with judgements of personality (Webster et al. 2002), disease classification (Romney et al. 1986), beliefs about occupational prestige (Romney 1989), beliefs about plants (Boster 1983), and illnesses (Pachter et al. 2002; Weller et al. 1999).
Consensus theory in cultural anthropology is used to determine the number of informants necessary for obtaining reliable answers. It uses the degree of agreement among informants and provides an estimate of cultural competence (“culturally correct answers”), which is the probability that the informants know the answer to a given question. Cross et al. (1989: 4) defines cultural competence as “a set of congruent behaviors, attitudes, and policies that come together in a system, agency, or among professionals and enable that system, agency, or those professionals to work effectively in cross-cultural situations.” The latter study focuses on that part of the culture that is stored in the minds of its members (Roberts 1964; Siposné Nándori 2016) and adopts the methodological tools from cultural anthropology.
Consensus theory makes the reconstruction of “culturally relevant” answers to a specific question possible (Romney et al. 1986) and provides an estimate for the degree to which individuals know this answer (Weller 2007). It is assumed that agreement between the answers of any two informants is a function of the extent to which each is correlated with the culturally correct answers (Nunally 1978).
According to consensus theory, the number of respondents necessary for obtaining reliable results depends on the average level of competence, the confidence level, and a minimum rate of questions that should be classified correctly (Weller–Romney 1988). Consensus theory makes the following three assumptions:
There should be a high level of agreement in the responses of informants (the average level of competence should be at least 0.5).
– Each informant should provide answers independently of others. This is made possible by eliciting answers from individuals, not from groups of people.
– Each question should be in the same domain of interest and at the same level of difficulty (Weller 2007).
Free listing
The first step of a study is understanding what is being studied. Free listing is an appropriate technique for collecting data about the domain of interest and ensuring that the items used in the final research step are culturally relevant (Weller–Romney 1988). Informants are asked to list all the items that come to mind in relation to a topic. In this study, free listing was used to obtain a list of poverty-related items for use in the final research step.
At the beginning, the following questions were asked:
– Who do you think is poor today in Hungary?
– Do you know any poor people?
– What makes you think they are poor?
Based on the informants’ answers, further questions were asked, when necessary, to elicit as many poverty-related items as possible.
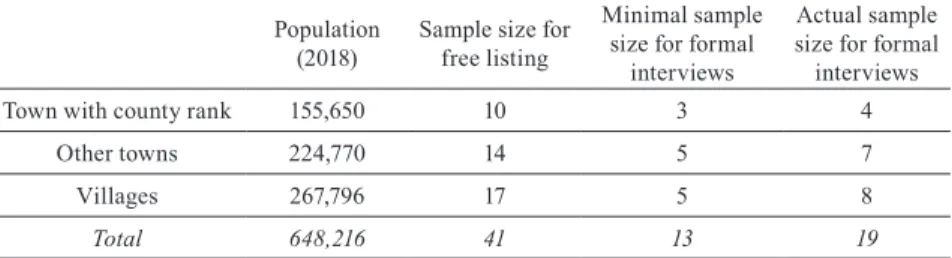
The minimum number of informants involved in free listing depends on the amount of agreement in the responses of the informants, and cannot be less than 30 (Weller 2007). During free listing in this study, stability of order was found at around 40 informants, so a sample of 41 was drawn. For this, multistage sampling with stratification was applied. First, Borsod-Abaúj-Zemplén County
was divided into three parts: town with county rank (the city of Miskolc belongs to this category), other towns, and villages. The sample was drawn to respect the share of the population in the three categories (Table 1). Informants were selected using the random walk method from Miskolc, two randomly selected towns (Ózd and Felsőzsolca), and three randomly selected communities (Tiszalúc, Ároktő, and Bükkaranyos).
Table 1. Sample decomposition based on the distribution of the population of Borsod- Abaúj-Zemplén County, Hungary
Population
(2018) Sample size for free listing
Minimal sample size for formal
interviews
Actual sample size for formal
interviews
Town with county rank 155,650 10 3 4
Other towns 224,770 14 5 7
Villages 267,796 17 5 8
Total 648,216 41 13 19
Source: Author’s compilation based on HCSO data.
Free listing elicited a total of 45 items. Out of these, 21 were chosen for further research, taking into consideration the purpose of the study, the frequency of the items mentioned in the free listing,2 and the type of formal data collection applied (De Munck–Sobo 1998; Siposné Nándori 2016). The items selected for further research can be seen in Table 2.
Table 2. Items selected for further research based on free listing results (in alphabeti- cal order)
1. Addiction (drugs, alcohol) 2. Debt
3. Illness
4. Integration problems, discrimination 5. Isolation 6. Lack of savings 7. Large family
8. Low education level 9. Low income level 10. Low willingness to work 11. Macroeconomic problems 12. Malnutrition
13. No access to basic needs 14. Poverty cycle
15. Problems with clothing 16. Problems with shelter 17. Public work scheme
participation 18. Retirement 19. Roma ethnicity 20. Unemployment 21. Unfavorable mentality Source: Author’s compilation.
2 Items mentioned by fewer than five informants were excluded from the final research step.
Defining the sample size for formal interviews
Based on the list elicited by free listing, the sample size needed for further research can be defined using the guidelines of cultural consensus theory. Boster (1983) estimated that the competency for dichotomous variables is equal to the average proportion of matches across individuals. In this case, free listing is considered as a list of dichotomous variables. A value of one indicates that the given item was mentioned, while zero indicates that it was not mentioned by the given informant.
Using these binary codes, it is possible to determine the proportion of matches across each pair of individuals (Boster 1983; Siposné Nándori 2016).
Weller (2007) draws attention to the importance of differentiating among strong beliefs and random answers that do not imply any cultural preferences.
This is necessary because random answers should not be taken into consideration when defining the average competence level of the informants. A binomial test is appropriate for testing whether cases of dichotomous variables indicate deviation from chance. The binomial test assumes that the product of the probability of an outcome (p) and the sample size (n) is at least ten in the case of both outcomes, i.e.
p x n > 10 (1)
q x n > 10 (2)
where q = 1 – p.
Provided that the hypothesis tests whether the answers differ significantly from 0.5, p = 0.5. The sample size (n) is equal to 41, so
p x n = 0.5 x 41 = 20.5 > 10 (3) Because the assumption is met, a Z-test can be used to test the hypothesis.
Z-values and decisions about the hypothesis (whether answers indicate a strong belief or not) for each item selected for further research are summarized in Table 3.
Out of the 21 examined items, the answers for questions related to five items (unemployment, problems with shelter, malnutrition, no access to basic needs, and illness) do not indicate any strong beliefs; therefore, they were excluded when defining the average competence level of the informants.
Boster (1983)’s methodology is used to find the informants’ average competence (reliability). First, the proportion of matches across each pair of individuals needs to be determined. Then, the arithmetic mean of these values gives the average proportion of matches across individuals. Its value is 0.688.
Provided that it exceeds 0.5, sample size can be determined using consensus theory. The two further assumptions of consensus theory are also met, as the informants were asked separately so they could not discuss their responses before answering, and all of the questions were about poverty, therefore each question deals with the same field of interest.
Table 3. Z-scores and decisions about the hypothesis concerning whether the answers indicate strong beliefs
Poverty-related item Z-score Decision
Low income level 1.7 Failed to be rejected
Unemployment 0.5 Rejected
Problems with shelter 0.2 Rejected
Malnutrition –0.5 Rejected
No access to basic needs –0.5 Rejected
Illness –0.5 Rejected
Unfavorable mentality –3.0 Failed to be rejected
Low education level –3.0 Failed to be rejected
Retirement –3.9 Failed to be rejected
Problems with clothing –3.9 Failed to be rejected
Isolation –3.9 Failed to be rejected
Addiction (drug, alcohol) –4.2 Failed to be rejected
Macroeconomic problems –4.2 Failed to be rejected
Debt –4.2 Failed to be rejected
Low willingness to work –4.2 Failed to be rejected
Poverty cycle –4.5 Failed to be rejected
Large family –4.5 Failed to be rejected
Public work scheme participation –4.5 Failed to be rejected Integration problems, discrimination –4.5 Failed to be rejected
Lack of savings –4.5 Failed to be rejected
Roma ethnicity –4.8 Failed to be rejected
Source: Author’s compilation.
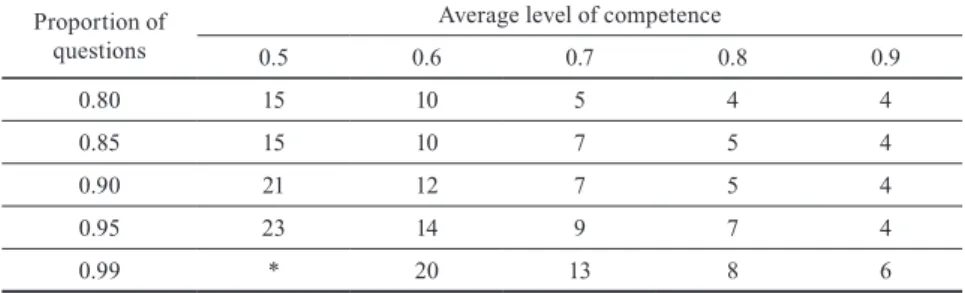
The average level of competence is nearly 0.7. At least 99% of the questions should be classified correctly at the 0.99 confidence level, therefore the minimum number of informants is 13 (Table 4).
Table 4. Minimum sample size needed to classify a desired proportion at the 0.99 con- fidence level for different levels of competence
Proportion of questions
Average level of competence
0.5 0.6 0.7 0.8 0.9
0.80 15 10 5 4 4
0.85 15 10 7 5 4
0.90 21 12 7 5 4
0.95 23 14 9 7 4
0.99 * 20 13 8 6
*Well over 30 informants needed Source: Weller–Romney (1988: 77)
Informants were selected with the method of multistage cluster sampling with stratification (Maxfield–Babbie 2009) in the same way as for free listing. Three informants were selected from Miskolc, and the randomly selected town was Sárospatak, where five informants were asked. This time, the randomly selected villages were Bogács and Alacska where five individuals were selected (Table 1).
During the survey, more informants were reached than necessary, resulting in a total sample size of 19.
Formal interviews
During the formal interviews, each informant was asked the same set of questions. The primary data collection phase had two aims: to find out…
(1) what factors are thought to be related to poverty, and (2) the precise perceived meanings of these factors.
To find the answer to the first question, the quicksort method was used. This is a kind of rank-order method. Items written on cards are randomized and then a card is selected as a standard. Informants are then asked to compare all other items to the standard and group them into two categories: items greater than and those less than the standard. This process is repeated for each group until all items are ordered. This method shortens the ordering task and makes comparison easier (Weller–Romney 1988; Siposné Nándori 2016). In the current survey, quicksort was used to rank poverty-related items according to the extent to which they are related to poverty.
To find the perceived precise meanings of the items, where there can be ambiguity, rating scales are used. These are usually expressed as four-to-eleven-
point scales. Their reliability increases with the larger the number of points that they have (Weller–Romney 1988), therefore scales with as many points as possible were created.
Free listing was conducted between July and September 2019, while formal interviews took place during October – December 2019.
RESULTS
The interpretation of poverty and its change over time
Poverty-related items mentioned by the informants in free listing in 2007, 2011, and 2019 are listed in Figure 2. “Unemployment” was among the top three items in each survey and “low willingness to work” was among the top two items in 2011 and 2019. It can be concluded that labor-market-related items did not become less important in the examined period. “Low income level,” while mentioned in first place in 2007 and third place in 2011, ranked only sixth in 2019.
“No access to basic needs” and “poverty cycle” did not change in importance much since 2011 (ranked at seventh and ninth). “Addiction” (mentioned as alcoholism and smoking in 2007) became less closely related to poverty, as it fell from sixth place to tenth place. Five further items were mentioned in all the three surveys. “Low education level” moved from rank 9 to 5 and then back to 8.
“Unfavorable mentality,” including hopelessness and the lack of prospects, was always situated is the second part of the list (ranking 11, 15 and 14 in the three surveys respectively) and the same applies to “isolation” with rankings 17, 17 and 21 in the surveys. “Illness” became less closely related to poverty from 2007 to 2011 (falling from fifth to fourteenth place) and remained almost at the same place (ranking 15) in 2019. “Large family” became less closely related to poverty, falling from tenth and twelfth place in 2007 and 2011 to nineteenth place in 2019. The other family and child-rearing items mentioned in 2007 (“single parent,” “early founding of family,” and “child benefit”) were not listed in 2011 or and in 2019.
Some items were mentioned only in 2011 and 2019. “Having debt” had the same (fourth) position in both years, “macroeconomic problems” had almost the same position (sixteenth and seventeenth), while “integration problems” and the “lack of savings” became less closely related to poverty (the former fell from thirteenth to sixteenth place and the latter fell from tenth to eighteenth place). “Roma descent” and “retirement” were mentioned in relation to poverty in 2007 and 2019. The former one fell from second place to fifth place, while
“retirement” fell from sixteenth to twentieth place. Four items were mentioned only in 2019. “Malnutrition,” “poor clothing,” and “problems with shelter” were probably included in “no access to basic needs” in 2011. In 2019, however, these items were mentioned separately. “Public work” was also first mentioned in the last survey, even though this kind of employment existed in Hungary as early as in 2007.
Figure 2. Rank order of poverty-related items in 2007, 2011, and 2019 (a score of 1 refers to the item most often related to poverty)
Source: Author’s compilation.
0 5 10 15 20 25
Unemployment Low willingness to work Malnutrition Debt Roma ethnicity Low income level No access to basic needs Low education level Poverty cycle Alcoholism Smoking Public work scheme participation Poor clothing Problems with shelter Unfavorable mentality Illness Integration problems, discrimination Macroeconomic problems Lack of savings Large family Retirement Isolation Entitlement to public aids Low level of comfort Life in lodgings Single parent Old age Early founding of family Child benefit Unfavorable occupation Single Rural life Pesonal problem Crime
Score
Poverty-related items 200720112019
Table 5. Change in the ranking of poverty-related items between 2011 and 2019
Poverty-related item F (sig.) t (sig.) Mean
2011 2019
Low willingness to work 5.328 (0.027) –2.248 (0.033) 4.5789 8.3158 Unemployment 0.806 (0.375) –0.832 (0.411) 5.5263 7.1579
Debt 0.005 (0.943) –1.381 (0.176) 6.6316 9.0000
Low income level 5.109 (0.030) –1.953 (0.060) 6.4211 10.3158 No access to basic needs 9.063 (0.005) –1.178 (0.248) 7.1579 9.5000 Low education level 12.999 (0.001) –2.370 (0.025) 6.7368 10.9737 Poverty cycle 7.838 (0.008) –1.633 (0.113) 8.3158 11.2105 Addiction 8.458 (0.006) –2.853 (0.008) 6.9474 12.6579 Unfavorable mentality 0.724 (0.400) –0.034 (0.973) 11.8947 11.9474 Illness 5.721 (0.022) –1.249 (0.221) 11.8421 13.8421 Integration problems 2.278 (0.140) –1.361 (0.182) 11.7368 13.8158 Macroeconomic problems 2.064 (0.159) –1.754 (0.088) 12.5789 15.2105 Lack of savings 0.131 (0.719) –3.201 (0.003) 10.0526 15.4474 Large family 2.595 (0.116) –3.262 (0.002) 10.7368 15.6842 Isolation 0.239 (0.628) –4.733 (0.000) 13.3158 18.0526 Source: Author’s compilation.
In the case of 15 items, it is possible to test whether changes from 2011 to 2019 were significant. The number of poverty-related items included in quicksort was 18 in both waves, therefore their scores are comparable. F-test and t-test results (Table 5) highlight that the importance of the bulk of the poverty-related items (60%) did not change significantly in the examined period. Six items became less closely related to poverty.
To test whether there were any changes in value priorities in the examined period, the top seventeen items mentioned in the free listing are compared in the three waves (Table 6). Most of the items are related to material aspects of poverty, especially to physical needs (like no access to basic needs, malnutrition, life in lodgings, and low level of comfort) and to financial circumstances (like low income level, entitlement to public aids, debt, and lack of savings).
Unemployment is also related to material aspects of poverty following the criteria of Abramson and Inglehart (1995) and Inglehart and Welzel (2005).
Self-actualization (like low education level) is classified as item related to non- material aspects of poverty. Non-material aspects of poverty are associated with
the concept of social exclusion, which primarily focuses on the process leading to poverty (Havasi 2002) and emphasizes non-material aspects of poverty such as low education, poor health, isolation, or exclusion from cultural life.
Table 6. Top ten items in the three waves and their classification into value categories Item
category
2007 2011 2019
Item Rank Item Rank Item Rank
Items related to material aspects of poverty
Low income level 1 Low income level 3 Low income level 6 Entitlement to
public aid 4 No access to basic
needs 7 Malnutrition 3
Debt 4
Illness 5 Debt 4 No access to basic
needs 7
Life in lodgings 8 Lack of savings 10 Public work scheme participation 11 Low level of
comfort 6 Crime 8 Poor clothing 12
Single parent 12 Illness 14 Problems with
shelter 13
Child benefit 15 Macroeconomic
problems 16 Illness 15
Unemployment 3 Unemployment 2 Macroeconomic
problems 17
Unemployment 1
Average 6.75 Average 8.0 Average 8.9
Items related to non- material aspects of poverty
Isolation 17 Isolation 17
Low education
level 8
Personal problem 11 Low education
level 9 Low education
level 5
Average 13 Average 11 Average 8
Source: Author’s compilation.
Some items (like Roma ethnicity, retirement, old age, or poverty cycle) are considered family values, therefore cannot be classified as unambiguously related to material or non-material aspects of poverty (Roales-Nieto et al. 2013).
The same applies to items that are more strongly connected to the potential consequences of poverty, such as alcoholism/smoking or crime, and to items that are mostly the driving factors of poverty, like early family founding, large
family, low willingness to work, unfavorable mentality, integration problems, and discrimination. These items are not easily categorized as reflecting material or non-material aspects of poverty, therefore they are considered non-classifiable values.
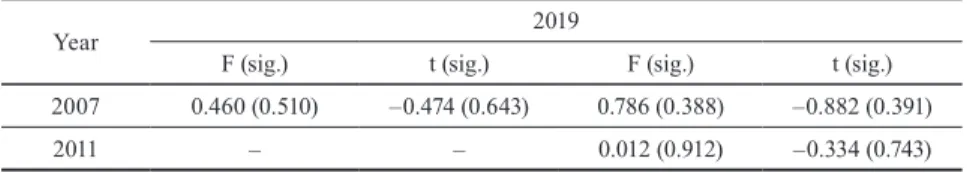
Comparison of the importance of items related to material aspects of poverty is possible with F- and t-tests. The changes in the importance of items reflecting non-material aspects of poverty are not tested with statistical methods because of the small samples. The results (Table 7) show that there are no significant differences in the average rank of the items related to material aspects of poverty between each pair of waves. Neither economic recession with growing poverty nor economic recovery with growing existential security was associated with significant value changes. This strengthens the socialization hypothesis and implies that the time period that was covered was not long enough to modify the adults’ value priorities.
Table 7. Comparison of the importance of items related to material aspects of poverty in the three waves
Year 2019
F (sig.) t (sig.) F (sig.) t (sig.)
2007 0.460 (0.510) –0.474 (0.643) 0.786 (0.388) –0.882 (0.391)
2011 – – 0.012 (0.912) –0.334 (0.743)
Source: Author’s compilation.
After determining the items most closely related to poverty, further specification of the perceived precise meanings of the items was necessary in certain cases. In the survey of 2019, the meanings of the following items needed further specification: low income level, large family, education level, and number of connections. Rating scales were applied to find out the precise perceived meanings of these items (see Figure 3).
Figure 3. Questionnaire for rating scales
1.What is the per capita monthly net income (in HUF) below which the bulk of people are poor?
40,000 60,000 80,000 100,000 120,000 140,000 160,000 180,000 200,000–
2. Having how many children makes the bulk of families poor?
0 1 2 3 4 5 6–
3. What is the educational level below which the bulk of people are considered to be poor?
Less than 8 grades
grades8
Secondary school with professional qualification, without general
certificate
Secondary school with general certificate
Secondary school with general certificate and with professional
qualification
College University
4. Many people believe that not having friends can make people poor. What do you think about this? Most people are poor if they can count on people to help them in case they need it.
0 1 or 2 3 or 4 5 or 6 7 or 8 9 or 10 11–
Source: Author’s compilation.
The precise perceived meanings of the items of interest can be found with the use of estimation. For this, a 0.95 confidence level is applied (see Table 8).
Where possible, the table also includes the results of the rating scales from the previous waves.
Table 8. Results of the rating scales in 2007, 2011, and 2019
Item Year Sample
size Mean SD 95% CI
Lower Upper
Monthly net income
2007 13 41,538 16,756 31,407 51,670
2011 20 48,400 22,772 37,742 59,058
2019 19 87,368 37,836 69,132 105,605
Number of children
2007 13 3.46 0.88 2.93 3.99
2011 20 4.00 0.97 3.54 4.46
2019 19 3.79 1.23 3.20 4.38
Education level
2007 13 2.15 1.07 1.51 2.80
2011 20 1.53 0.50 1.29 1.76
2019 19 1.63 0.83 1.23 2.03
Connections 2011 20 1.47 1.98 0.55 2.35
2019 19 0.61 1.16 0.05 1.17
Source: Author’s compilation
For income, the perceived poverty line was between HUF 31,407 and 51,670 in 2007, and between HUF 37,742 and 59,058 in 2011. By 2019, it had increased to between 69,132 and 105,605. This increase is remarkable. To decide whether it is significant, further calculations were needed. In the case of large families, in 2007 people thought that the majority of large families could be considered poor (in relation to the large number of children) if they were bringing up more
than three or four children. By 2011, the limit was four children. In 2019, it was again between three and four. The mean education level below which the majority of people are considered poor because of their low qualification level is between eight grades (indicated by an average slightly above 2, Table 8) and with a professional qualification without a general certificate (indicated by number 3) in 2007, while the level decreased to between less than eight grades (indicated by number 1) and eight grades (indicated by number 2) in 2011 and 2019. The number of connections below which most people are considered poor because of their isolation was examined only in 2011 and 2019. The survey revealed that individuals with fewer than one or two friends were considered at risk of poverty in 2011, while the number declined to one or no friends in 2019.
The change in the perceived meaning of poverty-related items seems to be remarkable in some cases. To test whether the changes were significant, the F-test and t-test were used (Table 9). It is possible to compare the precise meanings of the poverty-related items in 2011 and 2019 for four items: number of children (as an indicator of a large family), number of connections (as an indicator of isolation), income level, and education level. The results highlight that the subjective interpretation of isolation, large family, and low education level did not change in the nine years that were examined. The subjective income poverty line, however, increased significantly from 2011 to 2019.
Table 9. Comparison of the rating scale results in 2011 and 2019
Items
Levene’s test for equality of
variance T-test for equality of means
F Sig. Conclusion t Df Sig.
(2-tailed) Mean diff. SE
diff.
Children 3.734 0.061 Equal variance
assumed 0.579 36 0.566 0.211 0.363
Connections 1.683 0.203 Equal variance
assumed 1.294 36 0.204 0.632 0.488
Income 2.019 0.164 Equal
variance
assumed –3.816 36 0.001 –38947 10206 Education 8.147 0.007 Equal
variance not
assumed –0.470 30 0.642 –0.105 0.224 Source: Author’s compilation.
CONCLUSIONS
Cultural consensus theory proved to be appropriate for examining the public interpretation of poverty. Informants showed high levels of consensus in all three surveys, thus consensus theory was appropriate for estimating the cultural perceptions of informants about poverty.
The analysis of the interpretation of poverty in Borsod-Abaúj-Zemplén County, Hungary, revealed that items related to material aspects of poverty made up of the bulk of poverty-related items in each survey. This implies that the values of the adult population did not change significantly from 2007 to 2019. The time that had passed was probably not long enough to modify the basic values of the adult population, and therefore to modify the subjective interpretation of poverty. This supports Inglehart’s socialization hypothesis, which argues that a new generation needs to reach adulthood before values change. This finding is also in line with the findings of Duch and Taylor (1993), who concluded that existential security or insecurity during the early period of individuals’ lives has a strong and long-lasting influence on post-materialist attitudes later in life. The research could be extended over time by repeating the survey in the future to test whether the improvement in poverty indicators is associated with changes in value priorities, and whether existential security leads to changes in value priorities and, accordingly, in the perception of poverty in the long term.
In terms of categories, labor-market-related items like unemployment or a low willingness to work did not change in importance. A remarkable change over time occurred with family-related items, which became less closely related to poverty from 2011 to 2019. The Hungarian government has re-defined its family policy and introduced many kinds of child benefits (family allowances, a family tax allowance, and housing subsidies) (Sági et al. 2018), many of which were designed for parents of three or more children. Further research is needed to find out whether such government policies that encourage people to have more children affect these judgements.
The 2019 study took place before the recent COVID-19 events. Kluegel and Smith (1986) argue that cultural values might temporarily change during times of unusual social and/or economic strain. To test whether the pandemic did change the value priorities of adults, and therefore the interpretation of poverty, further research is needed.
REFERENCES
Abramson, P. R. – R. Inglehart (1995) Value Change in Global Perspective. Ann Arbor (MI), University of Michigan Press
Boster, J. S. (1983) Requiem for the Omniscient Informant: There’s Life in the Old Girl Yet. In: Dougherty, J. (ed.): Directions in Cognitive Anthropology.
Urbana (IL), University of Illinois Press, pp. 177–197.
Campbell, A. – Ph. E. Converse – W. L. Rodgers (1976) The Quality of American Life. Perceptions, Evaluations, and Satisfactions. New York, Russell Sage Foundation
Clark, B. S. (1998) Political Economy: A Comparative Approach. New York, Greenwood Publishing Company, pp. 57–59.
Cross, T. L. – B. J. Bazron – K. W. Dennis – M. R. Isaacs (1989) Towards a Culturally Competent System of Care. Washington DC, National Technical Assistance Center for Children’s Mental Health, Georgetown University Child Development Center
Delhey, J. (2004) Life Satisfaction in an Enlarged Europe. Report for the European Foundation for the Improvement of Living and Working Conditions.
Luxembourg, Office for Official Publications of the European Communities De Munck, V. C. – E. J. Sobo (1998) Using Methods in the Field: A Practical
Introduction and Casebook. Walnut Creek (CA), London, New Delhi, Altamira Press, A Division of Sage Publications, Inc.
Diener, E. (1995) A value based index for measuring national quality of life.
Social Indicators Research, Vol. 36, No. 2., pp. 107–127.
DiMaggio, P. (1994) Culture and Economy. In: Smelser, N. J. – R. Swedberg (eds.): The Handbook of Economic Sociology. Princeton (NJ), Princeton University Press, pp. 27–57.
Duch, R. M. – M. A. Taylor (1993) Postmaterialism and the economic condition. American Journal of Political Science, Vol. 37, No. 3., pp. 747–779.
DOI: 10.2307/2111573
G. Fekete, É. – Zs. Péter – E. Siposné Nándori – K. Lipták – Á. Hegyi-Kéri (2013) Területi politikák és stratégiák [Regional Policies and Strategies]. Miskolc (HU), Miskolci Egyetem Gazdaságtudományi Kar, https://regi.tankonyvtar.
hu/hu/tartalom/tamop412A/ 2011-0046_03_terpol/tananyag/13_3.html [Last access: 06 30 2020]
Havasi, É. (2002) Szegénység és társadalmi kirekesztettség a mai Magyarországon [Poverty and social exclusion in Hungary today].
Szociológiai Szemle, Vol. 12, No. 4., pp. 51–71.
Havasi, V. (2009) Az értékrend és életminőség összefüggései. PhD Thesis, Debrecen (HU), University of Debrecen
Hegedűs, P. – J. Monostori (2005) A szegénység és a társadalmi kirekesztődés mérőszámai, 2005 [Indicators of Poverty and Social Exclusion, 2005].
Elméleti megalapozás. Budapest, KSH Népességtudományi Kutató Intézet Inglehart, R. (2000) Globalization and postmodern values. The Washington
Quarterly, Vol. 23, No. 1., pp. 215–228.
Inglehart, R. – W. E. Baker (2000) Modernization, cultural change, and the persistence of traditional values. American Sociological Review, Vol. 65, No. 1., pp. 19–51.
Inglehart, R. – C. Welzel (2005) Modernization, Cultural Change, and Democracy: The Human Development Sequence. Cambridge (UK), New York, Cambridge University Press.
Kluegel, J. R. – E. R. Smith (1986) Beliefs about Inequality: Americans’ Views of What is and What Ought to be. New York: Aldine de Gruyter
Maxfield, M. G. – E. Babbie (2009) Basics of Research Methods for Criminal Justice and Criminology. (2nd Ed.) Belmont (CA), Wadsworth, Cengage Learning
Nunally, J. C. (1978) Psychometric Theory. New York, McGraw-Hill
Pachter, L. M. – S. C. Weller – R. D. Baer – J. E. G. de Alba Garcia – R. T.
Trotter II – M. Glazer – R. E. Klein (2002) Variation in asthma beliefs and practices among mainland Puerto Ricans, Mexican-Americans, Mexicans, and Guatemalans. Journal of Asthma, Vol. 39. No. 2., pp. 119–134.
Pénzes, J. (2014) Periferikus térségek lehatárolása – Dilemmák és lehetőségek [Delimitation of Peripheral Areas – Dilemmas and Opportunities]. Debrecen (HU), Didakt Kft.
Richins, M. L. (1994) Valuing things: The public and the private meanings of possessions. Journal of Consumer Research, Vol. 21, pp. 504–521.
DOI: 10.1086/209414
Roales-Nieto, J. G. – F. R. J. Lopez – B. O’Neill – J. Preciado – J. Malespin (2013) Intergenerational differences in materialist and post-materialist values in a sample of Hispanic New York City residents. Universitas Psychologica, Vol. 12, No. 3., pp. 671–683. DOI: 10.11144/Javeriana.UPSY12-3.idmp
Roberts, J. M. (1964) The Self-Management of Cultures. In: Goodenough, W. H. (ed.): Explorations in Cultural Anthropology New York, McGraw-Hill, pp. 433–454.
Rokeach, M. (1968) Beliefs, Attitudes and Values. San Francisco, Jossey-Bass Romney, A. K. (1989) Quantitative models, science and cumulative knowledge.
Journal of Quantitative Anthropology, Vol. 1, No. 1–2., pp. 153–223.
Romney, A. K. – S. C. Weller – W. H. Batchelder (1986) Culture as consensus:
a theory of culture and informant accuracy. American Anthropologist, New Series, Vol. 88, No. 2., pp. 313–338.
Sági, J. – Cs. Lentner – T. Tatay (2018) Family allowance issues. Hungary in comparison to other countries. Civic Review, Vol .14, Special Issue, pp. 290–301. DOI: 10.24307/psz.2018.0419
Siposné Nándori, E. (2011) Subjective poverty and its relation to objective poverty concepts in Hungary. Social Indicators Research, Vol. 102, No. 3., pp. 537–556. DOI: 10.1007/s11205-010-9743-z
Siposné Nándori, E. (2016) How did subjective well-being change in Hungary due to the economic crisis? Social Indicators Research, Vol. 126, No. 1., pp. 241–256. DOI: 10.1007/s11205-015-0878-9
Spéder, Zs. (2002) A Szegénység változó arcai: Tények és értelmezések [Changing Faces of Poverty: Facts and Interpretations]. Budapest, Andorka Rudolf Társadalomtudományi Társaság and Századvég, DOI: 10.1007/s11205- 015-0878-9
Weber, M. (1979) Gazdaságtörténet [General Economic History]. Válogatott tanulmányok. Budapest, KJK
Webster, C. M. – A. L. Iannucci – A. K. Romney (2002) Consensus analysis for the measurement of personality traits. Field Methods, Vol. 14, No. 1., pp. 46–64.
Weller, S. C. (2007) Cultural consensus theory: applications and frequently asked questions. Field Methods, Vol. 19, No. 4., pp. 339–368.
Weller, S. C. – A. K. Romney (1988) Systematic data collection. Qualitative Research Methods Series, Vol. 10, Newbury Park (CA), Sage Publications, Inc.
Weller, S. C. – R. D. Baer – L. M. Pachter – R. T. Trotter – M. Glazer – J. E. G.
de Alba Garcia – R. E. Klein (1999) Latino beliefs about diabetes. Diabetes Care, Vol. 22, No. 5., pp. 722–728.