Ph.D. Thesis
Development of modelling, control and optimization tools for the activated
sludge process
Bal´azs Holenda
Supervisor:
Arp´ad K´arp´ati, PhD ´
Doctorate School of Chemical Engineering University of Pannonia
2007
Doktori (PhD) ´ ertekez´ es
Eleveniszapos szennyv´ıztiszt´ıt´ o rendszerek modellez´ es´ ere, szab´ alyoz´ as´ ara ´ es
optimaliz´ al´ as´ ara szolg´ al´ o m´ odszerek fejleszt´ ese
Holenda Bal´azs
T´emavezet˝o:
Dr. K´arp´ati ´ Arp´ad egyetemi docens
Vegy´eszm´ern¨oki Tudom´anyok Doktori Iskola Pannon Egyetem
2007
Eleveniszapos szennyv´ıztiszt´ıt´o rendszerek modellez´es´ere, szab´alyoz´as´ara ´es optimaliz´al´as´ara szolg´al´o m´odszerek
fejleszt´ese
Ertekez´es doktori (PhD) fokozat megszerz´ese ´erdek´eben´
´Irta:
Holenda Bal´azs
K´esz¨ult a Pannon Egyetem Vegy´eszm´ern¨oki Tudom´anyok Doktori Iskol´aja keret´eben
T´emavezet˝o: Dr. K´arp´ati ´Arp´ad
Az ´ertekez´est elfogad´asra javaslom (igen/nem)
...
(al´a´ır´as) A jel¨olt a szigorlaton 100%-ot ´ert el.
...
A szigorlati bizotts´ag eln¨oke Az ´ertkez´est b´ır´al´ok´ent elfogad´asra javaslom:
B´ır´al´o neve:... (igen/nem)
...
B´ır´al´o neve:... (igen/nem)
...
A jel¨olt az ´ertekez´es nyilv´anos vit´aj´an ....%-ot ´ert el.
Veszpr´em, 2007.
...
A b´ır´al´obizotts´ag eln¨oke A doktori (PhD) oklev´el min˝os´ıt´ese ...
...
Az EDT eln¨oke
Acknowledgement
This PhD work has been supported by many people to whom the author is greatly indebted.
I am hereby expressing my acknowledgement to all who has worked for the Department of Environmental Engineering and Chemical Technology at Pannon University and help my work in some way, like Endre Domokos and P´eter Thury and many others. I must mentionIstv´an P´asztor here, PhD stu- dent and wastewater technologist, who helped me realize practical aspects of mathematical modelling and contributed also to the scientific results. I would like to express my particular thanks to Arp´ad K´arp´ati, PhD for his´ supervision in this work. I would also like to express my distinguished ac- knowledgement to the head of the department, prof. Akos R´edey´ for his continuous and immeasurable support in my work. Unquestionable, this thesis would have never come into existence without their contribution.
I am also thankful to my family, especially my mother and grandmother, who gave emotional support and encouragement during these years.
Soli deo gloria!
Kivonat
A matematikai modellez´es napjainkra a szennyv´ıztiszt´ıt´o telepek tervez´es´enek
´es ¨uzemeltet´es´enek fontos r´esz´ev´e v´alt, mivel seg´ıts´eg´evel pontosan bemu- tathat´ok az ¨uzemeltet˝o r´esz´ere a telepen lej´atsz´od´o folyamatok, felhaszn´alhat´o a tervez´esi f´aziban k¨ul¨onb¨oz˝o technol´ogiai megold´asok ki´ert´ekel´es´ere ´es a meglev˝o telepek ¨uzemeletet´es´enek optimaliz´al´as´ahoz is. ´Igy dolgozatomban a biol´ogiai szennyv´ıztiszt´ıt´as modellez´es´ere ´es hat´ekonyabb ¨uzemeltet´es´ere szolg´al´o m´odszereket vizsg´alok meg. Az el˝o´ırt hat´ar´ert´ekeknek megfelel˝o
¨uzemeltet´es ´erdek´eben a leveg˝oztet´es hat´ekonys´ag´at jav´ıt´o m´odszereket dol- goztam ki, majd az irodalomban tal´alhat´o modellek alkalmazhat´os´ag´aval,
¨osszehasonl´ıt´as´aval foglalkoztam.
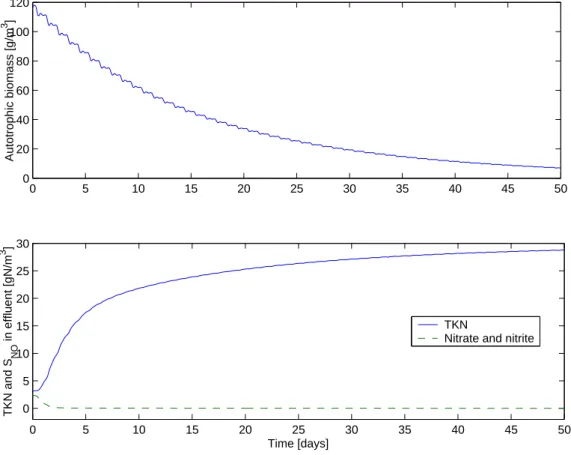
Egy optimaliz´al´asi m´odszert fejlesztettem ki, mely a befogad´oba ker¨ul˝o szennyez˝oanyag-terhel´est cs¨okkent˝o oly m´odon, hogy az optim´alis leveg˝ozte- t´esi id˝otartamot meghat´arozza ciklikus leveg˝oztet´es˝u szennyv´ıztelepek eset´en.
A esettanulm´any szimul´aci´os eredm´enyei azt mutatj´ak, hogy a elfoly´o v´ızben lev˝o szennyez˝oanyagok mennyis´ege ak´ar 10%-al is cs¨okkenthet˝o a hagyom´a- nyos szab´alyoz´asi strat´egi´ahoz k´epest.
Az oldottoxig´en-koncentr´aci´o szab´alyoz´as´ara egy modell predikt´ıv szab´a- lyoz´asi algoritmust vizsg´altam, melynek feladta az oxikus reaktorban az oxi- g´enkoncentr´aci´o egy adott szinten tart´asa. A szimul´aci´os eredm´enyek azt mutatj´ak, hogy a m´odszer hat´ekonyan alkalmazhat´o az oxig´enkoncentr´aci´o szab´alyoz´as´ara: a koncentr´aci´o maxim´alis elt´er´ese az el˝o´ırt ´ert´ekt˝ol 0.2 mg/l alatt maradt a jelent˝osen v´altoz´o mennyis´eg˝u ´es ¨osszet´etel˝u befoly´o szennyv´ız
ellen´ere.
A biol´ogiai reaktorr´esz b´armilyen j´o hat´asfokkal is m˝uk¨odhet, ha az ¨ulep´ıt˝o nem k´epes megfelel˝oen visszatartani a lebeg˝o r´eszecsk´eket a telep m˝uk¨od´es´e- ben jelent˝os zavarok keletkezhetnek. Az ut´o¨ulep´ıt˝o modellez´es´ere szolg´al´o hat matematikai modellt mutattam be ´es hasonl´ıtottam ¨ossze munk´amban egy szimul´aci´os protokoll seg´ıts´eg´evel. A dinamikus szimul´aci´ok eredm´enyei azt mutatt´ak, hogy az irodalmi adatok param´etereivel alkalmazott ¨ulep´ıt˝omodel- lek jelent˝os elt´er´eseket eredm´enyezhetnek a becs¨ult elfoly´o lebeg˝oanyag-kon- centr´aci´o tekintet´eben.
V´eg¨ul a matematikai modellez´es alkalmazhat´os´ag´at egy esettanulm´anyon mutatom be. Egy telep m˝uk¨od´ese sor´an jelent˝os foszforkoncentr´aci´o emel- ked´es volt megfigyelhet˝o bizonyos id˝oszakokban, s ennek a probl´em´anak a kivizsg´al´as´ara ´es azonos´ıt´as´ara alkalmaztunk sz´am´ıt´og´epes szimul´aci´ot. Sz´a- m´ıt´og´epes szimul´aci´o alkalmaz´as´aval a jelens´eg okai k¨onnyen azonos´ıthat´ok voltak ´es megold´asi javaslatot lehetett adni a probl´ema kezel´es´ere is.
Abstract
Mathematical modelling is a significant part of wastewater treatment sys- tem design since it can enhance the process understanding of the operator, it can be used for process design and it can be used for the optimization of the process. For these reasons, modelling and control tools have been de- veloped and applied to the biological wastewater treatment process in this thesis. In order to comply the industry standards during the operation, dif- ferent methods have been introduced to enhance the efficiency of the aeration, furthermore, applicability and comparison of wastewater treatment models available in literature have been assessed.
An optimization procedure has been introduced to reduce the effluent pollution load in the receiving body by determining the adequate aeration cycle lengths. It was found that applying this stochastic optimization method on an intermittently aerated activated sludge process using simulated case study approach, the effluent pollution load can be reduced by more than 10%
compared to traditional methods.
In another study, model predictive control has been applied to control the dissolved oxygen concentration in an aerobic reactor of a wastewater treatment plant. The results show that this method can be efficiently used for dissolved oxygen control: the maximum deviation of the concentration from the pre-defined setpoint remained under 0.2 g O2/m3 in spite of the significantly changing quality and quantity of incoming wastewater.
The biological reactor might be meeting the required effluent standards,
however, by not capturing the suspended solids adequately, could cause a possible failure in the operation of the facility. For this reason, six one- dimensional secondary settler models have been introduced and compared based on a Simulation Benchmark. The results of the dynamic simulations showed that significantly differences suspended solids concentrations can be estimated with the different models using the published model parameters.
Finally, the applicability of the mathematical modelling is introduced by a case-study approach. The phenomenon of a drastic phosphorus concentration increase in the effluent was investigated and identified using computer-aided simulation technique. The practical results justified that wastewater treat- ment modelling can be efficiently used in the case of operating facilities as well.
Abstrait
Modeler math´ematique est une partie significative de syste `mes de traitement des eaux r´esiduaires puisqu’il peut augmenter l’arrangement de processus de l’op´erateur, il peut ˆetre employ´e pour la conception de processus et il peut ˆetre employ´e pour l’optimisation du processus. Pour ces raisons, modeler et outils de commande ont ´et´e d´evelopp´es et appliqu´es au processus biologique de traitement des eaux r´esiduaires.
Un proc´ed´e d’optimisation a ´et´e pr´esent´e pour r´eduire la charge effluente de pollution dans le corps de r´eception en d´eterminant `a longueurs propor- tionn´ees de cycle d’a´eration. On l’a constat´e qu’appliquant cette m´ethode stochastique d’optimisation `a une approche simul´ee employante de processus par intermittence a´er´ee d’´etude de cas de boues activ´ees, la charge efflu- ente de pollution peut ˆetre r´eduite par plus de 10% compar´e aux m´ethodes traditionnelles.
Dans une autre ´etude, la commande pr´edictive de mod`ele a ´et´e appliqu´ee pour commander la concentration dissous en oxyg`ene dans un r´eacteur a´erobie d’une usine de traitement des eaux r´esiduaires. Les r´esultats prouvent que cette m´ethode peut ˆetre efficacement employ´ee pour la commande dissous d’oxyg`ene : la d´eviation maximum de la concentration du setpoint pr´ed´efini est demeur´ee au-dessous de 0.2 g O2/m3 malgr´e la qualit´e et la quantit´e changeantes de mani`ere significative d’eau usag´ee entrante.
Le r´eacteur biologique pourrait r´epondre aux normes effluentes exig´ees, cependant, en ne capturant pas les solides en suspension en juste proportion,
a pu causer un ´echec possible dans l’op´eration du service. Pour cette rai- son, six mod`eles secondaires unidimensionnels de colon ont ´et´e pr´esent´es et compar´es bas´e sur un ’Simulation Benchmark’. Les r´esultats des simulations dynamiques ont prouv´e que sensiblement des concentrations suspendues par diff´erences en solides peuvent ˆetre estim´ees avec les diff´erents mod`eles en utilisant les param`etres mod`eles ´edit´es.
En conclusion, l’applicabilit´e de modeler math´ematique est prouv´ee par cas-´etude. Le ph´enom`ene d’une augmentation ´energique de concentration en phosphore de l’effluent a ´et´e ´etudi´e et r´esolu en utilisant la technique assist´ee par ordinateur de simulation. Les r´esultats pratiques ont justifi´e que modeler de traitement des eaux r´esiduaires peut efficacement ˆetre aussi bien employ´e dans le cas des ´equipements de fonctionnement.
PhD theses
Within the framework of my PhD research, a biological wastewater treatment simulator program has been developed in Matlab/Simulink program. This allowed the modelling of the activated sludge wastewater treatment process based on the Activated Sludge Model No. 1 and the modelling of the secondary settling tank based on different one-dimensional settling tank models. By using this simulator program, the following scientific results were achieved:
1. It was found that the effluent nitrogen pollution load of inter- mittently aerated wastewater treatment plants can be reduced by more than 10% using optimal aeration periods in certain cases based on the results of computer simulation.
Since the operation of the intermittently aerated wastewater treatment process is challenging both for economical and technical reasons, an operational op- timization method has been introduced for the efficient operation of these facilities. The goal of the introduced procedure is to reduce the effluent pol- lution load in the receiving body by determining the adequate aeration cycle lengths. It was found that applying this stochastic optimization method on an alternating activated sludge process using simulated case study approach, the effluent pollution load can be reduced by more than 10%. It can be also concluded, that the TKN and NO3-N can be reduced with more than 10%
(0.2–0.5 g/m3), while the COD/BOD5 reduction is not so significant.
2. It has been shown that model predictive control algorithm can be efficiently applied for the dissolved oxygen level control of aerated basins, furthermore, gives better tunability than traditional con- trol methods.
Activated sludge wastewater treatment processes are difficult to be con- trolled because of their complex and nonlinear behaviour, however, the con- trol of the dissolved oxygen level in the reactors plays an important role in the operation of the facility. For this reason a new approach has been studied: model predictive control has been applied to control the dissolved oxygen concentration in an aerobic reactor of a wastewater treatment plant.
The proposed control approach has been tested on a pre-denitrification plant and on an alternating activated sludge process using simulated case-study approach. The results show that this method can be efficiently used for dis- solved oxygen control: the maximum deviation of the concentration from the pre-defined setpoint remained under 0.2 g O2/m3in spite of the significantly changing quality and quantity of incoming wastewater.
3. Different published one-dimensional settling tank models give sig- nificantly different estimation of the over- and underflow suspended solids concentration, however, the solids distributions around the inlet point are similar at all models.
The biological reactor might be meeting the required effluent standards, how- ever, by not capturing the suspended solids adequately, could cause a possi- ble failure in compliance with the COD (BOD5), total N and P standards.
The applied mathematical models allow the influences of inlet arrangement, sludge collection systems and sludge density currents to be modelled accu- rately. For this reason, six one-dimensional secondary settler models have been introduced and compared (the model of Tak´acs, H¨artel, Otterpohl, Dupont, Hamilton and a reactive model) based on a Simulation Benchmark.
The results of the dynamic simulations – under dry and wet weather condi- tions with daily and weekly change in the influent wastewater composition and quantity – showed that significantly differences suspended solids con- centrations can be estimated with the different models using the published
model parameters. The highest effluent solids concentration is estimated by the Dupont model (30-35 g/m3), the lowest concentration is predicted by the Otterpohl model (10 g/m3) while the Tak´acs model defined in the Simulation Benchmark approximated 12.5 g/m3 effluent concentration.
Contents
1 Motivation 6
1.1 Goals . . . 7
1.2 Methods . . . 9
2 Introduction to the mathematical modelling of biological waste- water treatment 10 2.1 Model applications . . . 12
2.2 Mathematical models of the activated sludge process . . . 14
2.2.1 ASM1 . . . 14
2.2.2 ASM3 . . . 26
2.2.3 Models including biological phosphorus removal . . . . 29
3 Aeration optimization of a wastewater treatment plant using genetic algorithm 32 3.1 Introduction . . . 33
3.2 Genetic algorithms in the optimization of WWTPs . . . 36
3.3 Illustrative case study . . . 39
3.3.1 Model of the aeration tank . . . 41
3.3.2 Model of the secondary settler . . . 43
3.4 Optimization problem statement . . . 44
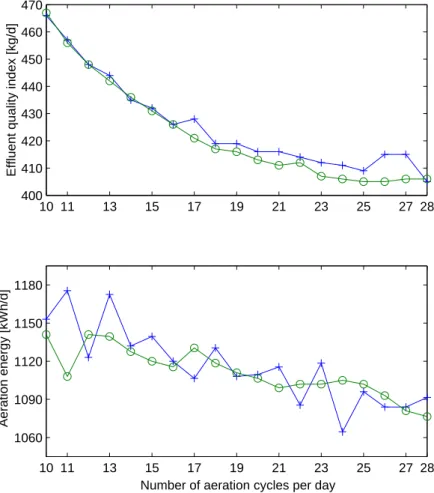
3.4.1 Effluent quality index . . . 45
3.4.2 Aeration energy . . . 46
3.4.3 Constraints . . . 46
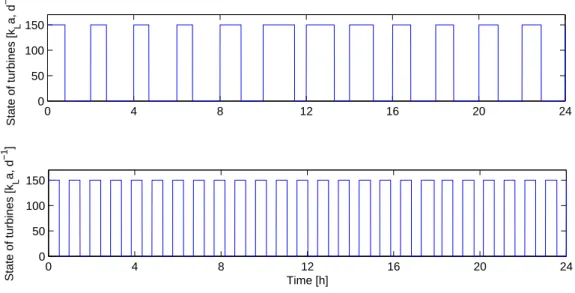
3.4.4 Chromosome representation of the 24-hour aeration profile . . . 47
3.5 Optimization results . . . 50
3.5.1 Optimal aeration strategies . . . 51
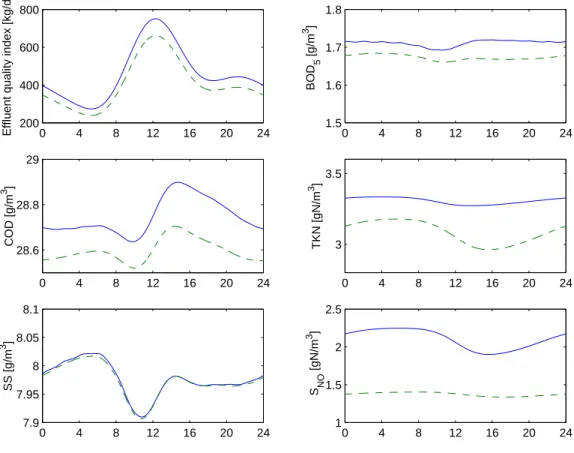
3.5.2 Comparison between a traditional oxygen based aera- tion strategy and the optimized operating mode . . . . 54
3.5.3 Advantages and disadvantages of GA-based optimization methods . . . 55
3.6 Conclusions . . . 57
4 Dissolved oxygen control using model predictive control 59 4.1 Introduction . . . 60
4.2 Modelling aspects . . . 62
4.2.1 Modelling the biological reactions . . . 62
4.2.2 Modelling the aeration process . . . 62
4.3 Model predictive control . . . 64
4.3.1 Controller design . . . 66
4.4 Performance assessment . . . 69
4.4.1 Controller performance . . . 70
4.4.2 Effluent quality index and operating cost . . . 71
4.5 Application example I: Control of the Simulation Benchmark . . . 72
4.6 Application example II: control of an alternating sludge process . . . 79
4.7 Conclusions . . . 82
5 Mathematical modellig of secondary settling tanks 85 5.1 Introduction to secondary settling tanks . . . 86
5.2 One-dimensional secondary clarifier models . . . 87
5.2.1 The Tak´acs-model . . . 94
5.2.2 The H¨artel correction function . . . 95
5.2.3 Model of Dupont and Dahl . . . 96
5.2.4 The Otterpohl and Freund model . . . 98
5.2.5 Model of Hamilton . . . 99
5.2.6 Reactive one-dimensional models . . . 101
5.2.7 Further model developments . . . 102
5.3 Simulation benchmark . . . 102
5.4 Simulation results . . . 104
5.4.1 Steady-state results . . . 105
5.4.2 Dynamic simulations . . . 106
5.5 Conclusion . . . 109
6 Case study of a computer-aided wastewater treatment plant reconstruction 110 6.1 Introduction . . . 111
6.2 Description of the wastewater treatment facility . . . 112
6.3 Problem identification . . . 114
6.4 Problem solution . . . 115
6.5 Conclusions . . . 121
7 Summary 122
8 Appendix 124
9 Publications 128
10 References 131
List of symbols
Abbre- Name Unit
viation
AE Aeration energy kWh/d
Bi Weight factor for effluent quality index - bH Decay rate coefficient for heterotrophic organisms d−1 bA Decay rate coefficient for autotroph organisms d−1
BOD5 Biochemical oxygen demand – 5 days mg O/L
COD Chemical oxygen demand mg O/L
E.Q. Effluent quality index -
fns Fraction of biomass yielding (inert) particulate products - fp Fraction of total influent which is unsettleable -
iXB Mass N/mass COD in biomass -
iXP Mass N/mass COD in products from biomass decay - Jclar Special flux function for the clarification
zone of the settler g/(m2 d)
Jdiff Flux due to an effective diffusion process g/(m2 d) Jdn Downward flux of SS due to downward bulk flow g/(m2 d) KN O Nitrate half-saturation coefficient for
denitrifying organisms mg N/L
KN H Ammonia half-saturation coefficient for autotrophs mg N/L KO,A Oxygen half-saturation coefficient for autotrophs mg O/L KO,H Oxygen half-saturation coefficient for heterotrophs mg O/L KS Half saturation coefficient for heterotrophs mg COD/L KX Half-saturation coefficient for for hydrolysis
of slowly biodegradable substrate mg COD/L
ka Ammonification rate mg N/mg N
kLa Oxygen mass transfer coefficient d−1
Abbre- Name Unit viation
Ntot Total nitrogen concentration mg N/L
Q0 Influent flow rate m3/d
Qa Internal recycle flow rate m3/d
Qe Effluent flow rate m3/d
Qr Sludge recycle flow rate m3/d
Qw Wastage flow rate m3/d
Qu Underflow rate m3/d
rh Settler model parameter for hindered settling m3(g SS)−1 rp Settler model parameter for low solids
concentrations m3(g SS)−1
P E Pumping energy Wh d−1
SALK Alkalinity molar unit
SI Inert soluble organic matter mg COD/L
SS Readily biodegradable substrate mg COD/L
SNH Ammonia and ammonium nitrogen mg N/L
SNO Nitrate and nitrite nitrogen mg N/L
SND Soluble biodegradable organic nitrogen mg N/L
SO oxygen mg O/L
SS Suspended solids concentration mg/L
v0 Maximum (theoretical) settling velocity m/d v00 Maximum (practical) settling velocity m/d
XB,A Active autotrophic biomass mg COD/L
XB,H Active heterotrophic biomass mg COD/L
XI Particulate inert organic matter mg COD/L
XND Particulate biodegradable organic nitrogen mg N/L
XS Slowly biodegradable substrate mg COD/L
XP Particulate products arising from biomass decay mg COD/L
YA Autotroph yield coefficient mg COD/mg N
YH Heterotroph yield coefficient mg COD/mg COD
ηg Correction factor for anoxic growth of heterotrophs - ηh Correction factor for anoxic growth of autotrophs - µA Maximum specific growth rate for
autotrophic organisms d−1
µH Maximum growth rate for heterotrophs d−1
Chapter 1 Motivation
Wastewater treatment processes can be considered as the largest industry in terms of treated mass of raw materials. In the European Community, for instance, a daily wastewater volume of approximately 40·106 m3 has to be processed . However, studies have shown that even well attended WWT plants fail to meet the required effluent quality standards up to 9% of the operation time, not including the short upsets lasting less than one day.
The U.S. Environmental Protection Agency estimated that one out of three treatment works were not in compliance with discharge limitations and in Germany and the Netherlands clarification problems were found to occur in almost half of the evaluated treatment. Besides poor design, overloading and inadequately trained operators, a lack of process control leading to excessive effluent quality variations, was reported as the main cause.
Over the last decade, the increased public awareness, as reflected in more stringent effluent regulations, has considerably increased the requirements imposed on treatment plants. Not only the organic carbon pollution of a wastewater must today be eliminated but also nutrients (i.e., nitrogen and phosphorus). With biological nutrient removal being the most economic way of treatment (in most cases), rather complex process configurations have resulted.
A closer look at the current operation of wastewater treatment plants shows that automation and control, while introduced in the late sixties, can still be considered minimal. Few plants are equipped with more than a few elementary sensing elements and control loops, mostly concerning flow metering and control, and for monitoring the basic plant performance over longer periods of time. For this reason, automation and control techniques are also addressed in this work.
1.1 Goals
The activated sludge wastewater treatment process consists of two main parts: the biological part and the clarification-thickening part. In the bi- ological part the most frequently used control variable is aeration intensity which is important also from the aspect of energy consumption. For the simulation of the secondary settler, still traditional distributed parameter models are applied based on empirical settling velocity functions. These two sub-processes will be addressed in this thesis from a certain aspect.
The aeration control is of great importance due to the generally large energy consumption of the aeration system. In spite of their widespread use, many small-size wastewater treatment plants are still operated on the basis of pre-determined air-on/air-off sequences, where the duration of each stage is identical from one day to another. More flexibility of the aeration strategy can be obtained by specifying switching conditions from the measurements of the dissolved oxygen concentration or the redox potential.
Although these strategies result in considerable performance improve- ments, it is not rare however that the concentration of either the organic or nitrogen compounds largely exceeds the standards defined by the Euro- pean Union. An alternative method to improve the activated sludge process performances is to apply dynamic optimization techniques based on detailed mathematical models. These methods aim at rigorously determining the best
transient control profile that minimizes a given objective function, on a given time horizon, and satisfies a (possibly empty) set of constraints.
A similar approach is going to be studied in this work based on a certain stochastic optimization technique. Genetic algorithms have proved to be a robust and fast solution for global minimum (maximum) problems. There- fore, it is going to be investigated how it could enhance the optimal aeration of intermittently aerated wastewater treatment plant where the length of the aerated periods determines both the effluent quality and the energy con- sumption of the plant.
Besides intermittently aerated wastewater treatment plants, the control of the dissolved oxygen concentration plays a significant role in the aerated basin of the activated sludge process. It has to be high enough to maintain efficient nutrient removal, however, unnecessarily high rate of aeration wastes significant amount of energy. Nowadays, basic control methods are applied in the real-life applications, therefore, the applicability of a more advanced control technology, model predictive control, is going to be studied in this thesis.
While the presence or absence of dissolved oxygen has a determining part in the process rate of the bio-chemical reactions in the biological part of the activated sludge process, the biological mechanisms are often neglected in the mathematical model of the secondary settling tank where the separation of the clarified water and the activated sludge takes place. Several empirical models have been suggested in literature for describing the settling of the suspended solids since the beginning of the 1990s, however, no comparative study of these models can be found in literature. It is going to examined in this thesis how these models operate under the same conditions. The suspended solids concentration profile under steady-state conditions and the daily change of the effluent sludge sludge concentration are also addressed in this study.
1.2 Methods
Using mathematical modelling, the validation and verification of the applied model is inherent part of the simulation method. Furthermore, parameter estimation can also be a time consuming part of modelling. However, in the area of activated sludge wastewater treatment internationally accepted standard mathematical models enhance the work of the modelling engineer.
The first activated sludge wastewater treatment models were published in the 1980s and the model development has been continuously going since that time as it will be introduced in Chapter 2. Furthermore, besides standard- ized models, the appearance of a simulation benchmark has improved the acceptance of innovating control strategies. This simulation benchmark – introduced in Section 4.5 – also creates a solid basis for the proposed control strategies in this thesis and provides a good environment for the comparison of different secondary settler models.
This simulation benchmark defines a platform independent model of a wastewater treatment plant, however, issues arising at different modelling tools (e.g. GPS-X, Matlab, Fortran) are also discussed in that manual. For the results presented in this thesis, the simulator package of Matlab/Simulink has been selected and all results are based on this simulation environment.
Matlab/Simulink is a widely accepted simulator program in academic re- search and provides a visual interface for the better understanding of the simulated processes. However, since the simulation of a complete model of a wastewater treatment plant requires the solution of more then 100 dif- ferential equations, large part of the model has been implemented in C++
program code using the Matlab standard functions. Hence, the advantage of the graphical interface and efficient computation could be exploited using this approach.
Chapter 2
Introduction to the
mathematical modelling of
biological wastewater treatment
Over the last decades, increasing awareness of the adverse impact that waste- water discharges have on the aquatic environment (e.g. eutrophication) has led to the introduction of more stringent legislation controlling the qual- ity of the effluents discharged from wastewater treatment plants. To comply with the more stringent effluent quality standards, new wastewater treatment systems have been developed and older ones have been improved. Activated sludge systems have been extended from carbonaceous energy (COD, BOD5) removal only to include nitrogen removal by nitrification and denitrification, furthermore, the biological removal of excess phosphorus. Additionally, the system is required to produce a good clarifying and settling sludge by floc- culating well and controlling the proliferation of filamentous organisms.
As a result, the activated sludge system configuration and its opera- tion have increased in complexity and concomitantly, the number of physi- cal, chemical and biological processes and compounds influencing the efflu- ent quality has increased to decrease chemical or biological oxygen demand
(COD, BOD5), free and saline ammonia, nitrate (NO3-N), nitrite (NO2-N), total and orthophosphorus (TP and PO3−4 ) and suspended solids (SS) con- centrations.
The modelling of biological wastewater treatment systems has also passed through the above sequences: first, the removal of organic matter only; sec- ond, for nitrification; and third, for nitrogen removal by biological denitrifica- tion. Wastewater treatment practice has now progressed to the point where all of these can be accomplished in a single-sludge system. Because of the interactions within such systems, the mathematical models depicting them are quite complex, which has detracted from their use. This is unfortunate because it is with such complex systems that the engineer has the most to gain from the use of mathematical models.
Modelling is an inherent part of the design of a wastewater treatment system, regardless of the approach used. At the fundamental level, a design model may be merely conceptual; that is the engineer reduces the complex system with which he is dealing with a conceptual image of how it functions.
That image then determines the design approach employed. Often, however, the engineer recognizes that the conceptual model alone does not provide sufficient information for design and thus he constructs a physical model, such as a lab-scale reactor or a pilot plant, upon which various design ideas can be tested. Given sufficient time for testing, such an approach is entirely satisfactory. However, the engineer may find that time and money limita- tions prevent exploration of all potentially feasible solutions. Consequently, the designer often turns to the use of mathematical models to define further design alternatives. Empirical models may be devised which incorporate a statistical approach to mimic the end results obtained by studies on the phys- ical model, or if the conceptual understanding expands sufficiently, he may attempt to formulate mechanistically based models which seek to account for the major events occurring within the system itself.
These mechanistic models are more powerful since they allow extrapola-
tion of the design space to conditions beyond that experienced on the physi- cal model. In this way, many potentially feasible solutions may be evaluated quickly and inexpensively, thereby allowing only the more promising ones to be selected for actual testing in the physical model.
Realizing the benefits to be derived from mathematical modelling, while recognizing the reluctance of many engineers to use it, the International As- sociation on Water Pollution Research and Control (IAWPREC) formed a task group in 1983 to promote the development, and facilitate the applica- tion of, practical models to the design and operation of biological wastewater treatment systems. The first goal was to review existing models and second one was to reach a consensus concerning the simplest one having the ca- pability of realistic predictions of the performance of single sludge systems carrying out carbon oxidation, nitrification and denitrification. The model was to be presented in a way that made clear the processes incorporated into it and the procedures for its use.
2.1 Model applications
The purpose for wastewater treatment plant (WWTP) model studies can be [46, 73] : (1) learning, i.e. use of simulations to increase process understand- ing, and to develop people’s conception of the system; (2) design, i.e. to evaluate several design alternatives for new WWTP installations via simula- tion; (3) process optimisation and control, i.e. to evaluate several scenarios that might lead to improved operation of existing WWTPs. The two latter ones are applications of the model in a service role. An application of the model in an analysis role can for example be a study where the suitability to describe a particular process is evaluated for several modelling concepts enclosed in different activated sludge models.
WWTP model simulations for learning
Simulations with WWTP models can be applied in different ways to increase the process understanding of the user. For the WWTP operator, simulations might for example be useful to indicate the consequences of process operation modifications on the activated sludge composition and the WWTP effluent quality. Similarly, simulations with e.g. the benchmark plant [17] for different weather disturbance scenarios are very informative to get an idea of the behaviour of a WWTP under variable weather conditions.
WWTP model simulations for design
During the design phase, process alternatives can be evaluated via simula- tion. Such a model study was presented e.g. by Salem et al. [80], where different alternatives for the upgrade of a biological N removal plant were evaluated with a focus on appropriate treatment of sludge reject water. The WWTP model simulations provided the knowledge basis that was needed to decide on full-scale implementation of one of the proposed alternatives. In this context, modelling can substantially reduce the scale-up time, because different options can be evaluated before a pilot plant is built.
WWTP model simulations for process optimisation
Process optimisation can be used in different contexts. Off-line process opti- misation refers to applications where off-line simulations with the calibrated model are used to determine how to optimally run the process, whereas the result is later on implemented and tested on the full-scale plant. In on-line process optimisation simulations with the calibrated model are applied in an on-line optimisation scheme, for example in the frame of a plant-wide supervisory control system. Off-line process optimisation is often needed be- cause new stricter demands are imposed to existing WWTPs, or considerable changes in the plant load have occurred, or deficiencies have appeared dur-
ing WWTP operation such that the initially required effluent quality cannot any longer be obtained. In this context, simulations are often used to eval- uate whether the pollutant removal efficiencies can be improved within the existing plant lay-out, e.g. via improved process control.
2.2 Mathematical models of the activated sludge process
In this section the most frequently used activated sludge models will be introduced. Particular attention will be devoted to the ASM1 model, since it is still used as a state-of-the-art model nowadays, furthermore, significant part of the latter chapters will be based on the application of this model.
Furthermore, the ASM3, the ASM2 and ASM2d, and the TUDP models will be considered in this chapter. Introduction of these models is based on the Scientific and Technical Report of the International Water Association [41]
and other papers [17, 30].
2.2.1 ASM1
The Activated Sludge Model No. 1 [38] can be considered as the reference model, since this model triggered the general acceptance of WWTP mod- elling, first in the research community, later in the industry. This evolution was undoubtedly enhanced by the availability of more and more powerful computers.
Even today, the ASM1 model is in many cases still the state-of-the-art for modelling activated sludge systems [79]. ASM1 has become a major ref- erence for many scientific and practical projects, and has been implemented in almost every commercially available WWTP simulation software. Copp [17] reports on experiences with ASM1 implementations on different software platforms.
The development of activated sludge theory was inhibited for a long time by the lack of a consistent measure of the concentration of organic mater- ial in wastewater. Three measures have gained acceptance and are widely used: biochemical oxygen demand (BOD), total organic carbon (TOC), and chemical oxygen demand (COD). Of these, COD is the superior measure because it alone provides a link between electron equivalents in the organic substrate, the biomass and the oxygen utilized. Furthermore, mass balances can be made in terms of COD. Consequently, the concentrations of all or- ganic materials, including biomass, are in COD units in the following model.
The organic matter in a wastewater may be subdivided into a number of categories [21]. The first important subdivision is based on biodegradability.
Non-biodegradable organic matter is biologically inert and passes through an activated sludge system unchanged in form. Two fractions, depending on their physical state, can be identified: soluble and particulate. Inert soluble organic matter, SI, leaves the system at the same concentration that it en- ters. Inert suspended organic matter,XI, becomes enmeshed in the activated sludge and is removed from the system through sludge wastage. Because the waste sludge flow rate is smaller than the system inflow rate, a mass bal- ance requires the concentration of XI in the system to be higher than in the influent.
Biodegradable organic matter may be divided into two fractions: read- ily biodegradable and slowly biodegradable. For purposes of modelling, the readily biodegradable material, SS, is treated as if it were soluble, whereas the slowly biodegradable material, XS, is treated as if it were particulate. It should be recognized, however, that some slowly biodegradable material may actually be soluble. The readily biodegradable material consists of relatively simple molecules that may be taken in directly by heterotrophic bacteria and used for growth of new biomass. A portion of the energy (COD) associated with the molecules is incorporated into the biomass, whereas the balance is expended to provide the energy needed for the synthesis. The electrons asso-
ciated with that portion are transferred to the exogenous electron acceptors (oxygen or nitrate). In contrast, the slowly biodegradable material, consist- ing of relatively complex molecules, must be acted upon extracellularly and converted into readily biodegradable substrate before it can be used. It is assumed that conversion of slowly biodegradable substrate into the readily biodegradable form (hydrolysis) involves no energy utilization and thus there is no utilization of electron acceptor associated with it.
The specific rate of hydrolysis of slowly biodegradable substrate is usually considerably lower than the specific rate of utilization of readily biodegrad- able substrate, so that it becomes the rate-limiting factor in the growth of biomass when XS alone is present as substrate. Furthermore, the rate of hydrolysis is lower under anoxic conditions (only nitrate available as the ter- minal electron acceptor) than under aerobic conditions [89]. The division of substrate into two forms provides a built-in lag in uptake of electron ac- ceptor which allows space-time dependent variations in oxygen and nitrate utilization to be modelled. Heterotrophic biomass is generated by growth on readily biodegradable substrate under either aerobic or anoxic conditions, but is assumed to stop under anaerobic conditions. Biomass is lost by de- cay, which incorporates a large number of mechanisms including endogenous metabolism, death, predation and lysis. For reasons to be explained later, decay is assumed to result in the conversion of biomass into slowly biodegrad- able substrate and particulate products, XP, which are inert to further bio- logical attack [21]. The loss of biomass by decay is assumed to occur at a rate which is independent of the nature or concentration of the electron acceptor present, but the conversion of the resultant slowly biodegradable substrate to a form that can be used for regrowth of new cells is influenced by the nature of the electron acceptor as discussed in the preceding paragraph. Ni- trogenous matter in a wastewater, like carbonaceous matter, can be divided into two categories: non-biodegradable and biodegradable, each with further subdivisions. With respect to the non-biodegradable fraction, the particulate
portion is that associated with the non-biodegradable particulate COD; the soluble portion is usually negligibly small and is not incorporated into the model. The biodegradable nitrogenous matter may be subdivided into: ’am- monia’ (both the free compound and its salts),SNH; soluble organic nitrogen, SND; and particulate organic nitrogen, XND. Particulate organic nitrogen is hydrolysed to soluble organic nitrogen in parallel with hydrolysis of slowly biodegradable organic matter. The soluble organic nitrogen is acted on by heterotrophic bacteria and Ionverted to ammonia nitrogen. The ammonia nitrogen serves as the nitrogen supply for synthesis of heterotrophic bio- mass and as the energy supply for growth of autotrophic nitrifying bacteria.
For simplicity, the autotrophic conversion of ammonia nitrogen to nitrate nitrogen is considered to be a single step process which requires oxygen.
The nitrate formed may serve as terminal electron acceptor for heterotrophic bacteria under anoxic conditions, yielding nitrogen gas. Cell decay of either autotrophic or heterotrophic biomass leads to release of particulate organic nitrogen which can re-enter the cycle. Both heterotrophic and autotrophic biomass may be present in the wastewater itself, thereby having a strong effect upon system performance. However, the prevalence and intensity of this occurrence is still unknown and thus it was not considered by the task group in developing the model. It should be noted, however, that the only change required for its inclusion would be the addition of input terms to the appropriate mass balance equations.
Processes in the model
The fundamental processes incorporated into the model are listed in the leftmost column of Table 2.1, while their rate expressions are listed in the rightmost column. Basically, four processes are considered: growth of bio- mass, decay of biomass, ammonification of organic nitrogen, and ’hydrolysis’
of particulate organics which are entrapped in the biofloc. To facilitate mod- elling, readily biodegradable material is considered to be the only substrate
Table 2.1: The Petersen-matrix of the ASM1 model from [38]
for growth of the heterotrophic biomass. Slowly biodegradable material is considered to be removed from suspension instantaneously by entrapment in the biofloc. Once there, it is acted upon by reactions which convert it into readily biodegradable substrate. These reactions are simply called ’hydroly- sis’ in the model, although in reality they are likely to be much more complex.
The net result of their inclusion is to introduce a time delay into the utiliza- tion of oxygen since it is only associated with the growth of the organisms at the expense of readily biodegradable substrate. Decay is assumed to result in the transformation of active biomass into inert particulate products and into slowly biodegradable substrate which re-enters the cycle of hydrolysis, growth, etc. This allows more straightforward expression of decay under the various environmental conditions encountered in a single sludge system. It also has several important ramifications with respect to the values of the parameters, as will be discussed later.
First consider process 1,aerobic growth of heterotrophic biomass.
ρ1 = ˆµH
µ SS KS+SS
¶ Ã SO KO,H+SO
!
XB,H (2.1)
On studying the equation defined in row 1 of Table 2.1, it can be concluded that of row 1 shows that growth occurs at the expense of soluble substrate and results in the production of heterotrophic biomass. This is associated with the utilization of oxygen. (See left side of Fig. 2.1.) Since COD units are used for both substrate and biomass, and since oxygen may be consid- ered to be negative COD, continuity requires that the oxygen requirement equal the net COD removal (soluble substrate removed minus cells formed).
Ammonia nitrogen will be removed from solution and incorporated into cell mass. The kinetics of aerobic growth of the heterotrophic biomass are as- sumed to be subject to double nutrient limitation, with the concentrations of both readily biodegradable substrate and DO being rate determining. The primary purpose of the oxygen term is as a switching function which stops
aerobic growth at low DO concentrations and thus the value of the satura- tion coefficient, KO,H, is small. Removal of readily biodegradable substrate is considered to be proportional to growth. No provision is made for the storage of soluble substrate because that phenomenon is limited to only a few substrates such as soluble monosaccharides and acetate. However, it is widely recognized that substrates can be removed without associated bio- mass growth. This event is handled in the model through the immediate entrapment of slowly biodegradable substrate.
Row 2 of Table 2.1 representsanoxic growth of the heterotrophic biomass with nitrate nitrogen as the terminal electron acceptor.
ρ2 = ˆµH
µ SS
KS+SS
¶ Ã KO,H
KO,H+SO
! µ SNO
KNO+SNO
XB,H (2.2) Like aerobic growth it occurs at the expense of readily biodegradable sub- strate and results in heterotrophic biomass. Nitrate nitrogen serves as the terminal electron acceptor and its removal is in proportion to the amount of readily biodegradable substrate removed minus the quantity of cells formed.
As in aerobic growth, ammonia nitrogen is converted into organic nitrogen in the biomass. The rate expression for anoxic growth is analogous to the one for aerobic growth. In fact, the effect of readily biodegradable substrate on the rate is identical, including the value of the saturation coefficient, KS. However, that the maximum rate of substrate removal under anoxic condi- tions is often less than it is under aerobic conditions. This could either be because ˆµHis lower under anoxic conditions or because only a fraction of the heterotrophic biomass is able to function with nitrate as the terminal electron acceptor. It is currently impossible to differentiate between these possibili- ties. Thus, from a modelling standpoint, the easiest way to incorporate the effect is to add an empirical coefficient, ηg, to the rate expression, where ηg <1.0. Anoxic growth depends upon the concentration of nitrate nitrogen in a manner analogous to the way in which aerobic growth depends upon
the dissolved oxygen concentration. Furthermore, anoxic growth is inhibited when oxygen is present and the term KO,H/(KO,H+SO) is incorporated to reflect that fact. The coefficient KO,H has the same value as in the expres- sion for aerobic growth so that as aerobic growth declines, anoxic growth increases. Like the other similar terms, its primary use is as a switching function.
Aerobic growth of autotrophic biomass is depicted in row 3 of Table 2.1.
ρ3 = ˆµA
µ SNH KNH+SNH
¶ Ã SO KO,H+SO
!
XB,A (2.3)
Soluble ammonia nitrogen serves as the energy source for growth of the nitri- fiers resulting in autotrophic cell mass and nitrate nitrogen as end products.
(See left side of Fig. 2.1.) In addition, a small amount of ammonia is in- corporated into the biomass. Oxygen is used in proportion to the amount of ammonia nitrogen oxidized. A double saturation function is used to express the dependency of the autotrophic specific growth rate upon the soluble con- centrations of both ammonia nitrogen and oxygen, with the latter serving as a switching function. Both the saturation coefficients, KNH and KO,A, are small. Although aerobic growth of autotrophic biomass is known to be influ- enced by the pH of the wastewater in which the organisms are growing, this dependency was not included in the rate equation because of the difficulty of actually predicting the pH in a bioreactor. Rather, any potential problems with pH should be checked through use of the alkalinity term, as discussed earlier.
The approach adopted for modelling decay of the heterotrophic biomass is basically the death-regeneration concept and is depicted in row 4 of Table 2.1.
ρ4 =bHXB,H (2.4)
There it can be seen that the adopted rate expression is quite simple, i.e.
first order with respect to the heterotrophic biomass concentration. The
rate coefficient, however, is different in both concept and magnitude from the usual decay coefficient. In this case, decay acts to convert biomass to a combination of particulate products and slowly biodegradable substrate.
(See left side of Fig. 2.1.) No loss of COD is involved in this split and no electron acceptor is utilized. Furthermore, decay continues at a constant rate regardless of the environmental conditions (i.e. bH is not a function of the type of electron acceptor or its concentration). The slowly biodegrad- able substrate formed is then hydrolysed, as depicted in row 7 of Table 2.1, releasing an equivalent amount of readily biodegradable COD. If conditions are aerobic, that substrate will be used to form new cells with concomitant oxygen uptake. If conditions are anoxic, cell growth will occur at the expense of nitrate nitrogen. If neither oxygen nor nitrate nitrogen are availabie, no conversion occurs and slowly biodegradabie substrate will accumulate. Only when aerobic or anoxic conditions are resumed will it be converted and used.
The magnitude of the decay coefficient used herein will be different from that of the more usually encountered rate constant because of the recycling of substrate which occurs. In the usual technique, the loss of one unit of cell mass COD leads to the utilization of one unit of oxygen minus the COD of the inert particulate products formed. In this model, the loss of one unit of cell mass COD results in the ultimate formation of one unit of COD due to readily biodegradable substrate minus the COD of the inert particulate products formed. When the readily biodegradable COD is used for cell synthesis, only a fraction of a unit of oxygen will be required because of the energy incorporated into the cell mass. That cell mass must in turn undergo decay etc. before the unit of oxygen is finally removed. Consequently, to give the same amount of oxygen utilization per time due to decay, the decay coefficient must be larger. This has the result of increasing the turnover rate of cell mass, thereby making the actual microbial growth rate higher far a given solids retention time.
Thedecay of autotrophs, given in row 5 of Table 2.1, is handled in exactly
the same manner as the decay of heterotrophs.
ρ5 =bAXB,A (2.5)
The justification for this is the likelihood that the decay observed in enrich- ment cultures of autotrophic bacteria is actually due to predation and lysis, with subsequent growth of adventitious heterotrophic bacteria upon the lysis products. While it is likely that the magnitude of the decay coefficient for autotrophic bacteria will be less than that for heterotrophic bacteria, even more questions can be raised about this process.
Another impact of biomass decay is to recycle nitrogen through the sys- tem. The conversion of biomass to slowly biodegradable substrate and then to readily biodegradable substrate has associated with it a parallel conver- sion of organic nitrogen to ammonia: soluble organic nitrogen is converted to ammonia nitrogen through the reaction depicted in row 6 of Table 2.1.
ρ6 =kaSNDXB,H (2.6)
This simple first order equation is empirical in nature but has been found to be adequate for modelling the conversion when coupled with the process rate equation for hydrolysis of entrapped organic nitrogen [22].
Rows 7 and 8 in Table 2.1 show the models that have been adopted for hydrolysis of slowly biodegradable organic matter and biodegradable organic nitrogen.
ρ7 =kh XSXB,H−1 KX+XSXB,H−1
"Ã
SO KO,H+SO
!
+ηh
à KO,H KO,H+SO
! µ SNO KNO +SNO
¶#
XB,H (2.7)
ρ8 =ρ7XNDXS−1 (2.8)
The degradation of slowly biodegradable organic matter is very important to realistic modelling of activated sludge systems because it is primarily re-
sponsible for the attainment of realistic space-time and real time dependent electron acceptor profiles. Consequently, a great deal of effort was devoted to this topic by the task group. Within the past few years, the major changes and innovations in activated sludge modelling have been directed toward the development of equations depicting the fate of entrapped particulate or stored soluble substrates. Careful examination of all of the available literature re- vealed that very little experimental work has been conducted specifically on the kinetics and mechanisms of degradation of particulate organic material.
Most studies in the wastewater treatment field have been done as part of complex model systems, thereby making it difficult to verify independently the portions dealing with hydrolysis and degradation of particulates. Nev- ertheless, it was evident that certain features were required in order for the overall system models to give realistic electron acceptor profiles. One aspect was that the rate was first order with respect to the active heterotrophic bio- mass present. Another aspect was that the rate appeared to saturate as the amount of entrapped substrate became large in proportion to the biomass.
Finally, because of the need for enzyme synthesis it was supposed that the rate would be dependent upon the concentration of electron acceptor present.
It is assumed that the rate decreases to zero in the absence of both oxygen and nitrate. Examination of row 7 in Table 2.1 shows that all of these fea- tures were incorporated. The organic nitrogen was assumed to be uniformly distributed throughout the slowly biodegradable substrate so that the rate of hydrolysis of entrapped organic nitrogen would simply be proportional to the rate of hydrolysis of slowly biodegradable substrate.
Model assumptions and limitations
• Temperature: Kinetic model parameters are temperature dependent, and consequently one has either to estimate the model parameters when calibrating the model for a specific temperature, or to develop appropriate temperature correction factors to include the temperature
dependency of the reaction kinetics in the simulations. Henze et al. [38]
provided two sets of typical parameters for 10 and 20 ◦C, respectively.
Later models, such as ASM2 [39] and the TUDP model [91], use an Arrhenius type temperature dependence. Different reactions have dif- ferent temperature dependencies, where nitrification is generally most sensitive.
• pH: In ASM1, it is assumed that the pH is constant and near neu- trality. Including alkalinity as one of the state variables in the model allows detection of possible pH problems. For some reactions, specific functions can be added to the model to describe inhibitory pH effects.
• Toxic components: Nitrification is especially sensitive to inhibition by toxic components. In ASM1, the nitrification parameters are assumed to be constant. This means that any inhibitory effect of the wastewater on the nitrification kinetics is assumed to be included in the calibrated nitrification parameters. It is thus only possible to represent an ”aver- age inhibitory effect” of the wastewater. Alternatively, the nitrification rate equation can be extended to represent sudden acute inhibition by specific chemicals. It is then up to the modeller to select the best inhibition kinetics model for the actual inhibition problem.
• Wastewater composition: The activated sludge models were developed for simulation of municipal WWTPs. Model modifications are typically needed for WWTP systems where industrial contributions dominate the wastewater characteristics. Acute nitrification inhibition by toxic components related to industrial activity is one of the model modifica- tions that are often necessary.
• The net growth rate or SRT of the biomass must be within the range that allows a flocculent biomass to develop. For example if the SRT falls below 3 days, there are likely to be severe problems with sludge
settleability in an activated sludge system. Since the model does not consider sludge settling, the suer must ensure that all conditions em- ployed will result in a sludge which settles properly.
• Proper sludge settling is also dependent upon the concentration of solids entering the finall settler. Thus, while it is possible mathemati- cally to make the reactor hydraulic retention time small by making the activated sludge concentration very large, such a trade-off may not work in practice because it may be difficult to get the highly concentrated sludge to settle sufficiently to obtain a clear effluent.
2.2.2 ASM3
During the years of application of ASM1 several defects had become obvi- ous and the IAWPRC Task Group decided on correcting these defects by publishing ASM3. These disadvantages were the followings:
• ASM1 does not include kinetic expressions that can deal with nitrogen and alkalinity limitations of heterotrophic organisms.
• ASM1 includes biodegradable soluble and particulate organic nitrogen as model compounds. These cannot easily be measured and made the use of ASM1 complicated.
• The kintecs of ammonification in ASM1 cannot be easily quantified, moreover the process is fast and therefore hardly affects model predic- tions.
• ASM1 differentiates inert particulate organic material depending on its origin, influent or biomass decay, but it is impossible to differentiate between this two fractions in reality.
• Lysis combined with hydrolysis and growth is used to describe the lumped effects of endogenous respiration of, for example, storage com-
pounds, death, predation and lysis of the biomass. This may lead to further difficulties in the evaluation of kinetic parameters.
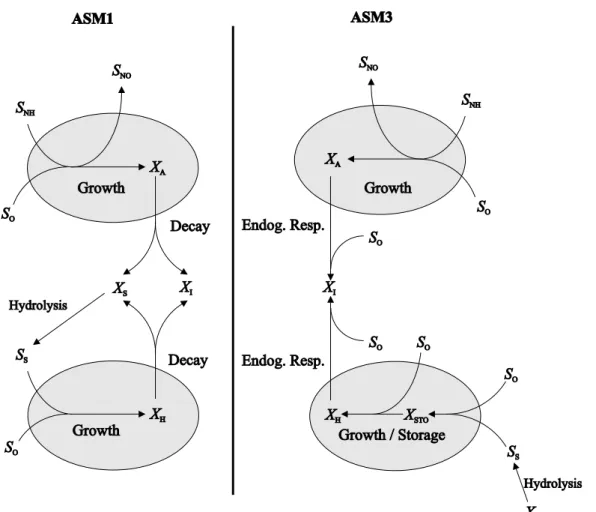
The ASM3 model [33] was also developed for WWTPs biological N re- moval, with basically the same goals as ASM1. The ASM3 model was in- tended to become the new standard model, correcting for a number of defects that have appeared during the usage of the ASM1 model. The reason was that in 1985, when ASM1 was first published, computing power was still scarce. The simplest description possible saved computation time. Today, as computation is not limiting in simulation, a more realistic description of decay processes is introduced in ASM3: the major difference between the ASM1 and ASM3 models is that the latter recognises the importance of storage polymers in the heterotrophic activated sludge conversions. In the ASM3 model, it is assumed that all readily biodegradable substrate (SS) is first taken up and stored into an internal cell component (XSTO) prior to growth (see Fig. 2.1). The heterotrophic biomass is thus modelled with an internal cell structure, similar to the phosphorus accumulating organisms (PAOs) in the biological phosphorus removal models. The internal compo- nent XSTO is subsequently used for biomass growth in the ASM3 model.
Biomass growth directly on external substrate as described in ASM1 is not considered in ASM3.
A second difference between ASM1 and ASM3 is that the ASM3 model should be easier to calibrate than the ASM1 model. This is mainly achieved by converting the circular growth-decay-growth model, often called death- regeneration concept, into a growth-endogenous respiration model (Fig. 2.1).
The complexity of ASM3 is comparable to ASM1. There is a shift of emphasis from hydrolysis to storage of organic substrates, a process, which has been postulated and observed by many researchers. Characterization of the wastewater must consider this change. Readily available organic sub- strates (SS) should be estimated based on the storage rather than the growth process.
Figure 2.1: Substrate flows for autotrophic and heterotrophic biomass in the ASM1 and ASM3 models
ASM3 includes cell internal storage compounds what requires the biomass to be modelled with cell internal structure. Decay processes (which include predation) must include both fractions of the biomass, hence four decay processes are required (aerobic and anoxic loss of XH as well as XSTO) and the kinetics of the growth processes (aerobic and anoxic) must relate to the ratio of XSTO/XH.
Whereas in ASM1 effectively all state variables are directly influenced by a change in a parameter value, in ASM3 the direct influence is considerably lower thus ensuring a better parameter identifiability. Koch et al. [55] con- cluded that ASM1 and ASM3 are both capable of describing the dynamic behaviour in common municipal WWTPs, whereas ASM3 performs better in situations where the storage of readily biodegradable substrate is significant (industrial wastewater) or for WWTPs with substantial non-aerated zones.
The ASM3 model can be extended with a bio-P removal module.
2.2.3 Models including biological phosphorus removal
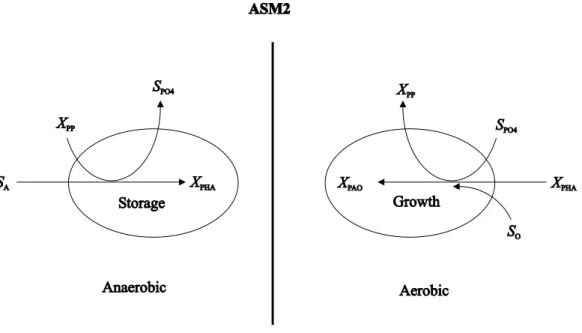
The overview of models including bio-P will start with the ASM2 model [39], which extends the capabilities of ASM1 to the description of biological phos- phorus removal. In addition, chemical P removal via precipitation was also included. The ASM2 publication mentions explicitly that this model allows description of bio-P processes, but does not yet include all observed phenom- ena. For example, the ASM2d model [40] builds on the ASM2 model, adding the denitrifying activity of PAOs which should allow a better description of the dynamics of phosphate and nitrate. Bio-P modelling in ASM2 is illus- trated in Fig. 2.2: the PAOs are modelled with cell internal structure, where all organic storage products are lumped into one model component (XPHA).
PAOs can only grow on cell internal organic storage material; storage is not depending on the electron acceptor conditions, but is only possible when fer- mentation products such as acetate are available. In practice, it means that storage will usually only be observed in the anaerobic activated sludge tanks.
Processes of phosphorus-accumulating organisms
It is assumed that PAO may release phosphate (SPO4) from poly-phosphate (XPP) and utilize the energy which becomes available from the hydrolysis in order to store cell external fermentation products (SA) in the form of
Figure 2.2: Substrate flows for storage and growth of PAOs in the ASM2 model
cell internal organic storage material (XPHA). (See left side of Fig. 2.2.) The process is primarily observed under anaerobic conditions. However, the process has also been observed under aerobic and anoxic conditions.
Storage of ortho-phosphate (SPO4) in the form of cell internal poly-phosphates (XPP) requires the PAO to obtain energy which may be gained from the res- piration of XPHA. The regeneration of poly-phosphates is a requirement for the growth of PAO, because the organic substrates are stored only upon the release of poly-phosphate.
These organisms are assumed to grow only at the expense of cell internal organic storage products (XPHA). As phosphorus is continuously released by the lysis of XPP, it is possible to assume that the organisms consume ortho- phosphate as a nutrient for the production of biomass. Growth of PAO is modelled as an obligate aerobic process. (See right side of Fig. 2.2.)
Whereas ASM1 was based entirely on COD for all particulate material, as
well as the total concentration of the activated sludge, ASM2 includes poly- phosphates, a fraction of the activated sludge which is of prime importance for the performance of the activated sludge process, but which does not exert any COD. For this reason, total suspended solids (TSS) is introduced in the model.
The TUDP model [7, 91] combines the metabolic model for denitrify- ing and non-denitrifying bio-P with the ASM1 model (autotrophic and het- erotrophic reactions). Contrary to ASM2/ASM2d, the TUDP model fully considers the metabolism of PAOs, modelling all organic storage components explicitly (XPHA and XGLY). The TUDP model was validated in enriched bio-P sequencing batch reactor laboratory systems over a range of sludge retention time values, for different anaerobic and aerobic phase lengths, and for oxygen and nitrate as electron acceptor [64].
Chapter 3
Aeration optimization of a wastewater treatment plant using genetic algorithm
The results introduced in this chapter are party based on the article Aer- ation optimization of a wastewater treatment plant using genetic algorithm published in the journal Optimal Control Applications and Methods [42].
This chapter discusses the aeration optimization problem of an intermit- tently aerated wastewater treatment plant by the application of a stochastic optimization approach, genetic algorithm (GA). In the alternating activated sludge process the alternating aerobic and anoxic conditions needed for nitro- gen removal is realized in a single basin by switching the aeration sequentially on and off. Since the operation of these plants may be challenging both for economical and technical reasons, several previous work have investigated the possibility of reduction of the operating cost, however, it turned out that for long-term application these methods can save only limited percent of the cost. Furthermore, these investigations also had to make problem simplifi- cations in order to use optimization methods which usually need significant computational effort to give – only a local optimum – of the problem. The