COVID-crisis and economic growth: Tendencies on potential growth in the European Union
P ETER HALMAI
1,2p1Faculty of Economics and Social Sciences, University of Technology and Economics, Budapest, M}uegyetem rkp. 3, H-1111, Hungary
2National University of Public Service, Budapest, Hungary
Received: July 4, 2021 • Revised manuscript received: July 23, 2021 • Accepted: August 15, 2021
© 2021 The Author(s)
ABSTRACT
The main objective of this paper is to identify the impacts of the COVID-crisis on growth, in particular on growth potential in the European Union (EU), in the context of a broader growth analysis. The quantitative analysis underlying this paper focuses on the financial and economic (“Great”) recession of 2008–2009, the subsequent recovery and the period of the COVID-crisis. We provide a detailed overview of some of the mechanisms of the COVID-crisis on growth.
The COVID-crisis is likely to have a direct impact on thelevelof potential output. A decrease in in- vestments and labour market hysteresis may have long-lasting effects on potential growth. The former would have a negative impact on productivity. This can lead to increased inequalities and have a negative effect on social cohesion. The future development of divergences among the EU Member States is particularly important. Their possible intensification could disrupt the functioning of the euro area and the internal market.
A lasting source of potential growth in the EU Member States could beproductivity growth. Its decisive structural factor is the growth dynamism oftotal factor productivity(TFP). There are large differences in this area with regard to the level and growth dynamism of performance of the Member States. Narrowing the output gapsvis-a-visthe front-runners through deep structural reforms could be a key factor in raising growth potential. The cleansing effects of crises, which force structural change and resource reallocation, can also create new opportunities for TFP growth.
KEYWORDS
European Union, economic growth, productivity
pCorresponding author. E-mail: halmai.peter@gtk.bme.hu; halmai.peter@uni-nke.hu
JEL CLASSIFICATION INDICES F15, F 42, F43, F45, F47, O47
1. INTRODUCTION
The 2008–2009 financial and economic crisis has had serious and long-lasting impacts on Europe’s growth performance and growth potential. The recovery from the double-dip recession was slow and differentiated. Some EU Member States (MSs) are still experi- encing persistent growth problems. In particular, the downward trend in the potential growth rate is significant. In many respects, the former shed new light by the global spread of the coronavirus crisis in the most recent period. In fact, both recessions are “great crises”, and the COVID-19 crisis initially led to a more severe downturn than the one before.
In view of the above, themain objectivesof the research carried out were:
– Examining the potential growth characteristics of the last 15 years using growth accounting methods at the level of the EU, the euro area and each of the main group of countries and key MSs levels;
– Identifying the impacts of the COVID-crisis on growth, in particular on growth potential.
The quantitative analysis underlying this paper focuses on the financial and economic (“Great”) recession of 2008–2009, the subsequent recovery and the period of the COVID- crisis. We provide a detailed overview of some of the mechanisms of the COVID-crisis on growth and the possible implications of the COVID-crisis on potential growth.
However, due to the nature of the issue, there is a considerable uncertainty in identifying the latter.
2. BACKGROUND: DECREASE IN THE POTENTIAL GROWTH RATE DYNAMISM IN THE EU
The actual growth trend reflects business (or other) cycles. Yet actual growth cannot be permanently disconnected from potential growth. The structurally sustainable economic per- formance, the equilibrium level of output, is expressed in terms of potential output and its sustainable dynamism in terms of growth potential. Statistics include data on actual growth.
Exploring data on potential growth requires complex quantitative analysis.
Growth accounting, the production function approach can be used to calculate potential growth. It focuses mainly on the supply side of the economy, the quantity and quality of labour, capital accumulation and total factor productivity (TFP) as the crucial drivers of output. The aim is to identify the effects of these drivers,decomposingthe output growth rate according to their impact.
The quantitative analysis underlying this paper covers twomain dimensions:first, the potential growth processes and models of the“old”(pre-2004)EU15 MSs1, based on longer data series;
second, those of the EU27 after the 2004–2007 enlargement, and of some relevant groups of countries within these countries. This, in addition to summarising the trends so far, could contribute to a comprehensive assessment of the impacts of the COVID-crisis on growth potential.
The database used2contains detailed data on the development of potential growth and its factors since 1981 for theEU15countries.3The production function approach can be applied in growth and catching-up research. For longer-term studies, it is necessary to highlight, for example, the significant and methodologically important research on ageing in the EU (e.g.,EC 2020c; 2021a). An example of a shorter-term approach and a medium-term extension is the growth accounting analysis recently updated several times a year by the Economic Policy Committee (EPC) Output Gap Working Group (OGWG)4.
Based on the data, a medium-term projection (covering the years 2022–2025) was also made, the results of which are also included in the database. In the figures with time dimension, a dashed vertical line in the 2008 and 2019 data indicates the threshold, the beginning of the
“Great Recession”.
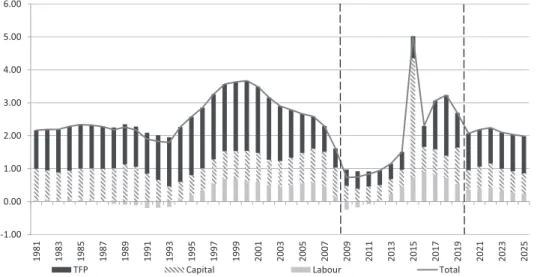
The rate of potential output growth of the EU15 steadily decreased since 2000.This decrease can be explained by the development of labour productivity.5The rate of labour productivity growth steadily declined since 1993. As the contribution of capital (K) to potential growth did not drop significantly until 2009 (fluctuating between 0.7% and 0.9% per year throughout),the structural factor behind the decrease in labour productivity was the unfavourable development of TFP. Its annual rate fell by about a third in three decades. The EU15’s growth model is summarised inFig. 1.
Large differences can be observed in the EU15 between the main characteristics of the examined country groups and growth models. The founding MSs, A6's growth model is also characterised by the above trends. However, the U5 country group has a high productivity performance. Recovery from the Great Recession needs to be highlighted: From 2015, the rate of potential growth has been 2.3–3.0% per year. The dominant factor of this dynamism is
1The EU15 countries are divided into three groups.–The Founding States(A6) are the six countries (DE, FR, IT, B, NL, L) that founded the European Economic Community (EEC) in 1958 (Continental European model).–“New”Member States(U6) are the more developed countries that joined the EEC and the EU in 1973 and 1995: the UK and IE, which belong to the Anglo-Saxon model, and DK, FI and SE, which belong to the Nordic model, andfinally AT. We have also examined the group of countries net of the UK data under the name of (U5).–Mediterranean Member States(M3), Greece (EL), which joined in 1981, and the Iberian countries (ES and PT), which joined in 1986 (Mediterranean model).
2The calculations were based on the panel data of the EPC (Economic Policy Committee) OGWG (Output Gap Working Group) database. The former provides detailed data on potential growth and its factors, including quantity of labour and productivity. Based on these data, a medium-term projection (covering the years 2022-2025) was also made, the results of which are also included in the database. The raw data are grouped, processed and analysed by the author.
3For the countries that joined the EU between 2004 and 2007 (EU12, and from the Central and Eastern European region:
EU10), data of similar quality are only available from 1995. The EU15 and EU12 together are the EU27, i.e., the Member States before 1 July 2013. These groups of countries will be analysed later in the study. However, the analyses do not include the newest EU member, Croatia (HR) (and thus the EU28). For HR, good quality growth accounting data are available only from 2003 onwards. For the longer period analysed, the EU data also include the UK. However, we have also analysed the groups of countries concerned net of the UK data.
4For details on its methodology seeDenis et al. (2006); D'Auria et al. (2010); Havik (2014); Elekes–Halmai (2019).
5We should note, however, that the contribution of L (labour factor) was positive throughout the period of 1985–2008.
productivity growth. The annual contribution of capital was 0.6–0.7% and TFP was 0.6–1.7%.
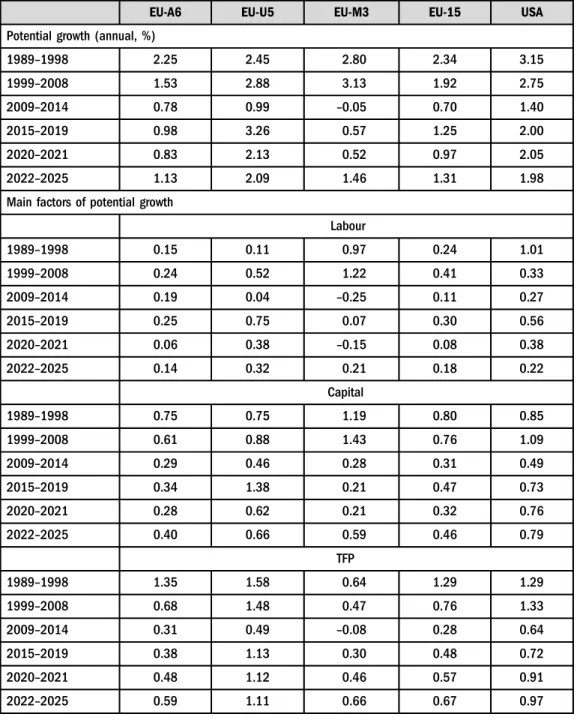
U5 has thus, essentially alone among the examined groups of countries, roughly reached the pre- crisis dynamism(Fig. 2andTable 1).
The last financial and economic crisis in the Mediterranean (M3) countries, which joined the EU in the 1980s, led to astructural breakin the potential growth conditions (Halmai–Vasary 2010, 2011, 2012). After a significant slowdown, the rate of potential growth was negative over the period of 2011–2014, and only exceeded 1% per year in 2019. The Great Recession, including the sovereign debt crisis that hit the examined country group particularly hard, resulted in a significant increase in capital costs and a decrease in the rate of capital accumulation. Between
-0.50 0.00 0.50 1.00 1.50 2.00 2.50 3.00
1981 1982 1983 1984 1985 1986 1987 1988 1989 1990 1991 1992 1993 1994 1995 1996 1997 1998 1999 2000 2001 2002 2003 2004 2005 2006 2007 2008 2009 2010 2011 2012 2013 2014 2015 2016 2017 2018 2019 2020 2021 2022 2023 2024 2025
TFP Capital Labour Total
Fig. 1.EU15's growth model (potential growth and its main factors)
-1.00 0.00 1.00 2.00 3.00 4.00 5.00 6.00
1981 1983 1985 1987 1989 1991 1993 1995 1997 1999 2001 2003 2005 2007 2009 2011 2013 2015 2017 2019 2021 2023 2025
TFP Capital Labour Total
Fig. 2.EU U5's growth model (potential growth and its main factors)
Table 1.Potential growth and its main components
EU-A6 EU-U5 EU-M3 EU-15 USA
Potential growth (annual, %)
1989–1998 2.25 2.45 2.80 2.34 3.15
1999–2008 1.53 2.88 3.13 1.92 2.75
2009–2014 0.78 0.99 –0.05 0.70 1.40
2015–2019 0.98 3.26 0.57 1.25 2.00
2020–2021 0.83 2.13 0.52 0.97 2.05
2022–2025 1.13 2.09 1.46 1.31 1.98
Main factors of potential growth
Labour
1989–1998 0.15 0.11 0.97 0.24 1.01
1999–2008 0.24 0.52 1.22 0.41 0.33
2009–2014 0.19 0.04 –0.25 0.11 0.27
2015–2019 0.25 0.75 0.07 0.30 0.56
2020–2021 0.06 0.38 –0.15 0.08 0.38
2022–2025 0.14 0.32 0.21 0.18 0.22
Capital
1989–1998 0.75 0.75 1.19 0.80 0.85
1999–2008 0.61 0.88 1.43 0.76 1.09
2009–2014 0.29 0.46 0.28 0.31 0.49
2015–2019 0.34 1.38 0.21 0.47 0.73
2020–2021 0.28 0.62 0.21 0.32 0.76
2022–2025 0.40 0.66 0.59 0.46 0.79
TFP
1989–1998 1.35 1.58 0.64 1.29 1.29
1999–2008 0.68 1.48 0.47 0.76 1.33
2009–2014 0.31 0.49 –0.08 0.28 0.64
2015–2019 0.38 1.13 0.30 0.48 0.72
2020–2021 0.48 1.12 0.46 0.57 0.91
2022–2025 0.59 1.11 0.66 0.67 0.97
Source: Own computation.
2011 and 2014, TFP did not contribute to potential growth in M3 average either. (The latter has been only 0.3–0.5% per year from 2016 onwards.) Labour productivity in M3 was the most unfavourable of all the examined country groups (Fig. 3and Table 1).
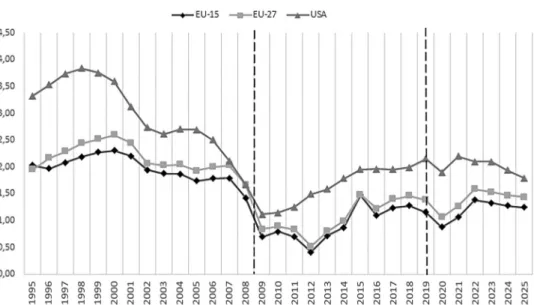
The rate of potential output growth of the US was higher than the EU15 average over the examined four decades. There was no catching-up potential for the EU15 average in the examined period (Fig. 4).
However, there are significant differences between countries. The typical trend in this respect isdivergence(Kreko–Oblath 2020). The rate of potential growth in theEU27declined steadily
-1.50 -1.00 -0.50 0.00 0.50 1.00 1.50 2.00 2.50 3.00 3.50 4.00
1981 1983 1985 1987 1989 1991 1993 1995 1997 1999 2001 2003 2005 2007 2009 2011 2013 2015 2017 2019 2021 2023 2025
TFP Capital Labour Total
Fig. 3.EU M3's growth model (potential growth and its main factors)
Fig. 4.Development of potential growth in the EU and the US
until 2012. In the period of 2015–2019 it ranged between 1.3 and 1.6%.This dynamism is little more than half of what it was a decade and a half earlier.The decisive factor is the unfavourable development of productivity. The contribution of capital and TFP did not recover from the depressed levels of 2009–2010 but remained at a persistently low level. (Those are about half of the previous contribution.) Labour market trends were also unfavourable (Mainly due to a significant slowdown in the rate of the working-age population growth.).These growth prospects also pose new challenges for real convergence.
Thecumulative effects ofall these factors are alsosignificant. For the EU15, based on the rate of potential growth between 2000 and 2007 preceding the crisis, potential growth in the years 2008–2018 reached a much more moderate level.As a result of the lower dynamism, potential output of the EU27 in 2018 was around 17.3% lower than the previous growth rate.(The same level effect was 16.9% for the EU15 and 27.1% for the EU12).
The financial crisis hit the MSs to different degrees. The symmetric shock had asymmetric consequences (Fig. 5). The intensity of the impact of the financial crisis in the EU countries depends on theinitial circumstancesand the associatedvulnerability.
The likelihood of thelasting effects on potential growthis much higher after the“great crises” than in the previous recessions. According to the simulations based on the production function methodology, these factorsmay lead to a decrease in the rate of potential growthin the EU MSs in themedium and long term, beyond the initial level effect.Yet, the cleansing effects of crises, which force structural change and resource reallocation, can also create new opportunities for TFP growth.
3. IMPACT MECHANISMS OF THE COVID-CRISIS
As a hugeexternal shock, the COVID-crisis has led to a deep recession in the global and Eu- ropean economies. The pandemic has economic spillovers. The COVID-shock affected the
-2.00 -1.00 0.00 1.00 2.00 3.00 4.00 5.00 6.00
1981 1983 1985 1987 1989 1991 1993 1995 1997 1999 2001 2003 2005 2007 2009 2011 2013 2015 2017 2019 2021 2023 2025
EU-A6 EU-U5 EU-M3 EU-15 USA
Fig. 5.Development of potential growth on average of analysed country groups
global economy mainly through the collapse of demand, labour supply and industrial output, supply chains, commodity prices, international trade and capital flows. The recovery in 2021 may be limited, as the collapse of some global value chains could have long-lasting effects. All this painted a gloomy picture for the EU and the euro area export markets at the start of the crisis. A fundamental question is: How long will the recession last?
The answer depends on the spread of the virus, the effectiveness of the control, and to a large extent on the efficiency of the economic policy response. The recession is likely to cause a lasting damage that will prevent an immediate return to pre-pandemic output levels. The recovery is unlikely to be quick (“V”shaped), but rather gradual (“U”shaped or worse) and uneven across the economies concerned.
The above-mentioned shocks were mixed with many additional ones:
– Liquidity shocks, – Uncertainty shock, – Financial sector shock.
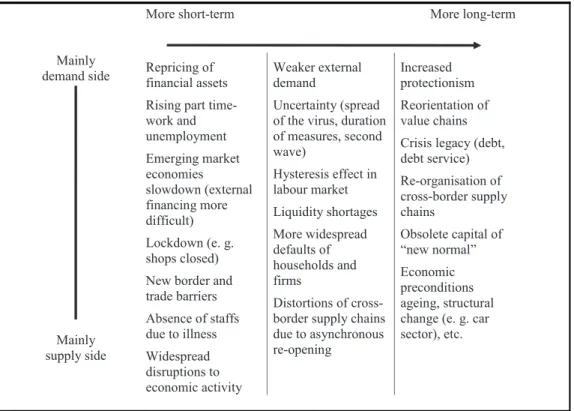
Unlike the financial crisis, the COVID-crisis immediately caused a shock in the real sector: a fall in production and income. These shocks were definitely global. The main impacts (Table 2) can be grouped in the following order.
Table 2. Selected economic effects of the COVID outbreak in Europe
More short-term More long-term
Mainly demand side
Mainly supply side
Repricing of financial assets Rising part time- work and unemployment Emerging market economies slowdown (external financing more difficult) Lockdown (e. g.
shops closed) New border and trade barriers Absence of staffs due to illness Widespread disruptions to economic activity
Weaker external demand
Uncertainty (spread of the virus, duration of measures, second wave)
Hysteresis effect in labour market Liquidity shortages More widespread defaults of households and firms
Distortions of cross- border supply chains due to asynchronous re-opening
Increased protectionism Reorientation of value chains Crisis legacy (debt, debt service) Re-organisation of cross-border supply chains
Obsolete capital of
“new normal”
Economic preconditions ageing, structural change (e. g. car sector), etc.
– Increased uncertainty. The pandemic and the large number of unknown factors create considerable uncertainty for businesses and consumers. These have an impact on spending and savings decisions (e.g., precautionary savings), as well as on recruitment and in- vestments.
– Decrease in labour supply.Strict containment measures necessarily lead to a decline in the available labour force. The labour supply is also affected by people’s health and the need to care for family members in the new circumstances (Leduc–Liu 2016; Baker et al. 2020).
– Collapse of sectors and supply shocks.Certain sectors (e.g., tourism6, air transport), regions and countries have been particularly hardly hit by distancing and forced restrictive measures.
In some sectors (e.g., car manufacturing), disruptions and breaks in global supply chains have caused major problems and significant downtime losses.
– Wider economic crashes.Depending on their severity and duration, the restrictive measures have, in some of the more severe cases, put pressure on the whole economy.
– Income losses, forced savings and lack of demand. Many employed people and households have suffered significant income losses. High precautionary savings also have a demand impact7.
– Liquidity shocks and financial market consequences. The immediate response of economic agents to the spread of the virus was a sudden repricing offinancial and real estate assets and the use of liquidity reserves. Growing market and sectoral difficulties have put pressure on the companies’ financial situation and profit outlook (e.g., liquidity shocks due to cash-flows).
This has led to a sharp fall in equity prices and a decrease in safe government bond yields.
Companies’ liquidity and solvency problems can cause serious disruptions in the financial system. Some of these effects are heterogeneous (country-specific). They often depend on the state of publicfinances and the ability of the state to bail out otherwise healthy companies that have been hit by the shocks. The situation of the banking sector and the specific economic structure (e.g., the size of the tourism sector) of the MSs add to the risk of structural divergence. This could weaken and fragment the EU’s single market.
A wide range ofeconomic policy measures are taken to limit the impacts of the pandemic.
The main objectives are:
– Direct treatment of health problems. To this end, strict and sometimes drastic measures (lockdowns, distancing, etc.) were adopted.
– Mitigating the economic impact of revenue, income and soaring liquidity. Central banks, governments and the EU are all providing support. An unprecedented mix of measures has been announced and implemented. Thefiscal policy measures announced by the MSs include discretionary policies with a direct impact on budgetary expenditure as well as the liquidity- oriented measures. The former can cover targeted tax cuts, shortened work schemes and partial or full public bank loan guarantees. All these measures are aimed at mitigating the effects of employment losses, avoiding a massive shutdown of investments, as well as bankruptcy spillovers and damage.
6In 2018, tourism made up 11.8% of GDP and 13.5% of employment in Spain, 8.0% and 9.8% in Portugal, 7.4% and 7.5%
in France and 6.8% and 10.0% in Greece (OECD 2020).
7See e.g.,Dossche–Zlatanos (2020); Davenport et al. (2020); Christensen et al. (2020).
– Public support for recovery.The ability to respond depends on the countries’initial conditions, financial strength and the political space. COVID has had a serious impact on some countries without a fiscal space to respond. Differences in national responses can cause asymmetric disparities. These can spill over because of the strong interdependence between the MSs. They could weaken the EU’s overall recovery and lead to an economic divergence in the future.
There is an essential need for an adequate level of intervention at the EU level.
It should be highlighted that COVID has caused a global shock, simultaneously affecting the external environment with consequences across regions. Just like the global financial crisis, this shock hits various countries and regions around the world. This has and will have consequences for the severity of shocks to the EU economy (e.g., through foreign inputs that may be missing, or through lower demand for EU exports). As the exposure to the external environment varies from country to country, additional country-specific characteristics may emerge.
The economic effect of COVID is highly complex and varies widely (Barro et al. 2020;
Boissay–Rungcharoenkitkul 2020). Economic impacts affect supply and demand differently in different time dimensions. The duration of the effects depends on the duration of the pandemic as well as on other factors: how trade policies, globalisation attitudes, consumer behaviour, working methods and production chains are stabilised. The accumulation of debt during the recession has a lasting impact on companies, investors’risk perceptions and the banking sector (non-performing loan ratio). Pre-existing economic conditions and the impact of the pandemic may prolong some effects.
4. SOME CHARACTERISTICS OF THE COVID-CRISIS
The potential impacts are extremely complex and interlinked. The following factors require particular attention.
4.1. Decline and subsequent recovery
The downturn caused by the pandemic was an enormous and sudden change. It can be described as a unique event because the deliberate reduction of economic performance stems from the public health obligations, rather than the accumulation of cyclical surpluses. It is not the result of the inadequate evaluation of financial assets; the weakness of the financial sector;
the size of government debt or debt sustainability considerations; or the over-expansion of the construction sector. This situation provides central banks and fiscal authorities with opportu- nities that they do not have in typical recessions. At the same time, this poses challenges in terms of the most effective policy instruments, e.g., what measures might be effective in supporting aggregate demand in a situation of supply constraints and containment measures.
Recovery does not depend on an adjustment phase that would first have to correct the previous cycle or structural surpluses. There was hope that the recovery could start sooner than in a normal recession. Recovery will depend primarily on gaining control of the pandemic and the duration of the containment measures put in place to achieve this. After lifting the containment measures (“hibernation”),“warming up”, together with a certain level of“rebound optimism”, seemed less difficult.
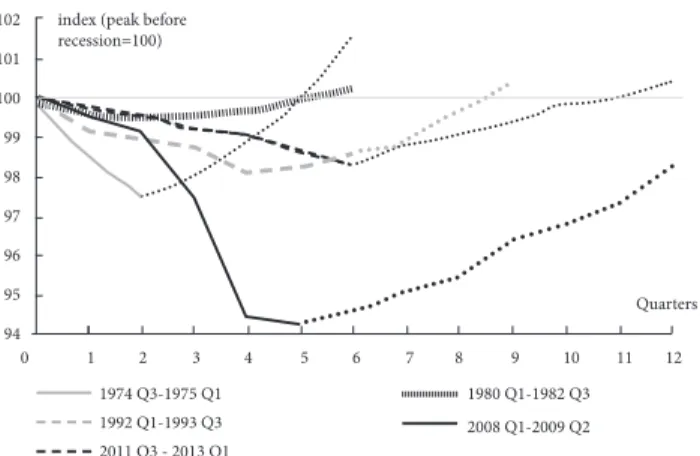
A very quick, “V-shaped” recovery was seen as a unique opportunity. As in previous (“normal”) recessions, it took some time for the euro area to return to pre-recession GDP levels, especially after the greatfinancial and economic recession (Fig. 6).
The speed of GDP recovery depends on the duration of the containment and the compo- sition of the containment measures that remain in place. The duration of the containment measures is determined primarily by the characteristics of the virus and health considerations.
At the beginning of the pandemic, there was very little information available on the former.
However, information is limited as newer virus variants spread. Yet, the longer the lockdown lasts, the more companies may face liquidity and solvency problems, and even bankruptcy. At the same time, more workers could lose their jobs and more damaged assets could weigh on the bank balance sheets8. The longer shops are closed and consumers do not shop, the more consumption is permanently lost. The longerfiscal authorities have to keep companies afloat, the more relevant debt sustainability issues may become.
4.2. Impacts and scenarios
The results modelling the impacts of the pandemic depend largely on the assumptions about the pandemic, its duration and depth. By working on certain assumptions, models can provide valuable information on economic processes and the links between shocks and growth in private consumption and investment (Pollit 2020). Scenarios can be developed to illustrate how the EU economy could be affected by the pandemic and the recovery from the bottom of the crisis, and what happens once the virus has been stopped (Pfeifer et al. 2020).
102 101 100 99 98 97 96 95 94
0 1 2 3 4 5 6 7 8 9 10 11 12
index (peak before recession=100)
Quarters
1980 Q1-1982 Q3 2008 Q1-2009 Q2 1974 Q3-1975 Q1
1992 Q1-1993 Q3 2011 Q3 - 2013 Q1
Note: Peak-to-trough, dates as identified by the CEPR Business Cycle Dating Committee (straight lines), recoveries shown until return to prior peak (dotted line).
Source: AWM database, EU Forecast 2020 Spring (p. 17).
Fig. 6.Recessions and rebounds in the Eurozone Recessions and rebounds in the euro area, real GDP, 1970 Q1–2019 Q4
8Increased debt can also hamper recovery (Becker et al. 2020).
The various scenarios could include possible outcomes of the pandemic. Potential impacts depend to a large extent on the length of the lockdown period, the containment measures taken and the effectiveness of the policy response. It is essential to take into account the uncertainties surrounding the former.
The EC calculated that if no discretionary policy measures had been taken, i.e., only auto- matic stabilisers had had an impact, GDP in the EU would have fallen by around 13% in 2020 compared to a situation without the pandemic, and a recovery of around 10% would have been possible in 2021 (EC 2020a). About half of this decline was explained by demand shock, onefifth by supply and liquidity shocks, and the remainder by uncertainty shock. However, in the baseline scenario, including the effects of the planned discretionary policy measures, the pandemic would have led to an 8% fall in GDP in 2020, much smaller than indicated above, and to a 6% recovery in 2021. The more favourable outcome in the latter was mainly due to discretionary spending and public guarantees provided to undertakings.
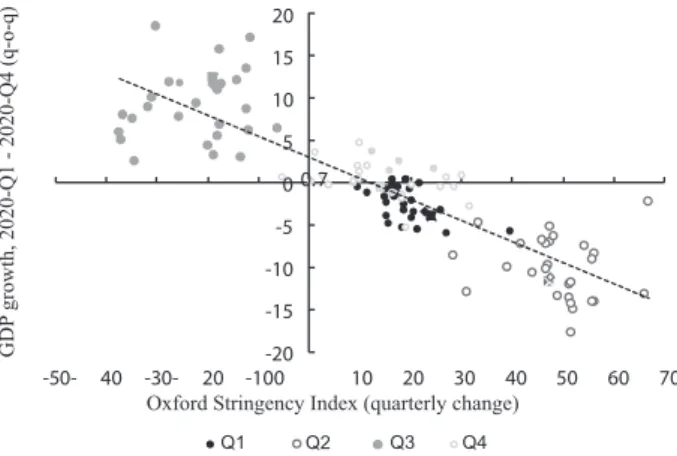
The introduction of free movement restrictions resulted in a wave of supply and demand shocks that affected the European economy. Between March and May 2020, these restrictions caused a 45% reduction in mobility compared to the pre-pandemic levels (EC 2020b). Indicators suggest that the euro area economy operated at 25–30% below capacity at the height of the crisis in April 2020. Lost output in services, especially in travel and tourism, is unlikely to be replaced (Schuler 2020).
The economic consequences of the COVID pandemic and the containment measures put in place are without precedent (Fig. 7). At the height of the pandemic, the latter led not only to travel restrictions, but also to a near-complete lockdown of social and economic life.
4.3. Asymmetric recovery, with divergence between the Member States
While many MSs have entered recession as a result of the collective shock, the impact on recession is heterogeneous. The MSs are likely to emerge from it in an asymmetric way, through
GDP growth, 2020-Q1 - 2020-Q4 (q-o-q)
Oxford Stringency Index (quarterly change)
Q1 Q2 Q3 Q4
Source: Oxford Government Response data, European Commission, EU Forecast 2021 Spring (p. 8).
0.7
-20 -15 -10 -5 0 5 10 15 20
-50- 40 -30- 20 -100 10 20 30 40 50 60 70
Fig. 7.Oxford Stringency Index and GDP, quarterly developments, EU Member States, 2020
a wide dispersion of the recovery paths (Fig. 8). The former reflects the different timing of introduction and lifting of the containment measures, the structure of the economy, in particular the importance of tourism and leisure activities, and the size and effectiveness of the policy response (Battistini –Stoevski 2021; Furceri et al. 2021). The crisis-induced reduction in in- vestment also varied considerably between the MSs. Significant differences exist and persist between the MSs, reflecting pre-existing vulnerabilities.
4.4. Severe restrictions, trust. Light at the end of the tunnel?
In the short-term, the COVID pandemic will continue to shape the path of the EU economy. At the same time, the acceleration of the vaccination campaign may create the opportunity for a return to more normal conditions in the next period. But the crucial questions remain: How long the vaccines used so far can prevent infection, and how virus variants can limit the effectiveness of the vaccines? Will there be a need for further vaccination of those already vaccinated, or for more stringent and permanent restrictions than previously thought? The pandemic remains a global threat until the vast majority of the population is immune to the virus.
The severe restrictions, reintroduced in Autumn 2020, once again led to the EU economy falling into a recession. However, the decline in economic activity was much more moderate than in the first half of 2020. The period from the third quarter of 2020 to the first quarter of 2021 saw a cumulative decline of 0.9% in GDP in the EU. In the first two quarters of 2020, the same rate, however, was 14.2%. There was a significant change in the Oxford Stringency Index and in real GDP in the first wave (Fig. 7). These factors were shown to have a less substantial impact during the second and third waves of the pandemic. Households and businesses seem to have adapted much better to the restrictions and their consequences (Among the latter, to social Fig. 8.GDP levels compared to 2019 Q4
distancing, including working from home and being online.). Continued strong economic policy support has also underpinned growth from the second half of 2020 onwards, through the rebuilding of global output and trade.
In 2021, the Commission’s Economic Sentiment Indicator (ESI) has been significantly above its long-term average and pre-pandemic level for thefirst time since the outbreak of COVID.
Growth was broad-based across the business sectors and consumers reviewed (EC 2021b).
5. GROWTH PROSPECTS
Economic development in the EU now depends to a large extent on the success of vaccination programmes in controlling the pandemic. Other factors include external (global economic) environment, continued adequate economic policy support, response of households and busi- nesses, and the extent of lasting damage caused by the crisis.
Economic developments are closely linked to the characteristics of the pandemic, e.g., inflation rates, pressures on the health system, and the duration and severity of the containment measures. There are still considerable uncertainties about all these.
There may be differences in the approaches of the MSs to removing restrictions. Some place more emphasis on the overall inflation target than others. At the height of the pandemic, the main goal of the EU governments was to reduce pressure on the health system. As a result of the improving vaccination coverage of the most vulnerable groups, containment measures can be reduced. There is a“gradual thawing”in the most restricted sectors. However, the return and rapid spread of the virus variants in Europe is a major public health concern and risk. The need for renewed protection is essential: both because of its time-limited nature and of virus variants.
5.1. Economic policy stimulus
The COVID pandemic has triggered a political response in the EU, this response is without precedent both in its scale and scope. It involves highly accommodative monetary policy and increased government support in the form of Job Retention Schemes, guarantees, repayment moratoria, tax cuts, subsidies and transfers of various kinds; as well as legal and regulatory adjustments to protect employees (e.g., prohibition of dismissal) and businesses (suspension of insolvency-related events). Most of the former are designed to be temporary, as the return to economic normalcy requires the economy to wean off policy support before undesirable side effects occur (e.g., market distortions and obstacles to exit for inefficient companies). Support should continue until the recovery takes hold, to avoid a policy cliff' effect.
The political focus is gradually shifting from emergency support to sustaining the recovery.
The direct objective is to mitigate the social impacts of the coronavirus pandemic. Indeed, the medium-term goal is to raise potential growth. It can make the European economies and so- cieties more sustainable, more resilient and better prepared for the opportunities of a green and digital transformation.
5.2. External and internal conditions in flux
The external conditions for growth opportunities in the EU’s open economies could be more favourable than before. Significant revisions to the global growth outlook have become
necessary, especially for emerging Asia and the United States. Additional fiscal stimulus is employed in the United States.
Changes in household savings and consumption patterns are essential as the pandemic recedes.If restrictions are eased and uncertainty reduces, the reasons for an increase in savings will disappear.
The timing and extent of the reversal of exceptionally high levels of household savings (both compulsive and precautionary) are important questions for the recovery of domestic demand, especially of private consumption. Private consumption can rise again in 2021 and 2022 for a number of reasons. Yet this progress does not make it possible to compensate for all the shortfalls.
5.3. Potential impacts of a persistent pandemic
The longer the pandemic lasts, the harder it is to avoid the negative consequences in future years.
The full extent of permanent output and labour market losses due to the pandemic crisis is difficult to predict (Bodnar et al. 2020). Past epidemics do not provide clear guidance for the analysis. Those were largely localised events. They cannot be compared to the great global pandemic (Donadelli et al. 2021). Furthermore, government support measures have significantly mitigated the negative effects of the pandemic on businesses and workers. The implications of the crisis become visible only after the economy opens up again and political support is withdrawn.
5.3.1. Crisis may reduce capital accumulation.
The crisis caused by the pandemic discour- aged investment through falling demand and rising uncertainty. The former may have a long- lasting effect on potential output. Real risk: high level of corporate distress will result in a further fall in investment. In this respect, it is important to guard against the consequences of the crisis in terms of corporate solvency and bankruptcies. So far, policy measures have protected com- panies from the insolvency caused by COVID. (E.g., various forms of corporate liquidity sup- port, public loan guarantees, debt repayment moratoria, wage subsidies, temporary changes to insolvency procedures.). Yet, it is difficult to predict the size of corporate bankruptcies in the post-emergency policy period.5.3.2. Labour market effects, growing inequality.
As the crisis was particularly severe in the labour-intensive sectors, its impact on the labour market may be extremely strong compared to other (financial) crises. The permanence of employment losses may depend on the speed of reopening of the activities affected by restrictions and on the necessary reallo- cation of workers between sectors and companies. The pandemic can lead to a permanent reduction in labour supply, resulting in a decreasing level of skills and in worker discour- agement. The global migration process, which is more limited than in the past, also has a similar effect for the developed countries. At the same time, the crisis may make it even more difficult for young people to enter the labour market9. Automation, especially in industry, and more widespread teleworking can permanently reduce demand for certain low-paid occupa- tions, exacerbating income inequalities (Chernoff – Warman 2021; Bergeaud – Ray 2021;Autor–Reynolds 2020).
9Job vacancy rate in the EU fell from 2.2% in the fourth quarter of 2019 to 1.6% in the second quarter of 2020 and has recovered only slowly. For the impacts of the pandemic, seeForsyte et al. (2020).
5.3.3. Total factor productivity (TFP).
The crisis can affect TFP in many ways. It can keep resources in the non-productive sectors. For example, if support measures keep non-viable companies afloat, the reallocation of productive resources in the fast-growing sectors takes time.Lower R&D spending can lead to a modest level of innovation. Increased uncertainty in the private sector may stifle innovation. Reshoring of global value chains after the crisis can hamper innovation and knowledge spillovers between countries. Furthermore, prolonged school closures could have a negative impact on future human capital in the longer term. At the same time, the crisis has accelerated the increased use of digital technologies, which can promote structural transformation of the economy and contribute positively to TFP growth.
As the recovery progresses, there will be a shift in policy from protecting businesses and jobs to using resources more efficiently. The more successful the reallocation and modernisation of the EU economy is (e.g., through the Next Generation EU fund and Recovery and Resilience Mechanism (NGEU/RRF)), the more the lasting damage caused by the pandemic can be reduced, also through the responses to the pandemic (e.g., through digitalisation and automation).
6. COVID-CRISIS AND POTENTIAL GROWTH
Bodnar et al. (2020)give an overview on the theory and effects of COVID on the Eurozone’s potential output. There are several reasons to think that COVID may have persistent effects.
1. A collapse of the supply chain can cause a decline in the economy’s capacity. Question:
How long will this effect last? Vinci–Licandro (2020) pointed out the role of monetary policy in preventing the destruction of productive capacities following the domestic negative shocks.
2. It will take time for new entrants to replace companies that failed due to the pandemic.
3. Unemployment tends to be persistent if workers’skills and their attachment to the labour market deteriorates.Fatas–Summer (2017)provided an empirical evidence of this hysteresis effect.
4. High corporate debt overhang may create“zombie companies”with less incentives to invest in productive capital. However, Jorde et al. (2020), found no past evidence of post-crisis growth conditional on corporate debt levels.
5. In a sense, low demand has an alarming effect on the economy due to small investment in capital or innovation, whether the recession originated from the supply or demand side (Benigno –Formaro 2018; Formaro –Wolf 2020).
6. Pessimistic forecasts of long-term growth can be self-fulfilling. Policymakers are more likely to pursuefiscal consolidation if they foresee permanent output losses. This, in turn, can lead to a fall in GDP due to lower demand (Heimberger 2020).
Paradoxically, however, COVID may even increase the economy’s long-term growth po- tential. It can accelerate the deployment of new technologies. It could force an improvement of the health system and a further increase in health investments.
It is difficult to predict the lasting damage caused by COVID. According toPujol (2020), overall, a permanent loss of 3–4% in (the level of) GDP is possible, with significant differences among the countries. The EC suggests that the COVID-crisis will have no impact on long-term growth. In June 2020, the World Bank’s Global Economic Prospects (WB 2020) projected that
the euro area GDP will not recover to its pre-pandemic level until the second half of 2023. The UK Office of Budget Responsibility forecasts a 2% drop in productivity and a 1% decrease in the labour supply, amounting to a 3% fall in the level of potential GDP. Again, this means a decline in the level of potential GDP, rather than a trend. (The latter forecast’s broad alternative sce- narios range from 0–6%.)
The above may also be supported by the review of the CfM–CEPR European panel of experts in December 2020 (Ilzezki (2021). A majority of the 43 panellists (51%) believe that the level of potential GDP could be 2–5% lower in 2025 than it would otherwise be in the absence of COVID.
So, a permanent loss in income is predicted due to COVID. The vast majority of the panel members (81%) believe that COVID will have no impact on the rate of potential growth in Europe.
Most of the participants were optimistic about the opportunities that lie ahead. In addition to the negative effects of the crisis, the potential for Schumpeterian creative destruction was highlighted.
Simulations based on the production function approach suggest that the potential annual growth rate of the EU15 in 2020 and 2021 is barely half that of the US. Most of the difference is explained by the different dynamism of productivity growth. At the same time, the rate of potential growth of theU5in the EU has consistently exceeded the dynamism of US since 2014 and even during the COVID-crisis. Their productivity dynamism is similar to that of the United States. (Within that, the contribution of capital accumulation is slightly bigger for the US, while that of TFP is slightly higher for the EU-U5.) The dynamism of potential growth is simulated to return to the 2015–2019 level between 2022 and 2025 (Table 1).
The potential annual growth rate of the “developed” EU MSs10 has been well above the dynamism of the Mediterranean (M3) MSs since 2009. Thisdivergence caused serious distur- bances in the functioning of the euro area and its lack of desirable homogeneity. The disparity, the divergence persists even during the COVID-crisis. Its major reason is the unfavourable development of productivity. Between 2022 and 2025, M3 will again reach the average dyna- mism of potential output of the“developed”EU MSs. However, no convergence capacity can be observed for M3 during the last indicated period.
Figs. 2 and 3 give an illustrative picture of the growth models of the two groups of MSs mentioned above (U5andM3). The potential growth of theU5countries has approached their growth performance of the previous period after years of recovery following the Great Recession, the financial and economic crisis of 2008–2009. Its determining factor is productivity, pre- dominantly TFP (Fig. 2). In contrast, the M3 countries experienced a dramatic structural break after 2008, with productivity growth stalling for many years. Simulations show that the latter can regain momentum between 2022 and 2025 (Fig. 3). Yet this productivity growth will not compensate for the last decade. In fact, even the divergence between the Mediterranean and
“developed”EU MSs is not expected to diminish over the period.
The trends for the“new”MSs of Central and Eastern Europe are different in several respects (Table 3).
According to the simulations presented,a decrease in the dynamism of potential growth due to the COVID-crisis is not permanent.From 2022 onwards, the dynamism of potential growth in the EU and the average of the examined main groups of countries could return to the pre-2020 levels (Fig. 4). However, the COVID-crisis may causea persistent level effect. Under the basic
10EU15 Member States without M3 and IT.
“Developed”Member States EU-10 BG CZ EE LT LV HU PL RO SK SI Potential growth (annual, %)
1999–2008 2.09 3.77 4.02 3.28 5.05 5.40 5.87 3.27 4.20 4.33 4.84 3.34
2009–2014 1.03 2.07 1.49 1.31 1.30 1.40 0.27 0.53 3.82 1.81 2.73 1.58
2015–2019 1.55 2.90 2.60 2.57 3.74 3.31 2.54 2.96 3.22 4.10 2.20 1.17
2020–2021 1.12 2.82 2.21 1.98 3.21 3.33 2.81 3.37 3.06 3.23 2.54 2.68
2022–2025 1.34 2.73 1.91 1.96 2.86 2.34 2.01 3.08 3.45 2.84 2.67 3.27
Main factors of potential growth
Labour
1999–2008 0.32 –0.13 0.63 –0.09 –0.05 –0.09 –0.17 –0.48 0.04 –1.32 0.17 0.16
2009–2014 0.32 0.02 –0.87 –0.03 –0.18 –0.37 –0.93 0.21 0.50 –0.84 0.43 0.05
2015–2019 0.46 0.12 0.23 0.57 0.24 0.43 –0.28 0.95 0.01 –0.06 –0.11 0.15
2020–2021 0.21 –0.13 0.11 –0.02 –0.11 –0.23 –0.22 0.54 –0.57 –0.30 –0.26 1.12 2022–2025 0.21 –0.32 –0.39 –0.16 –0.31 –0.92 –0.97 0.39 –0.45 –0.68 –0.55 0.98 (continued)
ActaOeconomica71(2021)S1,165–186
“ ”
Capital
1999–2008 0.61 1.22 1.53 0.99 2.54 1.87 2.85 1.28 1.17 1.32 0.69 1.46
2009–2014 0.29 1.06 1.17 0.60 1.27 0.93 0.80 0.47 1.75 1.38 0.75 0.43
2015–2019 0.34 1.02 0.75 0.68 1.45 1.57 0.83 1.20 1.35 1.08 1.18 –0.22
2020–2021 0.28 1.08 0.71 0.63 1.53 1.72 1.13 1.46 0.95 1.88 1.06 0.19
2022–2025 0.40 1.14 0.90 0.73 1.29 1.33 1.05 1.32 1.20 1.57 1.30 0.87
TFP
1999–2008 1.13 2.68 1.87 2.38 2.56 3.61 3.19 2.47 2.99 4.33 3.99 1.72
2009–2014 0.38 0.99 1.19 0.74 0.21 0.85 0.39 –0.15 1.57 1.26 1.55 1.10
2015–2019 0.50 1.75 1.62 1.31 2.04 1.31 2.00 0.81 1.86 3.07 1.13 1.24
2020–2021 0.52 1.87 1.39 1.37 1.79 1.85 1.89 1.37 2.68 1.65 1.74 1.37
2022–2025 0.64 1.91 1.41 1.39 1.88 1.94 1.93 1.37 2.70 1.95 1.91 1.42
Source: Own computation.
mica71(2021)S1,165–186183
assumptions of the simulation (including unchanged policies), this loss cannot be compensated in the years following the crisis.
7. SOME CONCLUSIONS
The likelihood oflasting effects on potential growthis much higher after the“great crises”than in the previous recessions. These factorsmay also lead to a decrease in the rate of potential growthin the EU MSs in themedium and long term, beyond the initial level effect. The COVID-crisis is likely to have a direct impact on the levelof potential output. A key question is: Will there be lasting impacts on Europe’s growth potential? A decrease in investments and labour market hysteresis may have long- lasting effects on potential growth. The former would have a negative impact on productivity. This can lead to increased inequalities and have a negative effect on social cohesion. The future devel- opment of divergences among the EU MSs is particularly important. Their possible intensification could disrupt the functioning of the euro area and the internal market. At the same time, a possible new wave (or waves) of the pandemic would result in another external shock. Avoiding the former could be an essential political priority. Moreover, building on the experience gained so far, in the event of a new wave of the pandemic, adequate policies could successfully mitigate possible output losses.
A lasting source of potential growth in the EU MSs could beproductivity growth. Its decisive structural factor is the growth dynamism of TFP. There are large differences in this area with regard to the level and growth dynamism of performance of the MSs. Narrowing the output gaps vis-a-vis the front-runners through deep structural reforms could be a key factor in raising growth potential.
Yet, the cleansing effects of crises, which force structural change and resource reallocation, can also create new opportunities for TFP growth. Rapid reallocation of resources can mitigate the loss of growth potential. Rapid structural change can be promoted by integration into the global and continental value chains. Reallocation disturbances can in turn lead to poorer use of resources and higher unemployment.
Identifying potential growth and growth potential is a key condition for shaping and implementing appropriate policies (policy mix). The projections of potential growth shown assume unchanged policies. The adverse trends can in principle be counteracted or at least mitigated through substantial changes in the macroeconomic policies and the implementation of deep structural reforms.An analysis of the determinants of growth potential can help underpin the crucially important structural reforms and macroeconomic adjustments.
ACKNOWLEDGEMENT
The study is made within the research programme of the Hungarian Academy of Sciences, focused on post-COVID (No. 2021-25).
REFERENCES
Autor, D.–Reynolds, E. (2020): The Nature of Work after the COVID Crisis: Too Few Low-Wage Jobs.
Washington, DC: The Brookings Institution.
Baker, S. R.–Bloom, N.–Davis, S. J.–Terry, S. J. (2020): COVID-Induced Economic Uncertainty. NBER Working Paper, No. 26983, April.
Barro, R. J.–Ursua, J. F.–Weng, J. (2020): The Coronavirus and the Great Influenza Pandemic: Lessons from the ‘Spanish Flu’ for the Coronavirus’ Potential Effects on Mortality and Economic Activity.
NBERWorking Paper, No. 26866, March.
Battistini, N.–Stoevsky, G. (2021): The Impact of Containment Measures Across Sectors and Countries during the COVID-19 Pandemic. ECB Economic Bulletin, No. 2, March.
Becker, B.–Hege, U.–Mella-Barral, P. (2020):Corporate Debt Burdens Threaten Economic Recovery after COVID-19: Planning for Debt Restructuring Should Start Now. VoxEU, 21 March.
Benigno, G.–Fornaro, L. (2018): Stagnation Traps.The Review of Economic Studies, 85(3): 1425–1470.
Bergeaud, A.–Ray, S. (2021):The Economic Transformations Linked to Teleworking. Banque de France, Eco Notepad, No. 199.
Bodnar, K.–Le Roux, J.–Lopez-Garcia, P.–Sz€orfi, B. (2020): The Impact of COVID-19 on Potential Output in the Euro Area.ECB Economic Bulletin, 7: 42–61.
Boissay, F.–Rungcharoenkitkul, P. (2020):Macroeconomic Effects of COVID-19: An Early Review. BIS Bulletin, No. 7, April 17.
Chernoff, A.–Warman, C. (2021):Down and Out: Pandemic-Induced Automation and Labour Market Disparities of COVID-19. VoxEU, 02 February.
Christensen, A. K.–Maravalle, A.–Rawdanowicz, L. (2020): The Increase in Bank Deposits During the COVID-19 Crisis: Possible Drivers and Implications.ECOSCOPE(OECD): December 10.
D'Auria, F.–Denis, C.–Havik, K.–Mc Morrow, K.–Planas, C.–Raciborski, R.–R€oger, W.–Rossi, A.
(2010):The Production Function Methodology for Calculating Potential Growth Rates and Output Gaps.
European Economy, Economic Papers, No. 420. July, Brussels.
Davenport, A.–Joyce, R.–Rasul, I.–Waters, T. (2020):Spending and Saving During the COVID-19 Crisis:
Evidence from Bank Account Data. Institute for Fiscal Studies, IFS Briefing Note, No. 308, October.
Denis, C.–Grenouilleau, D.–McMorrow, K.–R€oger, W. (2006): Calculating Potential Growth and Output Gaps –A Revised Production Function Approach. European Commission, DG EFAEconomic Papers, No. 247.
Donadelli, M.–Ferranna, L. –Gufler, I. –Paradiso, A. (2021): Using Past Epidemics to Estimate the Macroeconomic Implications of COVID-19: A Bad Idea!Structural Change and Economic Dynamics, 57, June, pp. 214–224.
Dossche, M.–Zlatanos, S. (2020): COVID-19 and the Increase in Household Savings: Precautionary or Forced?ECB Economic Bulletin, No. 6.
Elekes, A.–Halmai, P. (2019): How to Overcome the Crisis of the European Growth Potential? The Role of the Government.European Journal of Comparative Economics, 16(2): 313–334.
European Commission (EC) (2020a): European Economic Forecast Spring 2020. European Economy Institutional Paper, No. 125, DG ECFIN, Brussels.
European Commission (EC) (2020b): European Economic Interim Forecast Summer 2020. European Economy Institutional Paper, No. 132, DG ECFIN, Brussels.
European Commission (EC) (2020c): The 2021 Ageing Report: Underlying Assumptions & Projection Methodologies. European Economy Institutional Paper, No. 142, DG ECFIN, Brussels.
European Commission (EC) (2021a): The 2021 Ageing Report. Economic & Budgetary Projections for the EU Member States (2019-2070).European Economy Institutional Paper, No.148, DG ECFIN, Brussels.
European Commission (EC) (2021b): European Economic Forecast Spring 2021. European Economy Institutional Paper, No. 149, DG ECFIN, Brussels.
Fatas, A.–Summers, L. H. (2017): The Permanent Effects of Fiscal Consolidations.Journal of International Economics, 112: 238–250.
Fornaro, L. – Wolf, M. (2020): COVID-19 Coronavirus and Macroeconomic Policy: Some Analytical Notes.VOXEU–CEPR, 10 March.
Forsythe, E.–Kakhn, B. L.–Lange, F.–Wiczer, D. (2020): Labor Demand in the Time of COVID-19:
Evidence from Vacancy Postings and UI Claims. NBERWorking Paper, No. 27061.
Furceri, D.–Ganslmeier, M.–Ostry, J. D.–Yang, N. (2021): Initial Output Losses from the COVID-19 Pandemic: Robust Determinants. IMFWorking Paper, No. 21/18, January.
Halmai, P.–Vasary, V. (2010): Growth Crisis in the EU: Challenges and Prospects, Intereconomics.Review of European Economic Policy, 45(5): 329-336.
Halmai, P.–Vasary, V. (2011): Crisis and Economic Growth in the EU: Medium and Long-Term Trends.
Acta Oeconomica, 61(4): 465–485.
Halmai, P.–Vasary, V. (2012): Convergence Crisis: Economic Crisis and Convergence in the European Union.International Economics and Economic Policy, 9(3): 297–322.
Havik, K.–Mc Morrow, K.–Orlandi, F.–Planas, C.–Raciborski, R.–R€oger, W.–Rossi, A.–Thum- Thysen, A.–Vandermeulen, V. (2014): The Production Function Methodology for Calculating Po- tential Growth Rates & Output Gaps. European Economy Economic Papers, No. 535 November, Eu- ropean Commission DG ECFIN.
Heimberger, P. (2020): Potential Output, EU Fiscal Surveillance and the COVID-19 Shock.Intereconomics, 55(3): 167–174.
Ilzetzki, E. (2021): Post-COVID-19 Potential Output in the Euro Area.VOXEU-CEPR, 02 January.
Jorda, O. –Kornejew, M.– Schularick, M.– Taylor, A. M. (2020): Zombies at Large: Corporate Debt Overhang and the Macroeconomy. CEPRDiscussion Paper, No. 15518.
Leduc, S.–Liu, Z. (2016): Uncertainty Shocks Are Aggregate Demand Shocks.Journal of Monetary Eco- nomics, 82: 20–35.
Kreko, J.–Oblath, G. (2020): Economic Growth and Real Exchange Rate Misalignments in the European Union.Acta Oeconomica, 70(3): 297–332.
OECD (2020):Tourism Trends and Policies. Paris.
Pollitt, H. (2020): Coronavirus: How to Model the Economic Impacts of a Pandemic.Cambridge Economics Blog, 10 March.
Pujol, T. (2020): The Long-Term Economic Cost of COVID-19 in the Consensus Forecasts. COVID Economics, 44.
Pfeiffer, P. – Roeger, W. – in’t Veld, J. (2020): The COVID19-Pandemic in the EU: Macroeconomic Transmission & Economic Policy Response.European Economy Discussion Paper, No. 127, DG ECFIN, Brussels.
Schuler, T. (2020): Impact of the COVID-19 Lockdown on Trade in Travel Services. ECB Economic Bulletin, 4, June, pp. 46–50.
Vinci, F.–Licandro, O. (2020): Switching-Track after the Great Recession. CFCMWorking Paper, No. 02/2020.
World Bank (2020): Global Economic Prospects, June 2020. Washington, DC.https://openknowledge.
worldbank.org/handle/10986/33748 License: CC BY 3.0 IGO.
Open Access. This is an open-access article distributed under the terms of the Creative Commons Attribution 4.0 International License (https://creativecommons.org/licenses/by/4.0/), which permits unrestricted use, distribution, and reproduction in any medium, provided the original author and source are credited, a link to the CC License is provided, and changes–if any–are indicated. (SID_1)