QUARTERLY REPORT
ON INFLATION
November
2001
Prepared by the Economics Department of the National Bank of Hungary István Hamecz, Head of Department
Issued by the Department for General Services and Procurement of the National Bank of Hungary
Responsible for publishing: Botond Bercsényi, Head of Department Prepared for publication by the Publications Group of the Department
for General Services and Procurement 1850 Budapest, V., Szabadság tér 8–9.
Mailing: Miklós Molnár Phone: 36-1-312-4484
Fax: 36-1-302-3714 Internet: http: //www.mnb.hu
ISSN 1585-0161
The new Act on the National Bank of Hungary, enacted by Parliament and effective as of 13 July 2001, defines the primary objective of the Bank as the achievement and maintenance of price stability. Using an inflation targeting system, the Bank seeks to attain price stability by im- plementing a gradual, but firm disinflation programme over the course of several years. In order to provide the public with a clear insight into the operation of central bank policies and enhance transparency, the Bank publishes the “Quarterly Report on Inflation”, covering recent and prospective developments in inflation and evaluating the macro- economic developments determining inflation. This publication sum- marises the projections and deliberations that underlie the decisions of the Monetary Council.
The Monetary Council, the supreme decision making body of the Na- tional Bank of Hungary, carries out a comprehensive review of the ex- pected development of inflation once every three months, in order to es- tablish the monetary conditions that are consistent with achieving the inflation target. The first section of the publication presents the Mone- tary Council’s position and the grounds for its decisions released on 5 of Nov. This is followed by a projection prepared by the analysts at the Bank’s Economics Department on the outlook for inflation and the un- derlying principal macroeconomic developments. The expected path and uncertainty of the exogenous factors used in the projection reflect the opinion of the Monetary Council.
² ² ²
STATEMENT OF THE MONETARY COUNCIL . . . 9
I. INFLATION – THE NBH’S PROJECTION AND LATEST DEVELOPMENTS . . . 11
1. Changes in the exchange rate of the forint and developments in inflation . . . 12
2. Have the exogenous factors affecting inflation been forecast correctly? . . . 12
3. Has the Bank been successful in capturing the economic mechanisms determining inflation? . . . 13
II. MONETARY POLICY, INTEREST RATES AND THE EXCHANGE RATE . . . . 14
1. Official interest rates and short-term market yields . . . 14
2. Changes in risk perception . . . 15
3. Capital flows and the exchange rate. . . 16
3.1 Yield movements . . . 18
III. DETERMINANTS OF INFLATION . . . 20
1. Demand . . . 20
1.1 Household consumption . . . 22
1.2 Investment . . . 23
1.3 The fiscal stance . . . 25
1.4 Net exports . . . 26
2. Supply side factors – the labour market. . . 28
2.1 Labour use and reserves. . . 29
2.2 Wage inflation . . . 30
3. Imported inflation . . . 31
4. Effect of regulation and extraordinary factors . . . 32
IV. FORECAST OF THE CONSUMER PRICE INDEX AND RISK ASSESSMENT . . . 34
1. Assumptions of the central projection . . . 35
2. Details of the central projection . . . 36
3. Uncertainty in the central projection . . . 37
4. Inflation expectations . . . 38
4.1 Possible causes of the differences . . . 38
SPECIAL TOPICS . . . 39
1. The effects of fiscal policy on Hungary’s economic growth and external balance in 2001–02 . . . 39
2. Estimating the permanent exchange rate of forint in the May–August period . . . 41
3. How do we prepare the Quarterly Report on Inflation? . . . 41
Contents
1998
Changes in the central bank’s monetary instruments . . . 23
Wage inflation – the rise in average wages . . . 62
Wage increases and inflation . . . 63
Impact of international financial crises on Hungary . . . 85
March 1999 The effect of derivative FX markets and portfolio reallocation of commercial banks on the demand for Forints . . . 20
What lies behind the recent rise in the claimant count unemployment figure? . . . 34
June 1999 New classification for the analysis of the consumer price index . . . 14
Price increase in telephone services . . . 18
Forecasting output inventory investment . . . 32
Correction for the effect of deferred public sector 13thmonth payments . . . 39
What explains the difference between trade balances based on customs and balance of payments statistics? . . . 44
September 1999 Indicators reflecting the trend of inflation . . . 14
The consumer price index: a measure of the cost of living or the inflationary process? . . . 18
Development in transaction money demand in the South European countries . . . 28
Why are quarterly data used for the assessment of foreign trade? . . . 37
The impact of demographic processes on labour market indicators . . . 41
What explains the surprising expansion in employment? . . . 42
Do we interpret wage inflation properly? . . . 45
December 1999 Core inflation: Comparison of indicators computed by the National Bank of Hungary and the Central Statistical Office . . . 18
Owner occupied housing: service or industrial product? . . . 20
Activity of commercial banks in the foreign exchange futures market . . . 26
March 2000 The effect of the base period price level on twelve-month price indices – the case of petrol prices . . . 19
The government’s anti-inflationary programme in the light of the January CPI data and prospective price measures over 2000 taken within the regulated category . . . 21
The impact of the currency basket swap on the competitiveness of domestic producers . . . 51
June 2000 How is inflation convergence towards the euro area measured? . . . 14
Inflation convergence towards the euro area by product categories . . . 15
Boxes and Annexes in the Quarterly Report
on Inflation
Changes in the central bank’s monetary instruments . . . 23
Transactions by the banking system in the foreign exchange markets in 2000 Q2 . . . 26
Coincidence indicator of the external cyclical position . . . 39
How is the wage inflation index of the NBH calculated? . . . 47
September 2000 Background of calculating monetary conditions . . . 20
Foreign exchange market activities of the banking system in 2000 Q3 . . . 25
December 2000 Changes in the classification methodology of industrial goods and market-priced services . . . 25
Different methods for calculating the real rate of interest . . . 27
Changes in central bank instruments . . . 28
Foreign exchange market activities of the banking system in the period of September to November . . . 31
Hours worked in Hungarian manufacturing in an international comparison . . . 53
Composition effect within the manufacturing price-based real exchange rate . . . 57
March 2001 Foreign exchange market activities of the banking system from December 2000 to February 2001 . . . 30
Estimating effective labour reserves . . . 50
August 2001 1 New system of monetary policy . . . 35
2 Forecasting methodology . . . 37
3 Inflationary effect of exchange rate changes . . . 38
Boxes and Annexes in the Quarterly Report on Inflation
S ince the inflation targeting system was introduced, there has been a considerable decline in consumer price inflation, with the annual rate down from 10.8 per cent in May to 8 per cent in September. Inflation expectations have also decreased significantly over the course of the past quarter. In the opinion of the Monetary Council, the economy has progressed on a path that is in line with the inflation target.
Since the publication of the last Report major changes have occurred in the external con- ditions affecting the course of inflation. Due to international developments, the exchange rate of the forint has showed significant volatility over the past few months, with the average rate being weaker than at the time of the previous Report. The past few months’ fluctuations in the perceived risk of forint investments may still be viewed as temporary. Over the longer term, the forint is expected to continue strengthening. Nevertheless, if the average exchange rate level of September were maintained, this would not pose a threat to achieving the infla- tion target, since the international and domestic deflationary environment appears to offset the effect of a weaker exchange rate.
In the judgement of the Monetary Council, the economy continues to grow at a rapid, al- though probably at a somewhat slower, pace than previously expected. GDP is expected to expand by roughly 4 per cent both in 2001 and
2002, but this rate may be lower in 2002 due to the uncertain global economic situation. Changes in external demand affect GDP growth via a number of channels. As a direct effect, export growth is expected to slow, just as investment growth, due to increasing uncertainty. Lower revenue growth will force companies to adopt a tighter wage pol- icy, resulting in a slower rate of wage increases, which in turn may lead to slower expansion of consumption. In any case, consumer spending will slow down to a small extent, as other incomes (such as public sector wages and pensions) are expected to grow more rapidly than earlier.
A significant decline in corporate sector in- vestment demand will exert downward pressure on the corporate sector’s financing requirement, offsetting the rise in the general government sec-
Statement of the Monetary Council
0 1 2 3 4 5 6 7 8 9 10 11 12
00:Q1 00:Q2 00:Q3 00:Q4 01:Q1 01:Q2 01:Q3 01:Q4 02:Q1 02:Q2 02:Q3 02:Q4 03:Q1
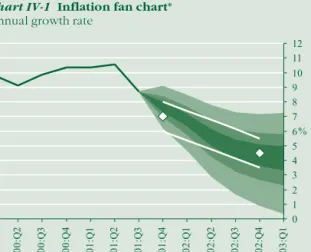
% Inflation projection*
Annual growth rate
* The fan chart shows the probability distribution of the outcomes around the central projection. The central band with the darkest shad- ing includes the central projection. The entire coloured area covers 90%
of all probabilities, with a 5% likelihood that the inflation outcome will fall outside of the coloured band. Outside the central projection (cen- tered around the median), the bands represent 15% probability each.
The uncertainty intervals have been estimated relying on the Bank’s historic forecast errors and the uncertainties perceived by the Monetary Council regarding the current forecast. The two white dots represent the inflation targets (7% and 4.5%, for 2001 and 2002, respectively);
while the straight lines mark the ±1% tolerance intervals on either side of the target rates.
tor’s financing requirement. In 2001, the current account deficit is expected to fall to EUR 1–1.5 billion. There may be a pick-up in investment demand in 2002, but the higher corporate sector financing requirement will be partly offset by the general government deficit being lower than this year. Thus, the increase in next year’s external financing requirement is ex- pected to remain within a range which can be viewed as safe from a financing perspective.
The volume of longer term foreign capital inflows will cover the economy’s external financ- ing requirement both in 2001 and 2002, which will foster the strengthening of the forint, ex- pected over the longer term.
Based on the forecasts, there is currently no need to change monetary conditions. The projected decline in inflation may enable the central bank to gradually lower its base rate in the future.
MONETARY COUNCIL
Statement of the Monetary Council
I
n September 2001, consumer price inflation was 8 per cent, down from 10.8 per cent in May. The slower CPI growth in 2001 Q3 was in line with the Bank’s August projection. From a central bank perspective, it is worth examining the strengthening in the trend of disinflation in respect of industrial goods and mar- ket services, and the halt in food price inflation.The factors behind disinflation in Hungarian tradables in- clude the initial effects of the third-quarter decline in inflation seen in Europe and the strengthening of the exchange rate (see Chart I-1). The inflation differential between market service prices and tradables prices continued to narrow, although the rapid growth in domestic consumer demand continues to keep the gap relatively wide (see Chart I-2).
Following an acceleration starting in mid-2000, food price in- flation peaked, and then recently began decreasing. Food prices have reflected the gradual tapering-off of last year’s meat price shock. At the same time, the third quarter saw an unexpected drop in unprocessed food price inflation. This was primarily due to stronger-than-usual seasonal (autumn) decreases in the prices of certain products, such as potatoes, for instance. This, however, is not regarded as a permanent change relevant to the process of disinflation (see Chart I-3).
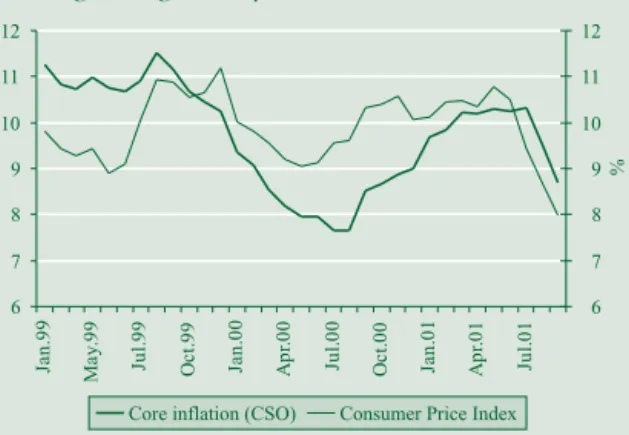
The inflation indicator over which monetary policy exerts the greatest control, namely core inflation computed by the Central Statistical Office (CSO), also reflects the trend towards disinfla- tion. Although the annual core inflation index continued to be higher than the consumer price index (CPI), the March peak was followed by a slow decline, and then by a major drop from Au- gust to September, indicating the lasting nature of the decline in inflation (see Chart I-4 on Page 12).
A detailed comparison of the actual CPI figures with the Bank’s projection for August involves analysing three issues (see Table I-1 on Page 12). First, the inflation projection made in Au- gust can be viewed as being conditional, as it is required for a special central bank application, namely to provide specialist support for monetary policy decision making. This forecast, based on the assumption of an unchanged level of the exchange rate, shows what would have happened, had the forint/euro ex- change rate remained at the assumed level over the entire fore- cast horizon. The second issue involves analysing the exogenous factors (from a central bank perspective) which have an impact on domestic inflation, in relation to the forecast’s assumptions.
The final question is how successfully the Bank has been in cap- turing the effect of these exogenous factors on Hungarian infla- tion, in other words, pinpointing the economic mechanisms de- termining inflation.
I. Inflation – the NBH’s projection and latest developments
-2 0 2 4 6 8 10 12 14 16
Jan.99 May y y y99 Jul99 Oct.99 Jan.00 Apr.00 Jul00 Oct.00 Jan.01 Apr.01 Jul01
%
-2 0 2 4 6 8 10 12 14 16
%
Eurozone inflation for non-energy industrial goods in HUF (right-hand scale) Traded inflation
Chart I-1Industrial price index and imported European tradables price inflation*
Percentage changes on a year earlier
* Euro-area tradables price inflation in forint terms: calculated with average monthly forint/euro exchange rate, backward looking three-month moving aver-
age of annual change.
0 2 4 6 8 10 12 14 16 18 20
98:Q1 98:Q2 98:Q3 98:Q4 99:Q1 99:Q2 99:Q3 99:Q4 00:Q1 00:Q2 00:Q3 00:Q4 01:Q1 01:Q2 01:Q3
%
0 2 4 6 8 10 12 14 16 18 20
%
Non-traded Non-traded/traded gap Traded Chart I-2Differential between market services and tradables price inflation
Percentage changes on a year earlier
-20 -15 -10 -5 0 5 10 15 20 25
99:Q1 99:Q2 99:Q3 99:Q4 00:Q1 00:Q2 00:Q3 00:Q4 01:Q1 01:Q2 01:Q3
%
-20 -15 -10 -5 0 5 10 15 20 25
%
Processed food Non-processed food
Chart I-3Inflation in processed and non-processed foods
Percentage changes on a year earlier
1 Changes in the exchange rate of the forint and developments in inflation
T
he forint/euro exchange rate has a direct effect on the price changes of tradable goods, which account for about one-quarter of the consumer basket. It also has an indirect impact on the price index of market services, which accounts for one-fifth of the basket, as the inflation differential between the two groups can be characterised by a long-term, trend-like equi- librium path. As processed food prices are governed by changes in both the prices of goods made with imported materials and the prices of internationally traded goods, the forint’s exchange rate also affects this category. Finally, together with other dominant factors, the forint’s exchange rate also has a direct bearing on im- port costs associated with certain fuel and energy products, and as a consequence, on their domestic market price. All in all, the exchange rate exerts direct influence over more than one-third of the consumer basket, affecting another 20–30 per cent indirectly.It also affects the profitability of much of the corporate sector, re- sulting in both long-term cost and demand-pull inflationary ef- fects via adjustments in the labour market.
As noted earlier, based on the concept behind the conditional exchange rate forecast of the August Inflation Report, the Bank modelled the effect on prices of a sustained appreciation of the forint, which was assumed to remain at its June average rate over the long term. However, from July to September, the exchange rate diverged from this assumption in two respects: it exhibited high volatility and was lower than the average (see Chart 1.5). It is no surprise then that tradables price inflation, directly affected by the exchange rate, was higher in the third quarter than had been projected.
2 Have the exogenous factors affecting inflation been forecast correctly?
D
omestic inflation is influenced by several external, im- ported and internal factors which are considered to be ex- ogenous from a central bank perspective. The Bank forecasts the development of these factors, or where it seems prudent, it uses simple assumptions. Table 1.2 shows data on the main assump- tions underpinning the August forecast and those observed dur- ing the third quarter.Imported components of inflation clearly show a shift towards disinflation relative to the August forecast. This is only partly the case in respect of domestic factors. While regulated prices and unprocessed food prices rose at a rate on average corresponding to or lower than those of the forecast, the price for pork, which is of key significance in Hungarian consumption, continued to rise in the third quarter, in contrast to the Bank’s assumption. This may be the reason for the underestimation of inflation in pro- cessed foods, since the price of unprocessed pork is also incor- porated into prices of processed foodstuffs. Due to the apparent volatility of unprocessed food price changes, the “surprise”
third-quarter fall in the price index will not be extended to the en-
I. Inflation – the NBH’s projection and latest developments
6 7 8 9 10 11 12
Jan.99 May.99 Jul.99 Oct.99 Jan.00 Apr.00 Jul.00 Oct.00 Jan.01 Apr.01 Jul.01
%
6 7 8 9 10 11 12
%
Core inflation (CSO) Consumer Price Index Chart I-4 Core inflation and the CPI*
Percentage changes on a year earlier
* The core inflation index computed by the CSO, excluding unprocessed and other seasonal foodstuff prices as well as market and administered energy prices. This in-
dex included 81.4 per cent of the consumer basket in 2001.
Jan.00 Mar.00 May y00 Jul00 Sep.00 Nov.00 Jan.01 Mar.01 May y01 Jul01 Sep.01
240 245 250 255 260 265 270
forint/euro
Actual exchange rate Exchange rate assumption in August Chart I-5 Assumed and actual forint exchange rates Monthly data
Table I-1Central inflation projection and actual data in 2001 Q3
Category Weight
August pro-
jection Actual data Difference*
per centage changes on a year earlier
Food 19.0 13.6 13.3 –0.2
Unprocessed 5.3 10.3 7.6 –2.7
Processed 13.7 15.1 15.8 0.8
Tradables 26.8 4.3 4.7 0.4
Market services 20.4 10.4 10.8 0.3
Market-priced
household energy 1.3 13.6 14.0 0.3
Vehicle fuel 5.0 –4.9 –4.8 0.0
Alcohol and tobacco 9.1 11.5 11.2 –0.3
Regulated prices 18.5 9.4 9.5 0.0
CPI 100.0 8.6 8.7 0.1
* Difference = actual data – projection; in per cent; rounded values.
Table I-2Assumptions of the August forecast and third-quarter data
Assumption August fore-
cast 2001 Q3
Brent crude oil (USD/barell)
Mediterranean price for petrol (EUR/tonnes)
27.7 331
25.3 267.2
Euro/dollar exchange rate (cent) 85.4 89.8
Imported tradables inflation* 2.4% 2.4%
Unprocessed food price inflation * 10.3% 7.6%
including: prices for pork** 0% 0.6%
Regulated prices ** 0.9% 1.0%
*Annual price index.
** Average monthly price increases.
tire forecast horizon: in other words, only slight changes will be made to the food inflation projection, relative to the August fore- cast (see Chapter 4).
3 Has the Bank been successful
in capturing the economic mechanisms determining inflation?
I
t is clear from Table 1.1 that the prospective changes in the in- flation rates of tradables, market services and processed food- stuff prices, significant from a central bank perspective, were un- derestimated in August. Knowing that the imported components of inflation tend to exert downward pressure on inflation, the question is whether the Bank has been successful in capturing the economic mechanisms that determine domestic inflation.According to the Bank’s forecast, tradables price inflation is typically determined by imported inflation and the forint/euro exchange rate. The forint’s exchange rate was weaker than the assumption underlying the August projection. As far as tradables are concerned, inflation in non-durables fell sharply, with partic- ular regard to clothing and apparel, due probably to higher-than-usual discounts at sales, which may also be evi- dence of exchange rate pass-through. Thus, the third-quarter tradables price index does not call into question the correctness of the Bank’s model.
In terms of the model, market services inflation differs from that of tradables in proportion to the productivity differential over the long term (Balassa-Samuelson effect), while other fac- tors (such as wages, food prices, energy prices, etc.) may also play a role over the short term. The third-quarter market services price index was underestimated to the same extent as the index for tradables, i.e. the forecast for the inflation differential was ac- curate. It should be noted, however, that the third-quarter rise in processed foodstuff prices was also underestimated. Neverthe- less, the effect of the underestimation of this cost factor influenc- ing market services prices was partially offset by an overestima- tion of the increase in manufacturing wage costs. While the Au- gust model used increases in the original wage index, from now on the Bank will apply wage-inflation-based estimation, which reflects a lower growth rate in 2001, resulting in a downward re- vision in the forecast. All in all, although the seemingly accurate forecast of the market services – tradables price inflation differ- ential is based on contradictory developments, we have modi- fied the forecast model accordingly (see Chapter 4).
I. Inflation – the NBH’s projection and latest developments
1 Official interest rates
and short-term market yields
S
ince the Hungarian authorities’ move to widen the forint’s ex- change rate band on 4 May, the National Bank of Hungary re- duced its interest rates on 10 September and 24 October, each time by 25 basis points. Three-month market yields fell by around 25 basis points in the period end-July to early October (see Chart II-1).The differential between three-month forint and euro yields fluctuated between 630 and 670 basis points over the May–early September period, then widened to around 740 basis points in September, finally settling into a range of 700 to 720 basis points in October (see Chart II-2). In the review period, the European Central Bank (ECB) lowered its official rate by 25 basis points on 30 August and then by another 50 basis points on 17 September, as the regional slowdown in growth in the euro area proved more broad-based and its extent deeper than had been expected, which was believed to promote a reduction in inflation. Based on three-month interest rates implied by EURIBOR futures con- tracts,1another 25-basis-point interest rate cut by the ECB is ex- pected before the end of the year.
In the period under review, the National Bank lowered its in- terest rates less than the ECB. Following the 25-basis-point re- duction in Hungarian rates in early September and the terrorist attacks against the United States on 11 September, short-term ex- pectations of further interest rate reductions ended temporarily, evidence of which can be clearly seen in the narrowing of the dif- ferential between three-month rates and the policy rate. How- ever, even the 50-basis-point increase in the interest rate differ- ential vis-à-vis the euro area was not enough to prevent the Hun- garian forint from depreciating. Towards early October, the dif- ferential between three-month interest rates and the policy rate returned to the level seen in the period prior to 11 September.
Throughout the month, market yields fell further under pressure from renewed expectations of an official rate reduction. The Bank lowered its policy rate by 25 basis point to 10.75% at the end of the month.
Forward yields, derived from the yield curve, and the Reuters poll reflect market participants’ expectations regarding the fu- ture course of domestic official interest rates. On the measure of forward yields, interest rate expectations were relatively stable in
II. Monetary policy, interest rates and the exchange rate
9 9.5 10 10.5 11 11.5 12
03/05/01 17/05/01 31/05/01 14/06/01 28/06/01 12/07/01 26/07/01 09/08/01 23/08/01 06/09/01 20/09/01 04/10/01 18/10/01
%
3 3.5 4 4.5 5 5.5 6 6.5 7
%
3-month HUF yield NBH base rate 3-month EUR yield (rhs) ECB MRO rate (rhs) Chart II-1 Official interest rates and short-term market yields
560 580 600 620 640 660 680 700 720 740 760
05.01 05.01 05.01 06.01 06.01 07.01 07.01 08.01 08.01 09.01 09.01 10.01 10.01
basispoint
Chart II-2 Three-month interest rate differential vis-a-vis the euro area
8 8.5 9 9.5 10 10.5 11 11.5 12
13/03/00 13/05/00 13/07/00 13/09/00 13/11/00 13/01/01 13/03/01 13/05/01 13/07/01 13/09/01 13/11/01 13/01/02 13/03/02 13/05/02
%
2-week NBH deposit
Reuters poll 19 Oct.
28 June
6 Sep.
11 Oct.
Chart II-3 Central bank base rate expectations:
two-week interest rate path derived from the yield curve and the Reuters poll
1The difference between the spot and futures rates of three-month EURIBOR on 6 November 2001. Analysts interpret this difference as expectations reflect- ing the ECB’s interest rate moves. Source: http//www.liffe.com.
the period between the move to widen the exchange rate band and turbulence in the emerging markets which began on 6 July, with market participants expecting an end-of-year value of around 10%. Thereafter, the expected path of official interest rates shifted slightly upwards. Subsequently there was a down- ward revision, and expectations of the year-end interest rate once again settled in around 10%. The survey conducted by Reuters on 19 October suggested a 30-basis-point higher value for end-December. Given that, according to the Reuters poll, in- flation expectations have eased off in the meantime, expecta- tions of nominal interest rates equal to those seen July reflect higher expectations of real interest rates (see Chart II-3).
2 Changes in risk perception
T
he risk assessment of forint investments have worsened since mid-June 2001, which has been reflected in the rise in yields and the depreciation of the forint exchange rate. Changes in risk perception have not been governed by country-specific factors but by unfavourable news coming from certain emerging economies, and, particularly following the terrorist attacks in the US on 11 September, by concerns about the world economy slowing down even further. In the past year, perceptions of emerging country risks have been influenced strongly by events occurring in developed markets – the evolution of the business cycle and movements in asset prices. This can be seen clearly from the fact that JP Morgan’s EMBI spread, reflecting the risk premia on emerging country sovereign debt, has been moving in tandem with the risk premia on high-risk corporate bonds of in- dustrialised countries and the implied volatility of US stock ex- change index options (see Chart II-4).In mid-August 2001, as in early July, contagion from emerging markets reached the Hungarian foreign exchange and govern- ment securities markets. Further aggravation of concerns over the much worse-than-expected Polish budget deficit played a major role, in addition to unfavourable economic news from Ar- gentina and Turkey. Over the month as a whole, while the spreads on Hungarian and Polish foreign currency-denominated bonds widened the EMBI spread did not, on balance, rise. All this may signal a slight deterioration in the relative risk perceptions of the central and eastern European region.
The jump in the EMBI spread in September was linked to the terrorist attacks in the US, which reduced dramatically investors’
willingness to take risks. Developed country risk indicators jumped to very high levels in comparison with previous years, and the riskiness indicators of emerging country financial assets deteriorated markedly. Coupled with an approximately 4 per cent depreciation of the forint exchange rate, the yield spread on Hungarian deutschmark bonds rose even more strongly than in July–August, and Hungarian government bond yields, too, rose 20–30 basis points (see Chart II-5).
Uncertainy in international capital markets has tapered off somewhat since the early days of October, strengthening confi- dence in emerging market investments. Along with the fall in global indicators of risk, the EMBI spread also has dropped by some 70 basis points, although these indicators have still re-
II. Monetary policy, interest rates and the exchange rate
500 600 700 800 900 1000 1100 1200 1300
01.00 04.00 07.00 10.00 01.01 04.01 07.01 10.01
basispoint
10 15 20 25 30 35 40 45 50
%
EMBI spread
Spread of risky U.S. corporate bonds (S&P U.S. Industrial Speculative Grade Credit Index)
S&P equity index implied volatility (VIX; right-hand scale) Chart II-4 Global indicators of risk
8.0 8.5 9.0 9.5 10.0 10.5 11.0 11.5 12.0
05.01.00 05.03.00 04.05.00 03.07.00 01.09.00 31.10.00 30.12.00 28.02.01 29.04.01 28.06.01 27.08.01 26.10.01
620 680 740 800 860 920 980 1,040 1,100
b
% asispoint
3 year HUF yield, % EMBI spread (right-hand scale) Band widening
Chart II-5 EMBI spread and the three-year forint yield
30 35 40 45 50 55 60 65 70 75 80
03.01 04.01 05.01 06.01 07.01 08.01 09.01 10.01
basispoint
Chart II-6 Average spread on DEM-denominated Hungarian sovereign bonds*
* Over the yields of Germain Bunds with similar maturities.
mained at uncomfortably high levels relative to early July. Im- provement in the perception of emerging country risks was re- flected in the falling spread on Hungarian foreign cur- rency-denominated bonds and the once again increasing de- mand for forint investments (see Chart II-6 on page 15).
The events from July to September highlight the fact that, de- spite the considerable upgrading of Hungary’s credit rating in re- cent years, international investors active in the Hungarian money and capital markets still react quite sensitively to adverse events in emerging countries. In addition, negative shocks from devel- oped countries increase the risk premia on Hungarian financial assets as well. This is mainly reflected in the higher volatility of the exchange rate, which is now allowed to fluctuate within a wider band, and, to a smaller extent, in market yields.
3 Capital flows and the exchange rate
T
he forint’s appreciation, on the heels of the Hungarian au- thorities’ move to widen intervention band, quickly ended in early July under influence from the Argentine crisis, and ex- change rate volatility increased. In the period July–September, movements in the forint’s exchange rate were influenced mostly by events in the international financial market, the solid domestic economic fundamentals being insufficient to offset the ripple ef- fects of the lack of confidence in emerging country performance.Each episode of depreciation was followed by a correction, but despite strengthening again and again, the exchange rate could not climb back to levels preceding the depreciation. Thus, fol- lowing the peak in early July, the exchange rate was on a down- ward trend (see Chart II-7).
Significant outflows of interest-sensitive capital were ob- served in July as an effect of the unfavourable capital market de- velopments (see Table II-1). Non-residents mainly cut their hold- ings of short-term Hungarian government securities; however,
II. Monetary policy, interest rates and the exchange rate
220
HUF/euro HUF/euro
240 260 280 300 320 340
04.02.01 05.02.01 06.02.01 07.02.01 08.02.01 09.02.01 10.02.01
220 240 260 280 300 320 340
HUF/euro Central parity Chart II-7 Exchange rate of the forint
Table II-1Components of foreign exchange market demand and supply
HUF billions 2001
Q1 April May June July August
I. Central bank intervention –177.9 –135.0 –28.0 0 0 0
II. Current account balance –90.0 –0.5 –34.5 –84.2 47.6 68.5
III. Non-interest-rate-sensitive capital-flows (1+2) 146.0 33.7 21.2 33.3 38.2 17.9
1 FDI inflow (private sector) 140.3 34.2 24.9 39.1 39.0 16.3
2 Equities securities 5.7 –0.5 –3.7 –5.8 –0.8 1.6
IV. Interest rate sensitive capital flows (1+2+3+4) 64.1 50.6 –14.2 27.7 –61.8 –123.7
1 Non-residents, total (a+b) 85.2 81.9 136.7 2.4 –59.6 –22.1
a) Change in non-residents’ holdings of government securities 90.8 66.2 101.3 27.6 –59.4 –8.0
of which: short-term –2.1 28.5 –10.1 –7.2 –48.9 6.8
long-term 92.9 37.7 111.5 34.8 –10.5 –14.9
b) Non-residents’ forint deposits –5.6 15.7 35.4 –25.2 –0.2 –14.0
2 Credit institutions (change in on-balance-sheet open position) 65.5 15.4 –108.9 80.8 72.4 –97.8
3 Corporate sector (a+b) –78.8 –46.2 –38.3 –65.9 –70.3 4.3
a) Net change in domestic foreign currency borrowing –26.1 21.9 –9.6 –29.6 –18.3 1.7
b) Net change in foreign currency borrowing abroad –52.8 –68.1 –28.7 –36.3 –51.9 2.6
4 Household sector –7.7 –0.6 –3.7 10.4 –4.4 –8.1
V. Other* 57.8 51.2 55.5 25.3 –8.1 53
VI. Purchases of foreign currency by the central bank in equal
daily amounts –2.1 –15.9 –16.0
*Note:The entry ‘Other’ includes the Bank’s and general government’s transactions as shown in the current account, other monetary financial institutions’ demand for foreign currency and the statistical error.
unlike in the preceding few months, withdrawals affected non-resident holdings of long-term government securities as well. Accordingly, the average maturity of government securities held by non-residents began to increase again in July, following a pause in June (see Chart II-8). As regards other interest-sensitive items, net borrowings by domestic businesses from abroad were negative, as seen in the earlier periods of the year, owing to the build-up of foreign exchange assets and repayments of foreign currency loans, with net domestic borrowings in foreign cur- rency falling as well. Simultaneously with this, banks’
on-balance-sheet open position opened up, explained princi- pally by foreign currency demand fuelled by repayments of for- eign currency loans by the corporate sector. Another source of demand for foreign currency stemmed from non-residents sell- ing their government securities with the aim of converting their value into foreign currency, banks meeting this need by borrow- ing in foreign currency. In terms of the non-interest-sensitive items of foreign capital flows, the value of direct investments turned out to be largely comparable with those in the preceding months. This contrasted with outflows from equity securities holdings.
Influenced by another round of eroding confidence affecting emerging economies, the forint depreciated by more than 4 per cent in a couple of days in mid-August. On this occasion, how- ever, depreciation was not accompanied by large-scale sales of government securities, as was the case in July, and for the month as a whole non-resident holdings of government paper fell by only HUF 8 billion. The average maturity of outstanding govern- ment securities began shortening from early August. Since the exchange rate band was widened in early May, August was the first month when flows into short-dated government securities were positive on balance. Unlike in earlier periods of the year, net corporate sector foreign currency borrowing abroad was positive, with net domestic borrowings in foreign currency rising slightly. Banks’ on-balance-sheet open position closed down, explained primarily by the country’s substantial current account surplus. Foreign direct investment was slightly lower than in the preceding months of the year. By contrast, minimal flows into eq- uity securities were observed for the first time since March.
The exchange rate received another shock in September with the terrorist attacks on the US, but its effects were different from exchange rate depreciation caused by contagion from emerging markets. This time the depreciation was more gradual, but lasted longer, and the subsequent correction was more sluggish than in earlier episodes. This may be explained by the different nature of the shock, given that the crisis spreading from the developed quarters of the world was expected to last longer, as concerns over the slowdown of the global economy meanwhile intensi- fied due to the terrorist attacks. This was seen to probably dampen demand for more risky investments. Uncertainties in the international capital markets having reduced, demand by non-residents for Hungarian government securities resumed ris- ing in the first weeks of October, with most demand concentrat- ing on discount treasury bills and NBH bills. All this was reflected in the tentative appreciation of the exchange rate as well. On 1 October, Hungary abandoned the crawling-peg devaluation regime; however, this move had little effect on the exchange rate, as it had been announced by the authorities a couple of months
II. Monetary policy, interest rates and the exchange rate
1.5 1.6 1.7 1.8 1.9 2 2.1 2.2 2.3 2.4 2.5
HUF/billions
02.01.01 12.01.01 22.01.01 01.02.01 11.02.01 21.02.01 03.03.01 13.03.01 23.03.01 02.04.01 12.04.01 22.04.01 02.05.01 12.05.01 22.05.01 01.06.01 11.06.01 21.06.01 01.07.01 11.07.01 21.07.01 31.07.01 10.08.01 20.08.01 30.08.01 09.09.01 19.09.01 29.09.01 09.10.01
Year
600 650 700 750 800 850 900 950 1,000 1,050 1,100
Volume (right-hand scale) Average maturity (left-hand scale) Chart II-8 Volume and average maturity of non-residents’ government securities holdings
earlier. Owing to fluctuations in the demand for government se- curities caused by the external shocks, holdings of government securities by non-residents were broadly at the same level as at the end of July.
Analysts have slightly altered their exchange rate expectations recently. Whereas according to the August Reuters poll they ex- pected a 250.3 HUF/EUR exchange rate for December 2002, ex- pectations in September for the same period were revised up- wards to 248.3 HUF/EUR and further to 248 HUF/EUR in October (see Chart II-9). Nevertheless, analysts’ expectations became a little more pessimistic over the short term: they revised their ex- pectations from 251.1 HUF/EUR in August to 252.3 HUF/EUR in September and to 252.7 HUF/EUR in October.
Mirroring the capital flows presented above, banks’
on-balance-sheet position opened up significantly in July, then closed down in August, narrowing to HUF 20–30 billion to- wards the early days of October. Banks sought to hedge the change in the on-balance-sheet position by entering into forward transactions, so at the beginning of October the sector’s total open position was largely comparable with the narrow, HUF 10–20 billion long foreign exchange position seen in July (see Chart II-10).
3.1 Yield movements
The previous Report presented developments in the Hungarian government securities market up to mid-July 2001. Since then, the slope of the curve of zero-coupon yields has fallen slightly. In addition to the one-year yield falling slightly, by approximately 10 basis points, zero-coupon yields with maturities over one year rose 20–30 basis points (see Chart II-11). Rises in implied forward rates in 1–4 years’ time explain most of the increase in yields (see Chart II-12). However, the shape of the forward yield curve changed only slightly, even despite the small increase in yields, and, comparing it with that in the period prior to the band-widening, it remained strongly downward-sloping over the 0–2 year bracket.
Partly due to the fall in euro yields, the gap between implied forint and euro forward rates has experienced a quite marked shift of more than 50 basis points in the past three months (see Chart II-13).
The increase in yields was fairly uneven across the curve. Jit- ters in the market related to the situation in Argentina only had a temporary influence, although the EMBI spread, a gauge of emerging country risk premia, appeared to have risen for a sus- tained period. In August, when the market was mostly domi- nated by unfavourable news coming from Poland, a country more comparable with Hungary, increases of 20–30 basis points in yields on government securities with time to maturity of 2–3 years were not followed by a correction. Yields were on a pro- tracted upward trend in the period immediately after the terrorist attacks against the US, this rise affecting every maturity. Demand for more secure assets, such as euro-area government securities, picked up due to the global uncertainty, which, coupled with the ECB’s decision to lower interest rates, led to a decline in euro yields.
At the end of September it was announced that Hungary plans to refinance its foreign currency debt maturing in 2002 in domes-
II. Monetary policy, interest rates and the exchange rate
-200 -150 -100 -50 0 50 100 150 200
04.01.00 15.02.00 29.03.00 12.05.00 22.06.00 03.08.00 14.09.00 27.10.00 11.12.00 25.01.01 08.03.01 24.04.01 06.06.01 18.07.01 30.08.01 11.10.01
Openpositions(HUFbillion)
-200 -150 -100 -50 0 50 100 150 200
HUFbillion
Open Euro (DEM) and USD contracts outstanding on futures exchanges (Bn HUF) (5 days moving average)
Total open position (5-day moving average) Off balance sheet position (5-day moving average) On balance sheet position (5-day moving average)
Chart II-10Commercial banks’ open FX positions
7 8 9 10 11 12 13
% %
02.10.00 02.12.00 02.02.01 02.04.01 02.06.01 02.08.01 02.10.01
7 8 9 10 11 12 13
1-year 3-year 5-year 10-year Chart II-11 Zero-coupon yields
230 235 240 245 250 255 260 265 270
02.01.01 02.03.01 02.05.01 02.07.01 02.09.01 02.11.01 02.01.02 02.03.02 02.05.02 02.07.02 02.09.02 02.11.02
HUF/euro
230 235 240 245 250 255 260 265 270
HUF/euro
Analysts exchange rate expectations - August poll Analysts exchange rate expectations - October poll HUF/euro
Chart II-9 The exchange rate and analysts’
expectations of future exchange rate movements
Source:Reuters elemzõi várakozások.
6 7 8 9 10 11
0 1 2 3 4 5 6 7 8 9
years ahead
%
6 7 8 9 10 11
%
26.04.01 10.07.01 11.10.01 Chart II-12 One-year implied forward yield curves
tic currency. Uncertainties surrounding the amount and structure of next year’s domestic currency issuing programme may have contributed to the rise in long yields and their increased volatility.
From October on, yields began falling across every maturity, si- multaneously with the movements in international risk indica- tors.
The fact that the shift in the forward differential occurred al- most across the entire spectrum of curve and by equal measures suggests that mostly external factors rather than expectations of a slower inflation convergence were behind the increase in the gap between forint and euro yields. This appears to be reinforced by foreign investors’ behaviour, as they reduced their holdings of government paper by around ½ per cent in the past three months following the continued rise observed since mid-2000. The matu- rity profile of holdings appear to have reflected the shift in the forward yield curve, i.e. foreign investors sold securities with ma- turities of 2 to 3 years.
Foreign yields, movements in the nominal exchange rate of the forint and required risk premia are the most important factors determining foreign investors’ demand for Hungarian govern- ment securities. Government securities yields in the euro area fell during the period under review. Explanation for this is that de- mand for securities carrying lower risks generally rises in a more uncertain investment climate. It can be presumed based on the survey of the money markets conducted by Reuters that ex- change rate expectations over the longer horizon have not changed significantly. In our view, therefore, a higher required risk premium must have caused the rise in forint yields. Global indicators of investors’ willingness to take risk also indicate the increase in risk premia on forint investments.
The trajectory of the differential between implied forward fo- rint and euro rates provides a picture of the expected interest rate convergence and, indirectly, of the current status of the ‘conver- gence play’. According to the expectations reflected in the curve of the forward differential, by end-2004 the inflation differential between Hungary and the euro area will have fallen to 1.5 per- centage points, the level meeting the Maastricht criterion on in- flation convergence.2
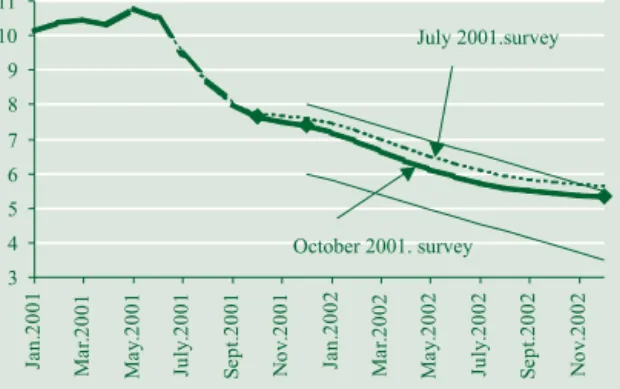
The Reuters survey appears to confirm that the rise in yields was not caused by an unfavourable shift in inflation expecta- tions. The increase in consumer prices has slowed down consid- erably in the past three months, in line with analysts’ expecta- tions (see Chart II-14). According to the Reuters poll, inflation ex- pected at end-2001 and end-2002 has been revised downwards by 30 basis points and 20 basis points respectively since mid-July (see Chart II-15). The averages calculated after eliminating the two extreme values are now in the target range for both future points in time, but the value expected for end-2002 is still higher than the Bank’s forecast.
II. Monetary policy, interest rates and the exchange rate
0 1 2 3 4 5 6 7
0 1 2 3 4 5 6 7 8 9
years ahead
%
0 1 2 3 4 5 6 7
%
2001.04.26 2001.07.10 2001.10.11 Chart II-13 Trajectory of the gap between one-year implied forint and euro forward rates
7 8 9 10 11
01.00 03.00 05.00 07.00 09.00 11.00 01.01 03.01 05.01 07.01 09.01 11.01
%
7 8 9 10 11
%
Analysts' forecast CPI
Chart II-14 Reuters survey of monthly inflation expectations versus actual inflation rates
4 5 6 7 8 9
01.01 02.01 03.01 04.01 05.01 06.01 07.01 08.01 09.01 10.01
%
4 5 6 7 8 9
%
December 2001 December 2002 Chart II-15 Reuters survey of inflation expected at end-2001 and end-2002
2 The differential between one-year implied forward rates in 4 years’ time is 2 percentage points. Assuming equal long-term real interest rates, this gap in- cludes liquidity, and country and exchange rate risk premia on forint yields, in addition to the expected rate of inflation. The exchange rate risk premium will vanish upon joining EMU, with the country risk premium remaining, however.
Currently, this amounts to approximately 80–90 basis points, which may fall to 40–50 basis points following Hungary’s joining EMU.