QUARTERLY REPORT ON INFLATION
FEBRUARY
2004
The analyses in this Report have been prepared by the Economics Department staff under the general direction of Ágnes Csermely, Head of Department. The project has been managed by Barnabás Ferenczi, Deputy Head of the Economics Department, together with Attila Csajbók, Head of the Monetary Assessment and Strategy Division, Mihály András Kovács, Deputy Head of the Conjunctural Assessment and Projections Division, and Zoltán M. Jakab, Head of the Model Development Unit. The Report has been approved for publication by István Hamecz, Managing Director.
Primary contributors to this Report also include Zoltán Gyenes, Gábor Kátay, Mihály András Kovács, Zsolt Lovas, András Oszlay, Zoltán Reppa, András Rezessy, Zsuzsa Sisak-Fekete, Gábor Vadas, Barnabás Virág, Balázs Vonnák and Zoltán Wolf. Other contributors to the analyses and forecasts in this Report include various staff members of the Economics Department and the Monetary Instruments and Markets Department. This Report has been translated by Csaba Kertész-Farkas, Éva Li, Edit Miskolczy and Péter Szűcs.
The Report incorporates valuable inputs from the MNB’s other departments. It also includes the Monetary Council’s comments and suggestions following its meeting on 9 and 23 February 2004. However, the projections and policy considerations reflect the views of the Economics Department staff and they do not necessarily reflect those of the Monetary Council or the MNB.
Published by the Magyar Nemzeti Bank
Krisztina Antalffy, Head of Communication Department 1850 Budapest, Szabadság tér 8-9.
www.mnb.hu
ISSN 1419-2926
The new Act LVIII of 2001 on the Magyar Nemzeti Bank, effective as of 13 July 2001, defines the primary objective of the Bank as the achievement and maintenance of price stability. Using an inflation targeting system, the Bank seeks to attain price stability by implementing a gradual, but firm disinflation programme over the course of several years.
The Monetary Council, the supreme decision making body of the Magyar Nemzeti Bank, carries out a comprehensive review of the expected development of inflation once every three months, in order to establish the monetary conditions that are consistent with achieving the inflation target. The Council's decision is the result of careful consideration of a wide range of viewpoints. Those viewpoints include an assessment of prospective economic developments, the inflation outlook, money and capital market trends and risks to stability.
In order to provide the public with a clear insight into the operation of monetary policy and enhance transparency, the Bank publishes all the information available at the time of making its monetary policy decisions. The Quarterly Report on Inflation presents the forecasts prepared by the Economics Department for the anticipated developments in inflation and the macroeconomic events underlying the forecast.
Starting from the November 2003 issue, the Quarterly Report on Inflation focusses more clearly on the MNB staff’s expert analysis of expected inflation developments and the related macroeconomic events. The forecasts and distribution of uncertainties surrounding the forecasts reflect the expert opinion of the Economics Department. The forecasts of the Economics Department continue to be based on certain assumptions.
Hence, in producing its forecast, the Economics Department assumes an unchanged monetary and fiscal policy stance. In respect of economic variables exogenous to monetary policy, the forecasting rules used in previous issues of the Report are applied.
Contents
SUMMARY 5
SUMMARY TABLE OF PROJECTIONS 10
FORECAST COMPARISON TABLE 11
1 FINANCIAL MARKETS 12
1. 1 Foreign interest rates and risk perception 12
1. 2 Exchange rate developments 15
1. 3 Yields 18
1. 4 Monetary conditions 21
2 INFLATION 24
2. 1 Inflation in 2003 24
2. 2 Inflation projection 28
2. 3 Inflation expectations 34
2. 4 Risks to the central projection 37
3 ECONOMIC ACTIVITY 40
3. 1 Demand 40
3. 1. 1 External demand 42
3. 1. 2 Fiscal stance 44
3. 1. 3 Household consumption, savings and fixed investment 47
3. 1. 4 Corporate investment 52
3. 1. 5 Inventory investment 54
3. 1. 6 External trade 55
3. 1. 7 External balance 57
3. 2 Output 61
4 LABOUR MARKET AND COMPETITIVENESS 64
4. 1 Labour utilisation 65
4. 2 Labour market reserves and tightness 70
4. 3 Wage inflation 72
4. 4 Unit labour costs and competitiveness 75
5 SPECIAL TOPICS 80
5. 1 An analysis of the performance of inflation forecasts for December 2003 80 5. 2 Disinflationary effects of a slowdown in consumption 84 5. 3 The macro-economic effects of changes in housing loan subsidies 86 5. 4 What do we learn from the 1999 indirect tax increase in Slovakia? 88
5. 5 Indicators of general government deficit 94
BOXES AND SPECIAL ISSUES IN THE QUARTERLY REPORT ON INFLATION 105
Summary
Higher risk perception of forint- denominated investments
Since the publication of the previous Report, risk premia on forint-denominated financial investments have increased despite the continued low level of euro and dollar interest rates and the improving overall perception of emerging market risks. The rise in premia were reflected in a weaker forint exchange rate and higher yields in the previous quarter as well as in 2003 as a whole. The key factors behind the lack of investor confidence were the concerns over the sustainability of medium-term economic processes. Due to the high current account deficit the uncertainty of the exchange rate expectations has increased, it was reflected in the higher exchange rate risk premium. The departure of the 2003 government deficit from the targets, modified on several occasions during the year, hit risk perception hard.
Expected date of euro-area accession postponed
Higher risk perception also relates to expectations about the pace and manner of Hungary’s accession to EMU. Available information suggest that market expectations have shifted towards a slower accession timetable.
Higher risk perception reflected in monetary conditions
The rise in risk premia were also reflected in monetary conditions – the real- effective exchange rate depreciated, while the real interest rate edged up. The level of the real exchange rate is, currently, 15 percent higher than before the exchange rate band widening. The current real interest rate is higher than the average in recent years, though not entirely unprecedented. The last time the real interest rate stood at a similar level was during the 18 months following the Russian crisis, and that situation was also brought about by an upsurge in risk premia.
Inflation continued to pick up at end-2003
2003 Q4 saw a pick-up in inflation, which was discernible in core inflation as well as among goods exogenous to monetary policy. However, while the pick-up in core inflation was in line with our expectations, inflation in other product groups, caused by an upswing in unprocessed food prices in 2003 Q4, was faster than forecast. As a result of the factors referred to above, the December inflation of 5.7 percent was substantially higher than our expectations.
Accelerating core inflation was fuelled by nearly all macroeconomic factors. On the cost side, inflationary pressure increased as a result of continuing rapid growth in unit wage costs and the effect on import costs of the forint exchange rate, stabilising at permanently weaker-than-earlier levels after the June 2003 exchange rate fluctuation band devaluation.
The pressure on prices did not ease on the demand side either, since household consumption failed to slow significantly towards year-end. Moreover, disinflation was adversely affected by expectations – surveys of various groups of economic agents showed steadily rising inflation expectations in Hungary in 2003.
Rising inflation expectations
Compared with earlier issues, the present Report gives a more in-depth analysis of inflation expectations. The rationale behind this is that, in our view, inflation expectations may determine whether disinflation continues in 2005 or inflation, caused by the 2004 rise in indirect taxation (increases in VAT and excise duty), proves permanent. The latest data suggest that all economic agents expect rising inflation over the period ahead; yet, it is still uncertain how lasting that process
will prove to be.
Assumptions of our forecasts
Similarly to our previuos Reports, forecasts in this Report are conditional on a number of key assumptions. First, monetary policy is assumed to be unchanged, that is, we assume the January interest rate, yield curve and exchange rate to persist at the forecast horizon. This implies that the November 2003 interest rate increase is taken into account in terms of its direct channel on domestic demand and its indirect channel via developments in the forint exchange rate up to January 2004.
In terms of fiscal policy, we assume for 2004 that the deficit reduction measures announced towards the end of last year and early this year would be fully implemented. For 2005, our forecast is conditional on the assumption that the deficit would be reduced by 1 percent envisaged in the Pre-Accession Economic Program (PEP) of the Government.
Our forecasts are also conditional on the assumption that inflation expectations do not rise on the indirect tax increases of January 2004.
In the risk assessment, in preparing the fan chart of the inflation projection we consider some potential deviations from these assumptions, e.g. regarding fiscal policy or expectations. However, as we want to show what would happen given the current monetary conditions we do not take into account potential changes in monetary conditions.
A further rise in inflation in 2004 H1
In our projection, inflation in 2003 H1 rises above that brought about by autonomous market processes, due to the fiscal measures introduced in January 2004. Our analyses have concluded that the one-off price impact of the increase in indirect taxes (VAT, excise duty) amounts to 2 percentage points in the CPI.
Over the short term, accelerating core inflation, rising inflation expectations and inflation of unprocessed food product prices make a further pick-up highly likely.
Over the longer term, disinflation likely to continue, if indirect tax hike does not spur growth in
expectations
Whereas we expect inflation to pick up in 2004 H1, from H2 market goods are characterised by continuing disinflation which may be caused mostly by demand-side developments – we expect consumption growth to stall, while the planned fiscal contraction of demand is also likely to lead to disinflation.
Inflationary pressure may also ease due to wage costs in H2, provided that economic agents consider the inflationary impact of the increase in indirect taxes as a one-off event which does not feed permanently through to price and wage expectations. Under such conditions, we expect inflation to run at 6.9 percent in December 2004.
If our strategic assumption about inflation expectations proves right, disinflation may continue in 2005, with consumer inflation down to 4.3 percent. In respect of meeting the disinflation path, 2005 will be of critical importance – given Hungary’s inflation history, inflation is highly likely to grow as a result of permanently rising price and wage expectations, generated in turn by the increase in indirect taxes.
Considerable upside risks to inflation in 2005
Taken together, we detect no serious asymmetry in terms of risks to the projection in 2004. By contrast, we expect a relatively high upside risk in 2005.
Regarding risks in 2004, a permanent rise in price and wage inflation expectations may be a key factor in inflation. This, however, may be at variance with a deeper slowdown in household consumption relative to the central projection on the demand side and/or a stronger real interest rate effect on domestic demand. Overall, the great uncertainty of the forecast for 2005 is demonstrated by the fact that the indicator incorporating all risks to the
projection is expected to be higher at end-2005 than the central projection by some 0.5 percentage points.
The fan chart of the inflation projection Inflation on a year earlier
0 1 2 3 4 5 6 7 8 9 10
02:Q1 02:Q2 02:Q3 02:Q4 03:Q1 03:Q2 03:Q3 03:Q4 04:Q1 04:Q2 04:Q3 04:Q4 05:Q1 05:Q2 05:Q3 05:Q4 Percent
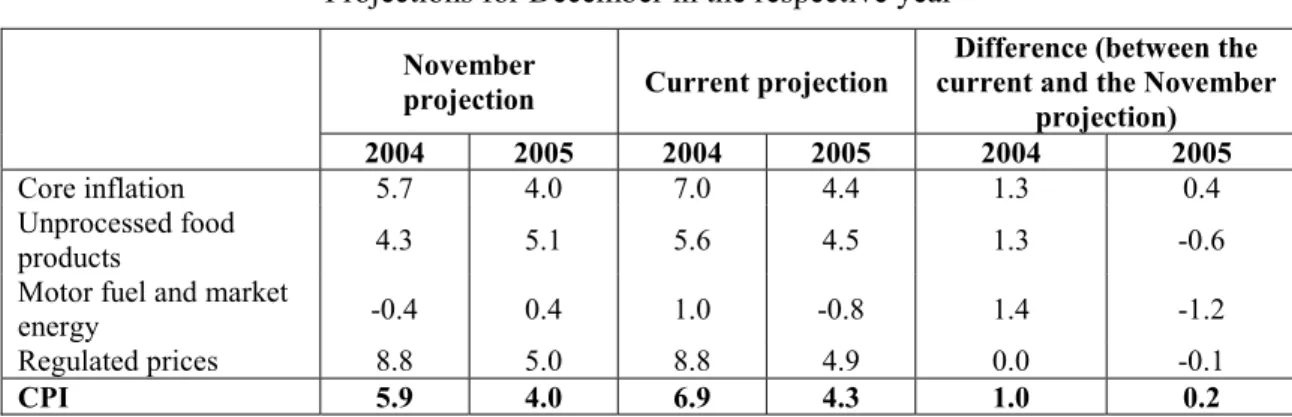
Rising projected inflation compared to November
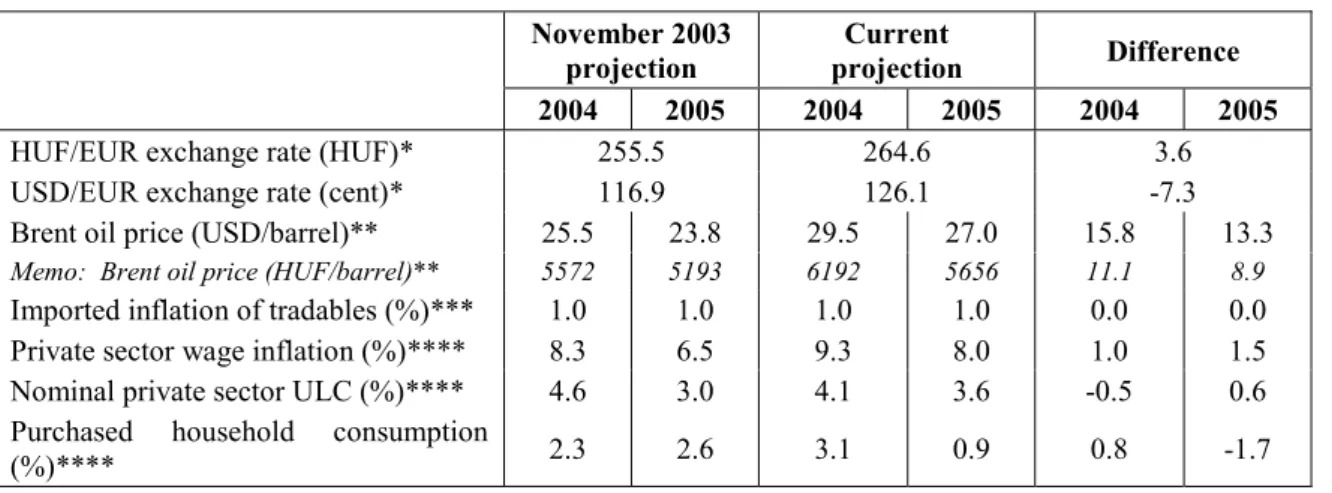
As compared with the November projection, our central inflation projection for December 2004 has been revised up by 1 percentage point. That is ascribable to an faster-than-expected rise in wage costs, a weaker-than-earlier forint exchange rate assumption, and faster-than-expected consumption growth. In addition, the accelerating rise in unprocessed food prices at end-2003 has also raised our forecast. Our central projection for December 2005 has been revised up only slightly, by 0.3 percentage points, due largely to the base effect of inflation in 2004.
Modest pick- up in economic growth
We estimate GDP to have grown by 2.9 percent in 2003, which is a significant slowdown on a year earlier. We expect growth to slowly edge up by 3.1 percent and 3.2 percent in 2004 and 2005 respectively, as a result of various conflicting factors. Growth in domestic use also decelerates, stemming mostly from a lower level of household consumption and government investment activity.
Simultaneously, heightened external business activity is coupled with a robust pick-up in exports, which, given the slowdown in growth in domestic use, increases the contribution of net exports to economic growth. These developments result in a change in the growth pattern seen in earlier years, growth driven by foreign trade rather than by domestic demand.
Fiscal tightening strengthens
After last year’s tightening of -0.3 percent of GDP fiscal policy would contain domestic demand by -1.7 percent of GDP this year. In 2005 we assume a 1 percent tightening based on the PEP.
As the level of fiscal deficit has come under increasing attention in the context of European convergence process and also in that of the external balance, from now on we will analyse and forecast in a conditional way various fiscal deficit indicators in the Reports. According to our forecasting principles, given the currently announced fiscal consolidation measures we expect the ESA deficit to
decrease to 5.3 percent of GDP this year, implying that additional measures would be needed to reach the 4.6 percent target.
For next year we assume that the 1 percent deficit reduction of the PEP would be implemented. Given the currently known determinations on the revenue and spending side we estimate that this requires new measures to the extent of some 2.8 percent of GDP next year at the level of the ESA deficit.
Pick-up in corporate investment, and slowdown in household and
government fixed investment activity
As a combined effect of various factors, corporate investment took a sharp upturn in 2003 H2. Both international confidence indices and international macroeconomic indicators suggest that the world economy has passed its latest recession, started back in 2001. This in itself encourages corporate sector capacity enlargement. In the meantime, macroeconomic developments in Hungary in recent years have forced companies to step up fixed investment spending. The underlying reason for this is that wage costs in the past two years have grown by far in excess of productivity, which has led to higher labour costs. Hence, given the upturn in the global business cycle, we expect a sharp pick-up in corporate investment activity, which may be subdued by rising capital costs generated by higher real interest rates over the longer term. At the same time, offsetting fiscal measures are likely to result in a drop in government fixed investment; and stricter subsidised housing loan conditions are reflected in the decline in household investment from 2004 H2.
Growth in household consumption slows down
2002 and 2003 saw an unprecedented rally in household consumption. Since the slowdown in consumption growth was not manifest up to December 2003, no rapid slowdown is likely to occur over the short term. However, from mid-2004 all factors suggest a major slowdown in household consumption. First, growth in household real income decelerates considerably, due to slower-than-earlier growth in real wages and in the real value of government transfers. Second, household uncertainty perception has also been sharply up recently, which may lead to lower propensity to consume. Third, as to some extent subsidised housing loans also financed consumption, restrictions in loan conditions contribute to the slowdown in consumption.
Outstanding industrial activity, stable services sector
Though industrial activity may have started to recover slowly in 2002 H1, the sharp pick-up in industrial production and export sales only provided clear signs of an upturn in external business activity in 2003 Q4. Meanwhile, the upswing in the services sector continued at a rate seen in earlier periods. At the forecast horizon, we expect the rise in industrial activity to accelerate, though such an extreme growth dynamics is unlikely to be sustained on the long run. Earlier growth in market services is expected to slow down as a result of a slow upsurge in household consumption and an upswing in external economic activity.
Increasing market share
The upturn in industrial activity was also reflected in the rapid increase in goods exports in 2003 H2. In our calculations, the fall in market share in 2003 H1 reversed as early as Q3 2003. At the forecast horizon, exports increase much more rapidly than expected in the November Report, and, as a consequence, Hungary’s market share would rise consistently with the dynamic trend of recent years.
Contradictory labour market adjustment
Private sector wage inflation stalled in 2003 H2, reflecting opposing sectoral movements. In manufacturing, wage inflation stopped to decline along with a slow decrease in employment and a rise in productivity. Meanwhile, the some measures showed an upswing in labour demand: average working hours and the number of reported vacancies also went up. By contrast, in the market services sector, wage inflation started to pick up towards the end of the year, which was
ascribable mainly to permanently high household demand, while labour force and productivity maintained steady growth. As a consequence of all these developments, unit wage costs fell in manufacturing in 2003 H2, while in the services sector they soared even in comparison with the brisk growth seen in earlier periods.
Slowing pace of wage inflation
In 2004, no dramatic changes are likely to occur in the processes described above. In manufacturing, we expect wage inflation to slow down, while in market services a temporary pick-up in wage inflation is followed by another period of downturn. As a result, private sector wage inflation is forecast to remain broadly flat in 2004, followed by a slowdown in 2005. The latter may only occur if our strategic assumption concerning inflation expectations proves right, i.e. if economic agents regard the increase in indirect taxes as an event with a one-off inflationary impact. However, if they do not, wage inflation may remain at last year’s level, putting stronger pressure on cost-push inflation.
Falling consumer demand in the market services sector may also contribute to the slowdown in wage inflation.
Rising employment
In parallel with the modest slowdown in wage inflation, we expect a slow rise in private sector employment in 2004–2005. Whereas the pace of market services sector employment growth does not slacken considerably compared with that in recent years, the earlier fall in labour demand in manufacturing stagnates, then reverses slowly from end-2004, simultaneously with a recovery in external business activity and production.
Improving competitive- ness in manufac- turing
Recently, exceptionally high production activity and slowing employment in manufacturing has been coupled with robust growth in productivity. We forecast that rapid upsurge to continue; therefore, slowing wage inflation and the assumption of a weaker-than-earlier nominal exchange rate assumption are likely to result in a slight increase in cost competitiveness at the forecast horizon.
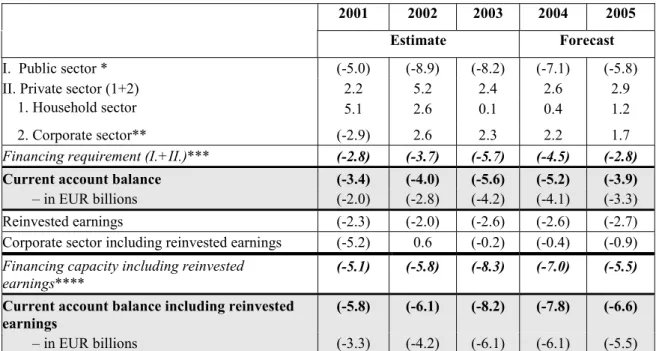
External equilibrium improves slowly
In 2003, the general government borrowing requirement declined by 0,7 percent of GDP, and the private sector financing capacity was down by nearly 3 percent of GDP. The change in external financing requirement was caused by changes in households’ earlier net saving behaviour, due mainly to the rise in subsidised housing loans and an upturn in the corporate sector investment cycle, which also added to the external financing requirement. In 2004, the general government borrowing requirement is likely to fall by 1 percentage point. The private sector financing capacity diminishes only slightly, household sector’s net financing capacity would improve slightly, as a result of housing loans regulation to the smoothing effect of consumption, while corporate sector investment activity continues to pick up.
Under the central projection, prepared on the basis of the Government’s Pre- accession Economic Programme, 2005 is likely to see continuing fiscal contraction of demand. Household savings rise due to slackening growth in consumption and declining dwelling investment. Firms’ capital expenditure remains high, while profitability increases more modestly. As a result of the sectoral changes described above, the external financing requirement in 2004 is expected to fall somewhat then more significantly in 2005.
Summary table of projections
(Percentage of changes on a year earlier unless otherwise indicated)
2002 2003 2004 2005
Estimation Projection
Actual
data November Current
Report November Current Report November Current
Report CPI*
December 4.8 5.1 5.7 5.9 6.9 4.0 4.3
Annual average 5.3 4.6 4.7 6.6 7.4 4.2 4.7
Net inflation, december1 n.a. n.a. n.a. n.a. 4.8 n.a. 3.8
Net inflation, annual average1 n.a. n.a. n.a. n.a. 5.7 n.a. 4.2
Economic growth External demand (GDP-
based)2 0.8 0.5 0.5 1.6 1.9 2.4 2.5
Household consumption
expenditure 10.5 7.8 8.9 2.3 3.1 2.6 0.9
Gross fixed capital formation 7.2 3.6 2.2 3.9 5.4 4.5 2.6
Domestic absorption 5.3 6.6 6.1 2.3 3.0 3.0 1.7
Exports 3.8 3.4 9.1 7.5 9.5 8.1 9.1
Imports 6.1 8.0 12.8 6.0 8.9 7.0 7.0
GDP 3.5 2.9 2.9 3.2 3.1 3.6 3.2
Current account deficit
As a percentage of GDP 4.0 6.4 8.63 5.6 8.22 6.0 8.13 5,2 7,83 5.3 7.33 3,9 6,63
EUR billions 2.8 4.7 6.43 4.2 6.12 4.7 6.43 4.1 6.13 4.5 6.23 3,3 5,53
Fiscal stance
ESA deficit as a percentage of
GDP 9.2 n.a. 5.8 n.a. 5.3 n.a. 4.3
Demand impact 4.2 (-0.4) (-0.3) (-0.8) (-1.7) (-0.8) (-1.0)
Private sector labour market
Wage inflation 12.6 9.2 9.3 8.3 9.3 6.5 8.0
Employment4 n.a. n.a. 1.1 n.a. 1.5 n.a. 0.4
* Actual data for 2003.
1Net inflation defined as Net (2) on Chart 2.5., it excludes the effects of VAT and excise duty changes from inflation
2 Summary tables in earlier Reports provided data on the size of export markets (i.e. import-based external demand), see Section 3.1.1.
3 Including estimated reinvested earnings.
4As the current projections are based on a survey of different sectors, they are not directly comparable with earlier forecasts (see Section 4).
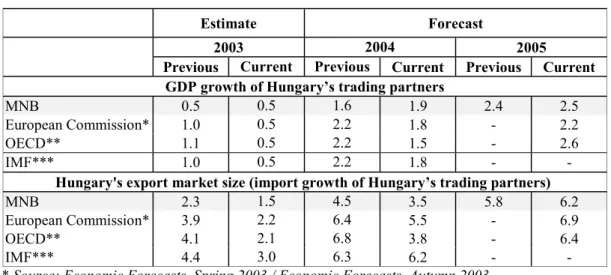
Forecast comparison table
2004 2005
CPI (December on December, in %)
MNB* 6.9 4.3
European Commission (October 2003) 5.1 3.8
Reuters survey (January 2004) 6.0 4.3
CPI (average annual growth, in %)
MNB* 7.4 4.7
Consensus Economics (January 2004)2 6.6 4.3
European Commission (October 2003) 6.1 4.1
IMF (September 2003) 5.5 n.a.
OECD (November 2003) 6.5 4.5
Reuters survey (January 2004) 6.6 4.6
GDP (annual growth, in %)
MNB* 3.1 3.2
Consensus Economics (January 2004)2 3.0 3.6
European Commission (October 2003) 3.3 3.9
IMF (September 2003) 3.5 n.a.
OECD (November 2003) 3.3 3.8
Reuters survey (January 2004) 3.0 3.6
Current account deficit (EUR billion)1
MNB* 4.1 3.3
Consensus Economics (January 2004)2 4.1 3.7
Reuters survey (January 2004) 4.5 4.1
Current account deficit (as a percentage of GDP) 1
MNB* 5.2 3.9
European Commission (October 2003) 4.9 4.6
IMF (September 2003) 5.4 n.a.
OECD (November 2003) 5.5 5.5
ESA general government deficit (as a percentage of GDP)
MNB* 5.3 4.3
Consensus Economics (January 2004)2, 3 4.7 3.9
IMF (February 2004)4 5.3 n.a.
Reuters survey (February 2004)3, 5 5.0 n.a.
* The MNB publishes so-called conditional forecasts. With certain economic policy variables (fiscal or monetary policy) and exogenous assumptions (dollar exchange rate, oil prices), forecasts are based on the rules rather than the most likely scenario. As a result, the MNB’s projections may not be directly comparable with those of other institutions.
1 Based on the 2003 balance of payments methodology (excluding reinvested earnings).
2 Based on a survey by Consensus Economics Inc. (London) entitled ’Eastern Europe Consensus Forecasts’, in which balance of payments data were provided in dollars which we then converted using end-2003 cross rates.
3 The responses given to Consensus Economics and Reuters surveys were considered as ESA deficit.
4 The Preliminary Conclusions of Hungary’s 2004 Article IV Consultation with the IMF .
5 Based on an extraordinary Reuters survey conducted on 3 February.
1 Financial markets
1. 1 Foreign interest rates and risk perception
Given the small size of Hungary’s economy and a very high degree of openness of its capital market, foreign, mainly EUR and USD, interest rates and global risk perception influence domestic financial markets considerably. Currently, most foreign investors consider Hungary to be a risky emerging market. Therefore, investors’ risk tolerance and changes in their risk appetite for emerging markets are key to developments in demand for forint investments.
Short-term interest rates of the two key currencies have been broadly flat since mid- 2003. Although recent data suggest an upturn in the US business cycle, uncertainty surrounding its durability remains. Therefore, the Federal Reserve rules out a raise in interest rates in the near future. Accordingly, an indicator of interest rate expectations, 30-day Fed funds futures seem to have got stuck on a 1 percent level. Nor are EUR returns likely to rise significantly. On the contrary, short-term yields and euro interest rate futures, a reliable indicator of expected changes in ECB’s key interest rates, have fallen: the current 2.2 percent level of the three-month EURIBOR for September 2004 is 60 basis points lower than the futures price for late November. Interest rate expectations in Europe may have been dampened by the fact that the euro has appreciated by another 10 percent relative to the US dollar in the past 3 months.
Developments in long-term yields reflect expectations about Fed and ECB responses.
Similarly to their last year’s performance, 10-year EUR/USD yields have remained low and even decreased slightly since last November.
Chart 1. 1 Federal Reserve and ECB key rates
0 0.5 1 1.5 2 2.5 3 3.5 4
Jan. 02 Jun. 02 Dec. 02 Jun. 03 Dec. 03
Percent
0 0.5 1 1.5 2 2.5 3 3.5 Percent4
Fed EC B
Chart 1. 2 Ten-year yields
3 4 5 6 7 8 9
Jul. 02 Sep. 02 Nov. 02 Jan. 03 Apr. 03 Jun. 03 Aug. 03 Oct. 03 Jan. 04
%
3 4 5 6 7 8
% 9
EUR USD HUF PLN
Since our last Report, global risk appetite has not declined, which can be directly linked to the fact that the interest rates of the two key currencies have been low since mid- 2003. International investors define their yield expectations vis-à-vis market instruments relative to low-risk assets. Over the past one and a half years, due to low EUR/USD interest rates, attributable to a long-drawn-out downturn in the business cycle, investors have been looking increasingly to emerging markets and high-risk assets offering higher yields. Investor interest remains high, which is proven by the fact that during the period under review all indicators examined sank to a historically low level. If no change occurs in expectations about the interest rate cycle in developed countries in 2004, the risk perception of emerging economies may also remain favourable.
Chart 1. 3 Global indicators of risk
200 300 400 500 600 700 800 900 1000 1100 1200
Jan. 02 May. 02 O ct. 02 Apr. 03 Aug. 03 Jan. 04
basispoint
0 5 10 15 20 25 30 35 40 45 50 Percent
EMBI* MAGGIE** VIX***
*EMBI Global Composite.
**MAGGIE – the index (bp) of euro-denominated government and corporate bonds calculated by JP Morgan-Chase.
***VIX – Implied volatility derived from options for the S&P100 index.
As opposed to a general overall improvement in the risk perception of emerging countries, uncertainty surrounding the CEE region has not diminished significantly.
With euro yields remaining flat, the rise in ten-year zloty yields around September and October has proven lasting. Long-term forint yields also rose in November and December. Entrenched debates about fiscal adjustment in Poland have had an unfavourable impact. The future perception of the region is adversely hit by the fact that debates on fiscal reforms in Poland may have political implications. The reason for this is that the Polish government is threatening with early elections if the Parliament rejects the reform bill.
Regional events and domestic economic developments both increased risk premium on the forint. Worries about the medium-term sustainability of economic processes continue to be the underlying reasons for the loss of foreign investor confidence.
Opinions of market participants are divided on the issue to what extent the treatment of the current account deficit will dominate other economic policy objectives. The departure of the 2003 government deficit from the targets, modified on several occasions during the year, hit risk perception hard.
No significant change has occurred in the interest rate premium on foreign currency- denominated Hungarian government bonds since our last Report. This suggests that the recent rise in risk premium is primarily due to increased exchange rate risk. The perception of the Hungarian government’s solvency has not deteriorated substantially.
This is reflected in both interest rate premia and credit rating, the latter remaining, for the time being, unchanged. The Fitch credit rating agency, which revised down its projection for the rating outlook for Hungarian government debt last autumn, has not changed its rating of either foreign currency or forint-denominated debt. Uncertainty,
however, seems to have prevailed during the period under review, which is clearly reflected in the permanently negative rating outlook.
Chart 1. 4 Interest rate premium on EUR-denominated Hungarian government bonds
30 35 40 45 50 55 60
Jan. 02 Jan. 03 Feb. 04
basispoint
30 35 40 45 50 55 60 basispoint
1. 2 Exchange rate develo pments
The forint’s exchange rate depreciated by approximately 2 percent between November 2003 and January 2004. Simultaneously, exchange rate volatility increased significantly. After a relatively stable period between August and October, the exchange rate started to fluctuate from November similarly to that experienced in June and July.
The exchange rate plummeted on two occasions during the period under review: once in late November, and then in early January. However, the impact of neither incidence of depreciation proved lasting, for either was followed by moderate correction. In response to the depreciation, the Bank raised its base rate by 3 percentage points in late November. December saw correction in the exchange rate, only to be followed by another instance of depreciation in early January. It was at this time that the government publicly disclosed the higher-than-planned general government deficit, and the issue of revising the strategy of the adoption of the euro was raised. The depreciation in early January did not last long either, and like the depreciation in November, it was followed by a spell of moderate appreciation.
Chart 1. 5 The exchange rate of the forint
245
250
255
260
265
270
275
Jun. 03 Jul. 03 Aug. 03 Sep. 03 Oct. 03 Nov. 03 Dec. 03 Jan. 04 Feb. 04
HUF/EUR
245
250
255
260
265
270
275 HUF/EUR
As exchange rate volatility strengthened, so the indicators of market uncertainty further increased. Implied volatility calculated from FX market option prices rose at both the one-week and one-year horizon. This suggests that uncertainty about future exchange rate developments increased. Uncertainty at the one-week horizon reached the level it stood at in January and July 2003. Implied volatility has never been this high since January 2003 (beginning of our time series). While exchange rate outlook used to be unpredictable only in the short run, it seems that it is here to stay over the longer term as well.
Chart 1. 6 HUF/EUR implied volatility
0 5 10 15 20 25
Jan. 03 Apr. 03 Jul. 03 Oct. 03 Jan. 04
Percent
0 5 10 15 20 25 Percent
1W 12M
At the same time, Reuters survey of professional forecasts reveal that in addition to the increased uncertainty about the exchange rate, its expected path has also been modified.
The average end-2004 exchange rate expectations of analysts fell by nearly 4 percent
between October 2003 and January 2004. Meanwhile, the spot exchange rate weakened by 2 percent. Thus, while in October 2003, analysts still expected the exchange rate to appreciate considerably before end-2004, in January 2004, they appeared to be more inclined to expect it to remain flat. It should be noted, however, that projections for end- 2004 in the Reuters survey in January were more widely distributed than earlier. While most participants projected HUF/EUR 250 to 262, some foreign analysts expected the exchange rate to stand at HUF/EUR 280 to 293 at year-end 2004.
Chart 1. 7 Average of Reuters analyst exchange rate expectations
235 240 245 250 255 260 265 270 275
2003 2004 2005
HUF/EUR
235 240 245 250 255 260 265 270 275 HUF/EUR
Spot rate October 2003 poll January 2004 poll
Accordingly, Reuters surveys also revealed that analysts expected a lower central parity in ERM II. Expected central parity between November and January was approximately 2 percent weaker, while the date of ERM II entry remained roughly as scheduled.
Analysts expect it to take place some time between 2004 H2 and 2005. This is all the more important as the timing of ERM II entry and the expected central parity also influence exchange rate expectations.
Chart 1. 8 Average of Reuters analyst expectations of the forint’s ERM II central parity
250
255
260
265
Aug. 03 Sep. 03 Oct. 03 Nov. 03 Dec. 03 Jan. 04
HUF/EUR
250
255
260
265 HUF/EUR
1. 3 Yields
Following the Monetary Council’s decision on 28 November 2003 to raise the base rate by 300 basis points, yields on government securities rose significantly. The fact that three-month benchmark yield permanently remained two hundred basis points suggests that the raise took even markets by surprise. Apart from an initial overshooting, one-and 10-year yields increased by 100 and 50 basis points respectively. In January and February yields rose further, especially around one-year maturity.
Chart 1. 9 Benchmark yields in the government securities market
4 6 8 10 12 14 16
Jan. 03 Mar. 03 May. 03 Jul. 03 Sep. 03 Nov. 03 Jan. 04
Percent
4 6 8 10 12 14 Percent16
3M 1Y 10Y
The extent of the rise in 1-2-year yields suggests that market participants do not expect a fast and significant cut in interest rates. By contrast, the Reuters January business
survey reveals that nearly all analysts included in the survey expected the key policy rate to return to 9.5 percent prior to end-2004.
Chart 1. 10 Analysts’ key policy rate expectations Reuters survey
6 7 8 9 10 11 12 13
2003 2004 2005 2006
Percent
6 7 8 9 10 11 12 13 Percent
MN B 2-w eek depo rate O ctober 2003 poll January 2004 poll
From shifts in implied forward rates conclusions can be drawn on interest rate expectations at various horizons. In addition to the spot one-year rate, forward rates related to various maturity dates in the future also rose significantly between early November 2003 and February 2004. For instance, the forward rates in two and four years’ time rose by 200 and 100 basis points respectively. Consequently, the forward rate curve suggests that in the years to come, the market expects a significant drop in yields and considerably higher yield levels relative to expectations in early November 2003.
Chart 1. 11 Implied one-year forward rates for different dates*
5 6 7 8 9 10 11 12 13
2004 2005 2006 2007 2008 2009 2010 2011 2012 2013 2014 Percent
5 6 7 8 9 10 11 12 13 Percent
12 Feb. 03 6 N ov. 03 12 Feb. 04
*The horizontal axis indicates the start of the one-year forward rate.
In the meantime, the euro yield curve shifted downwards, thus the forward differentials grew even more significantly. Neither an increase in the risk premium nor expectations of more rapidly depreciating (or more slowly appreciating) exchange rate can be ruled out as the main reason why market participants require forint instruments to produce higher returns. The Reuters survey reveals no significant change in short-term expectations for average appreciation, though, in contrast with a slight appreciation envisaged earlier, analysts forecast near stagnation for 2004. It is important to note, however, that some foreign investment banks, perhaps underrepresented in the survey compared to their market share, expect rapidly falling central bank interest rates and a considerably depreciating exchange rate in their analyses. The heterogeneity of the market may be attributable to increased uncertainty and invariably hectic exchange rates and yields.
For some time, exchange rate expectations and long-term yields have also been influenced by the strategies of entry into EMU and ERM II. Last July the government specified 2008 as the target date of EMU entry. In the past three months, the one-year EUR/HUF (implied) forward rate for this date has risen by nearly one percentage point, exceeding 2.5 percent. This has been the highest value since early 2000. Although to a far less extent, the differential for 2010 has also risen. Its January 2004 average of 1.5 percent corresponds to the 2001 annual average. In EMU the interest rate differential is highly likely to fall below one percentage point, which means that a fast entry is priced at a low probability. It should be noted that the Government also started rethinking the entry strategy in the period under review (in January), which the market may have interpreted as a probable postponement of the date of the EMU entry.
Chart 1.12 Implied forward rate differentials for fixed dates
0 1 2 3 4
Jan. 01 Jan. 02 Jan. 03 Jan. 04
P e rc e nt
0 1 2 3 4 P e rc e nt
2 0 0 8 2 0 1 0
The Reuters survey underpins the explanation that the expectations related to the postponement of EMU entry may have had a role in rises in yields and the weakening of the exchange rate. Contrary to the movement in yields, this trend continued throughout 2003 as a whole, and not only over the past quarter. In January 2003, the majority of macroeconomic analysts considered an early (2007 or 2008) EMU entry as likely. In the course of the year, expectations shifted towards 2009. A further slight shift towards a
later date could be seen even during the period between the October 2003 and January 2004 surveys, although they did not suggest a degree of change that was suggested by the yield curve.
Chart 1. 13 Reuters analysts’ EMU entry date expectations
0 10 20 30 40 50 60 70 80 90
2007 2008 2009 2010
Percentage of answers
0 10 20 30 40 50 60 70 80 90
Percentage of answers
January 2003 October 2003 January 2004
Evaluating exchange rate and yield developments as well as the international environment unambiguously suggests a considerably deteriorating risk perception of forint investments. This trend holds true for 2003 as a whole and the events of the past three months fit in this trend. Instead of a continuous rise, risk premium increased abruptly, in discrete jumps. Temporarily, during these periods there were instances of significant overshooting, followed by the stabilisation of the exchange rate at a lower and of the yield curve at a higher level.
Market opinions clearly suggest that the main reason why many participants think the risk of a permanently more depreciated forint exchange rate has increased is the deficit of the current account, though many also consider the difficulties concerning the lowering of the general government deficit as a reason, too. The uncertainty surrounding expectations increased both during the entire year and in the past three months. The mainly country-specific (non-contagious) risk factors are reflected in higher exchange rate risks. Simultaneously, global risk assessment improved, while the regional one remained unfavourable.
As a result of the broken external and internal equilibrium, the market expects economic policy to take a course that rules out an early EMU entry. Postponement of the expected date of EMU entry may have contributed directly to the weakening of the forint exchange rate and rising yields through an expected higher future risk premium.
1. 4 Monetary conditions
Monetary policy affects real economy primarily through real exchange rates and real interest rates. Given the weight of foreign trade in Hungary, the forint exchange rate plays a more important role. What follows briefly outlines changes in these two variables and how market participants perceive future changes in them. This description
of market expectations relies on the macroeconomic analyses in the Reuters survey, which, though not a properly representative sample of all economic participants, provides a good picture about tendencies.
The depreciation of the forint exchange rate last year resulted in a nearly 5 percent weakening of the real effective exchange rate despite Hungary’s excess inflation of over 3 percent. This weakening followed two-year appreciation. Macroeconomic analysts expect real appreciation for 2004, owing to primarily to the inflation differential. The level calculated from end-2004 expectations would still be below the early 2003 level.
However, given that part of the excess inflation is generated by changes in indirect taxes, neutral from the perspective of corporate sector competitiveness, the expected real appreciation can be deemed as a result of actual tightening of monetary conditions only to a lesser extent.
Chart 1. 14 Monetary conditions: the real exchange rate*
90 95 100 105 110 115 120 125 130
Jan. 96 Jan. 97 Jan. 98 Jan. 99 Jan. 00 Jan. 01 Jan. 02 Jan. 03 Jan. 04
90 95 100 105 110 115 120 125 130
* CPI-based real effective exchange rate. Average of 2000 = 100 percent. Higher values denote appreciation. End-2004 expectation is calculated on the basis of the Reuters inflation and exchange rate consensus, assuming no change in the trading partners’ inflation relative to 2003 and that effective exchange rate appreciation expectations correspond to HUF/EUR exchange rate expectations.
A significant rise in yields in the last few months of 2003 fed through to forward- looking real interest rates, because it exceeded the increase in inflation expectations.
Currently, the one-year forward-looking real interest rate is above 5 percent, slightly exceeding the corresponding figure last year. (The historic average has been 4 percent since 1996.) However, this is by no means unprecedented. The last time the forward- looking real interest rate was as high as the current one was in the period following the Russian crisis, that is, in the second half of 1998 and in 1999. Like now, the high real interest rate then too was attributable to a rise in the risk premium.
With regard to future real interest rate developments, market participants expect a further increase: implied forward rates suggest lower expectations of a decline in yields than the decline in inflation, thus the real interest rate expected by the beginning of 2005 approaches 6 percent.
A significant rise is shown in the contemporaneous real interest rate, which is less significant from the point of view of its economic content, including the assessment of monetary conditions, but easier to calculate and therefore frequently used.1 In an environment of low inflation or in the case of increasing inflation expectations, the two kinds of differently defined real interest rates naturally approach each other.
Chart 1.15 Monetary conditions: real interest rate*
-1 0 1 2 3 4 5 6 7
Jan. 96 Jan. 97 Jan. 98 Jan. 99 Jan. 00 Jan. 01 Jan. 02 Jan. 03 Jan. 04 Jan. 05
Percent
-1 0 1 2 3 4 5 6 Percent7
Ex ante Contemporaneous
*Monthly average yields on one-year government securities, deflated with the contemporaneous 12-month inflation and Reuters one-year forward-looking inflation consensus (value computed by interpolation from year-end and average inflation expectations). The expectation relevant to January 2005 is calculated from the implied forward rate from the inflation consensus applied by Reuters.
The concurrent and combined changes in monetary conditions reflect the risk premium rise already established in the previous chapters. The decline in the nominal forint exchange rate exceeded Hungary’s excess inflation over other countries, while the rise in nominal interest rates exceeded higher inflation expectations.
1 For more details, see Box II-1 Different methods of calculating the real rate of interest in the December 2000 Quarterly Report on Inflation.
2 Inflation
2. 1 Inflation in 2003
In December 2003, consumer price inflation was 5.7 percent, which was substantially higher than the target set by the Magyar Nemzeti Bank for end-2003 (below 4.5 percent). Although the target was set for the headline consumer price index (CPI), the fact that core inflation was up to 4.9 percent indicates that even underlying inflation was above target.2
Chart 2-1 CPI and core inflation relative to target band of inflation Year-on-year growth rates
2 3 4 5 6 7 8 9 10 11
Jan.00 May.0 Sept.0 Jan.01 May.0 Sept.0 Jan.02 May.0 Sept.0 Jan.03 May.0 Sept.0
Percent
2 3 4 5 6 7 8 9 10 11
Percent
Consumer Price Index Core inflation
In terms of inflation developments, 2003 may be divided into two distinct periods. The first quarter saw a continuation of disinflation following the widening of exchange rate band in 2001, complemented by price movements of factors endogenous to monetary policy and, in some periods, by certain exogenous factors. In 2003 Q2, the disinflation trend, which had started in mid-2001, was interrupted. And, from H2, consumer price movements were determined by factors generating higher inflation.
After January 2003, our short-based (month-on-month) indices showed a pause in the downward trend in core inflation. However, as a positive effect of some exogenous items (a temporary drop in oil prices, stagnating, or falling unprocessed food prices, a slowdown in regulated price increases), up to May no indices showed clearly a change in the overall inflation trend at the level of the CPI.3
2 For a detailed analysis of inflation forecasts for end-2003, see Section 5.1.
3 The 3.6 percent annual growth in consumer prices recorded in May 2003 was a thirty-year low in Hungary in terms of year-on-year inflation.