QUARTERLY REPORT
ON INFLATION
2000 June
H–1850 Budapest. V. Szabadság tér 8–9.
Head: Judit Neményi Managing Director Phone: 36-1-312-2469
Fax: 36-1-2690-753
Published by the Secretariat of the National Bank of Hungary Head: dr. József Kajdi Managing Director
Mailing: Miklós Molnár Phone: 36-1-312-4484
Fax: 36-1-302-3714 Internet: http: //www.mnb.hu
ISSN 1419-2926
Bank of Hungary with the aim of providing the general public with regular information on the current and expected state of inflation as well as the Bank’s interpretation of macroeconomic develop- ments determining inflation. Wider access to information on monetary policy objectives is expected to lead to a better under- standing of the Bank’s policy responses.
The goal of this publication is to describe and interpret the developments of the preceding quarter.
1² ² ²
1The previous issues of the “Quaterly Report on Inflation” are available on the home page of the National Bank of Hungary.
SUMMARY . . . 7
I. INFLATION . . . 13
1. Imported inflation . . . 16
2. Components of the changes in consumer prices . . . 17
II. MONETARY POLICY . . . 22
1. Monetary conditions and changes in the interest rate and the exchange rate . . . 22
1.1 Monetary base . . . 24
1.2 Components of intervention forint demand . . . 25
2. Yield curve, interest rate and inflation expectations . . . 26
3. Interest rate policy of the commercial banks . . . 28
4. Monetary aggregates . . . 29
5. Demand for credit . . . 30
III. DEMAND . . . 32
1. Household consumption . . . 33
2. Investment . . . 34
2.1 Fixed asset investment . . . 34
2.2 Inventory investment . . . 36
3. The fiscal stance . . . 37
4. External demand . . . 38
IV. SUPPLY . . . 44
1. The labour market . . . 44
1.1 Employment. . . 44
1.2 Unemployment . . . 45
1.3 Earnings growth . . . 46
2.Capacity utilisation . . . 48
3.Competitiveness . . . 49
V. EXTERNAL EQUILIBRIUM. . . . 51
1. Net savings position . . . 51
2. Current account and its financing . . . 53
3. The international investment position . . . 54
Contents
1998
Changes in the central bank’s monetary instruments . . . 23
Wage inflation – the rise in average wages. . . 62
Wage increases and inflation . . . 63
Impact of international financial crises on Hungary . . . 85
March 1999 The effect of derivative FX markets and portfolio reallocation of commercial banks on the demand for Forints . . 20
What lies behind the recent rise in the claimant count unemployment figure? . . . 34
June 1999 New classification for the analysis of the consumer price index . . . 14
Price increase in telephone services . . . 18
Forecasting output inventory investment . . . 32
A correction for the effect of deferred public sector 13thmonth payments . . . 39
What explains the difference between trade balances based on customs and balance of payments statistics? . . . 44
September 1999 Indicators reflecting the trend of inflation . . . 14
The consumer price index: a measure of the cost of living or the inflationary process? . . . 18
Development in transaction money demand in the South European countries . . . 28
Why are quarterly data used for the assessment of foreign trade? . . . 37
The impact of demographic processes on labour market indicators . . . 41
What explains the surprising expansion in employment? . . . 42
Do we interpret wage inflation properly? . . . 45
December 1999 Core inflation: Comparison of indicators computed by the National Bank of Hungary and the Central Statistical Officey . 18 Owner occupied housing: service or industrial product? . . . 20
Activity of commercial banks in the foreign exchange futures market . . . 26
March 2000 The effect of the base period price level on twelve-month price indices – the case of petrol prices . . . 19
The government’s anti-inflationary programme in the light of the January CPI data and prospective price measures over 2000 taken within the regulated category . . . 21
The impact of the currency basket swap on the competitiveness of omestic producers . . . 51
June 2000 Box: I-1 How is inflation convergence towards the euro area measured? . . . 14
Box: I-2 Inflation convergence towards the euro area by product categories . . . 15
Box: II-1 Changes in the central bank’s monetary instruments . . . 23
Box: II-2 Transactions by the banking system in the foreign exchange markets in 2000 Q2 . . . 26
Box: III-1 Coincidence indicator of the external cyclical position . . . 39
Box: IV-1 How is the wage inflation index of the NBH calculated? . . . 47
Quarterly report on inflation
T he National Bank of Hungary’s policy goal is to achieve a sustainable decline in inflation and ultimately price stability. Predictability and moderate interest rates, concomitant with a low inflation environment, are both factors which facilitate long-term, rapid economic growth. Achievement of the inflation target is assisted by an exchange rate regime based on a pre-announced crawling peg. This system promotes the emergence of a nominal path which poses no risk to economic equilibrium, while ensuring convergence of the domestic inflation rate towards the level of Hungary’s main trading partners.
The consumer price index continued to follow a downward trend in 2000, with an annual rate of 9.2% recorded in April. Further decline in the CPI was hampered by a number of fac- tors over which monetary policy has no control, such as oil and food price increases, as well as the strengthening US dollar. In spite of the factors hindering disinflation, the Bank’ core in- flation index, which filters out the effect on headline inflation of seasonal foodstuffs, petrol, certain other energy and regulated prices, indicated a marked fall in the rate of inflation (to 7.3% in April 2000). The inflation differential relative to the European Union, as measured by harmonized price indices, has also continued to decline, falling under 7.5% in April. This im- plies that the increase in imported inflation has not exerted significant cost side inflationary pressure which could have considerably diverted the economy from the disinflation path.
Nevertheless, an evaluation of the steady decline in the rate of inflation should also take into account that, due to the system of some backward looking energy price regulations, the ef- fects of international energy price increases take longer to exert inflationary pressure in Hun- gary than in our main trading partners.
Industrial products prices directly disciplined by the exchange rate experienced smaller increases in 2000 Q1 than the rate at which the forint depreciated. In contrast to the previous year, the slow pace of regulated price increases has also put downward pressure on inflation.
By contrast, disinflation in market service prices lost momentum, with inflation even acceler- ating in respect of some demand-sensitive services. This was partly associated with the faster growth of input costs caused by the deterioration in the terms of trade, and partly with a steady rise in consumer demand. The growing gap between the inflation rates of tradable and non-tradable goods is attributable to the cyclical position of the economy and poses no threat to the sustainability of the exchange rate path, as it is accompanied by a further improvement in competitiveness rather than a deterioration.
The main issue in respect of further disinflation is that rising input prices should not be allowed to generate a cost-price inflationary spiral: the economy should be able to adapt to relative price changes by means of a one-off change in the price level. It should be emphasised that the rise in input prices equally affects the euro area and Hungary’s main trading competitors. Consequently there is no deterioration in the country’s com-
Summary
petitiveness, while the prospective increase in the import account is not expected to pose balance of payments problems. Therefore, the central bank need not adopt a more ac- commodating exchange rate policy in response to the deteriorating terms of trade. As in- flation in euro-area countries is affected by commodity and energy price increases in a similar way as in Hungary, the ECB’s interest rate policy will result in a tightening of mone- tary conditions, which will also be reflected in the National Bank of Hungary’s policy de- cisions.
GDP growth continued to accelerate in 2000 Q1, to an estimated 6.8%. This rapid growth was primarily due to a further pick-up in external demand (exports of goods and services grew 21.1% in real terms), but GDP growth was also boosted by increased domestic absorp- tion (5.7%). In respect of the components of domestic absorption, household consumption has continued to expand markedly (4%). Year-on-year investment spending increased by 11.1%. Better sales possibilities have induced dynamic growth only in respect of stockbuilding, while the growth in fixed capital formation remained subdued. The expansion of imports caused by stronger domestic absorption has been offset by higher export receipts.
Hence, robust growth has not yet pushed up the net external financing requirement of the country; external borrowing amounted to 4.6% of GDP, similar to that experienced in the pre- vious year.
The greatest influence on Hungarian economic activity seems to have been exerted by the better cyclical position of Hungary’s chief trading partners. The European Union econo- mies, as well as CIS and CEFTA countries, all experienced stronger growth. Data on domestic trade reflect both these favourable tendencies and the capacity expanding effect of new in- vestments. According to customs statistics, export volumes have continued to rise at a rate above 20%, as against an 18% rise in the volume of import demand. However, the 2.3% deteri- oration in the terms of trade caused by rising world energy and commodity prices entailed ad- verse changes in net exports calculated in euro terms.
Looking at the components of domestic demand, growth in household consumption (4%) was slightly down on a year earlier, but still exceeds the rate at which incomes are grow- ing. Slower growth of consumer spending is probably due to the slower rise in social bene- fits. By contrast, consumption funded from credit continued to expand. In parallel with strong borrowing activity, gross household saving has continued to grow weaker. The rela- tive size of gross saving components, namely financial savings and investment, remained broadly unchanged, with a consistently high share of investment and the share of financial savings relative to disposable income below 4%.
Investment demand remained subdued in 2000 Q1, exceeding the figure for a year ear-
lier by as little as 7%. The investment rate in manufacturing rose by a marginal 2.5%, in con-
trast with the service sector, which reported continuing strong growth. The investment boom
seen in 1998 (with a 24% rise in manufacturing) created capacities apparently sufficient even
to satisfy the growing number of orders at the beginning of 2000. Against the background of
better external cyclical conditions, rising numbers of orders and stronger industrial produc-
tion, the outlook is for more robust investment activity for the rest of the year. The results of a
business cycle survey conducted at the end of the first quarter indicate levels of average ca-
pacity utilisation close to the “historical” peak of 1998 Q1. The proportion of companies re-
porting excess capacities reflects a similar tendency. By contrast, the number of companies
reporting capacity shortages has not increased: compared with 8.5% in the second half of
1997, now only 5.1% of manufacturers reported insufficient capacities relative to prospective
demand. This suggests that not even the second half of the year is likely to reach the fast accel- eration in investment activity last seen in 1998.
According to budget plans, the government intends to restrict aggregate demand growth by 0.1% of GDP for the year as a whole. In 2000 Q1, the SNA-type primary balance improved by 2.1% of GDP, compared with a year earlier, but the restriction of demand was partly a one-off development caused largely by the base effect of the extremely adverse fiscal posi- tion recorded in 1999 Q1. After removing such temporary effects, the demand restricting im- pact stands at 0.4% of GDP. This better-than-expected position is the result of built-in stabilis- ers as the faster-than-planned growth and higher inflation tend to push up budget receipts, while expenditures are nominally fixed. Furthermore, the unforeseen expenses in the after- math of natural disasters were financed via a reallocation of budgetary expenditures. Never- theless, part of the improvement in the fiscal position due to the higher-than-expected rate of inflation is only temporary as it may necessitate subsequent supplementation of pension ex- penditures.
As indicated by the weak investment activity, the acceleration in economic growth has not yet been constrained by a shortage of productive capacities. At the same time, utilisation of the potential labour force has continued its upward trend, bringing the rate of unemployment down to 6.5%. The rate of wage inflation declined to 11.6%. The rate of wage inflation (not to be confused with the wage index computed by the Central Statistical Office; see related discus- sion in Box, Chapter IV) declined to 11.6%. The difference between the rates of wage growth in the market sector (11.4%) and the public sector (12.1%) decreased as compared to previous years. In certain sectors, in particular in mechanical engineering and the category of transport, storage, postal services and communication, the increase in the number of hours worked may also signal a tightening of the labour market. It should be emphasised, however, that in the de- mand-sensitive service sectors, which are crucial to the rate of inflation, the stronger rate of price increases was coupled with a slowdown in wage growth.
Although the favourable cyclical position of the economy usually entails a rise in external financing, and the deterioration in the terms of trade also tends to push up the current ac- count deficit, the seasonally adjusted value of the first-quarter net external financing require- ment of 3.8% was nearly identical to the figure for the average of last year. This moderate need for external funding was partly due to the fact that in 1999, there was a temporary rise in the current account deficit, as a result of the Russian crisis. On the other hand, investments with relatively high import needs expanded at a subdued rate, despite robust economic growth.
As the recent rise in foreign trade values based on customs statistics is only recorded in the balance of payment statistics after a delay, the current account deficit conveys an even more favourable picture, with a deficit of EUR 378 million in the first three months, financed pre- dominantly by non-debt-creating net capital inflows (EUR 280 million).
The composition of the net financing requirement has undergone significant changes compared with a year earlier. The private sector’s growing need for funds has been offset by a decline in the government’s financing requirement. Within the private sector, households’
savings position worsened by roughly 2%, while the financing needs of companies remained unchanged, compared with the same period the year earlier. However, the prospective in- crease in investment activity is likely to give added impetus to the financing requirement of businesses.
The beginning of the year was characterised by an easing of monetary conditions, which
returned to levels experienced prior to August 1998. Despite the cut in the pre-announced
monthly rate of devaluation to 0.3% on April 1st, the faster-than-expected drop in the inflation differential between Hungary and the euro area caused the real exchange rate to remain virtu- ally unchanged, simultaneously with a considerable drop in the level of nominal interest rates, resulting in an over 400-basis-point drop in yields between late October and early March. The fall in yields may be attributed to the better general perception of emerging mar- kets, the fall in the premium on interest rates following the dissipation of concerns related to the millennium date change, stronger domestic macroeconomic indicators and growing ex- pectations of an appreciation of the Forint. In order to stabilise monetary conditions, in a statement published on February 28th the Central Bank Council emphasised its commitment to maintaining the narrow-band crawling band regime, as a means of providing an effective nominal anchor for economic agents, which effectively, promotes further disinflation, while reducing the volatility of the real exchange rate. On the basis of a decision passed by the Cen- tral Bank Council, the National Bank of Hungary altered some of its policy instruments in a number of steps, in order to enhance the Bank’s scope of action in setting interest rates consistently with domestic economic developments. Banks incur additional costs on external borrowing, both in the form of reserve requirements imposed on such funds and additional costs levied on on-balance-sheet open positions. In order to boost the effectiveness of interest rate transmission, the Bank has embarked on auctioning a new three-month instru- ment.
International capital market developments appeared to facilitate the central bank’s steri- lisation efforts, when the European Central Bank and the Fed raised their leading rates by 50 basis points as of March, reducing the allure of the forint’s interest premium and, thus, that of speculative forint-denominated instruments. In addition to these interest rate hikes, the global dwindling of investor confidence and the growing uncertainty surrounding developed country capital markets were also important factors in the declining demand for riskier assets, including investments in emerging markets. As a result of the rise in the interest rate premium on forint investments, the yield curve was up by 80-100 basis points compared with an early March low.
Both foreign investors and domestic residents have increased their forint-denominated
investments recently. The first two months of the year were characterised by strong inflows of
interest-sensitive capital, entailing a high demand for conversion and a rapid expansion of
the stock of sterilisation instruments. As of March, partly as a result of central bank measures
and partly owing to changes in international money markets, there has been a decline in de-
mand for forints, causing the exchange rate to drift from the strong edge of the band on sev-
eral occasions. In respect of domestic economic agents, households have continued to in-
crease the weight of forint-denominated instruments in their portfolios. Considering the ex-
ternal financing of the corporate sector, there was a rise in the share of foreign currency bor-
rowing. The current regulations on open positions encourage banks to lend in foreign cur-
rency terms, financed from external funds, which are cheaper than forint funds as far as the
perceived exchange rate risk is low.
Main macroeconomic indicators
1998 1999 2000
Q1 Q2 Q3 Q4 Q1 Q2 Q3 Q4 Q1
Growth rate (at constant prices) Changes over the same period of the previous year (%)
GDP* 4.4 4.9 5.4 4.7 3.5 3.9 4.5 5.9 6.8
Of which: domestic absorption 3.7 8.3 10.7 8.1 5.4 4.3 2.4 5.0 5.7
– final consumption 2.9 4.0 4.7 4.8 4.6 4.4 4.3 3.8 3.6
= household consumption 3.7 5.0 5.6 5.2 4.5 5.0 4.5 4.4 4.0
– investment 5.9 19.5 26.8 15.8 7.6 4.0 -1.6 7.6 11.1
= fixed investment 8.6 14.5 20.3 9.8 6.4 6.8 4.2 8.1 7.0
Export (GDP) 29.0 17.6 13.9 9.7 9.5 9.8 13.6 18.9 21.1
Import (GDP) 25.9 25.0 25.2 16.4 12.9 10.2 9.3 16.6 18.3
Real effective exchange rate index**
On CPI basis –3.0 –1.2 2.1 4.3 2.9 0.4 –3.6 –5.9 –3.0
On PPI basis 0.6 2.5 5.2 7.2 5.5 2.3 –1.7 –6.9 –6.6
On unit labor cost basis
(on value-added basis) –0.3 3.2 4.8 7.2 6.4 4.0 5.0 3.7 6.4
On unit labor cost basis
(on gross output basis) 5.9 8.5 9.2 10.0 7.5 4.8 5.6 6.5 9.9
Deficit As a percentage of GDP
General government deficit (cash flow basis)*** –7.6 –2.8 –4.4 –4.9 –10.1 –5.0 –2.7 –1.0 –4.0
General government primary balance*** 2.6 1.4 2.7 0.1 –0.2 0.3 3.7 3.5 3.3
EUR billions
Current account balance –0.4 –0.5 –0.4 –0.8 –0.5 –0.6 –0.1 –0.8 –0.4
Foreign direct investment (net) 0.4 0.5 0.2 0.4 0.3 0.3 0.3 0.7 0.2
Savings rate**** (%) 8.3 11.7 11.9 10.5 8.5 6.1 7.0 8.4 6.6
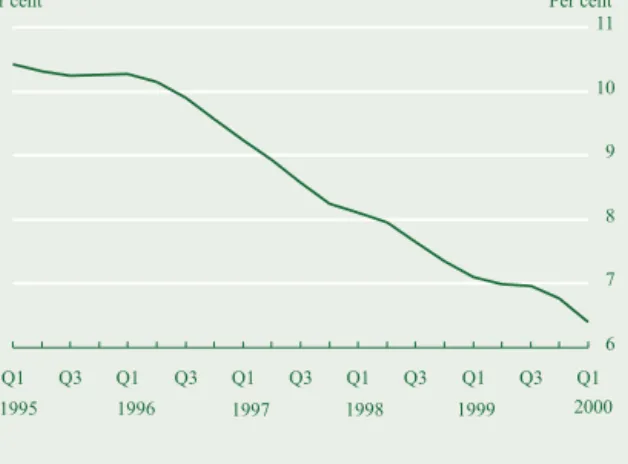
Unemployment rate+(%) 8.1 8.0 7.7 7.4 7.1 7.0 7.0 6.8 6.4
Wage inflation++
(Same period a year earlier = 100 %) n/a n/a n/a n/a 16.3 14.6 14.8 12.9 11.6
Net average per capita income in real terms+++
(Same period a year earlier = 100 %) 3.2 3.2 4.3 4.3 5.0 5.0 3.6 3.8 2.1
* These entries are partially based on Bank estimates, which may differ from data published by the Central Statistical Offi ce. Recent data on foreign trade and consumption have been revised as a result of a meth- odology change, consisting of the separation of business travel and the revision of the handling of foreign exchange purchased from residents. Net currency payments placed on household FX accounts continue to be accounted for in terms of the former methodology and not as travel credit.
** Positive figures indicate real depreciation; nominal exchange rate indices are calculated with market exchange rates from 1995; deflators refer to the manufacturing industry.
*** Estimated values, as there are no appropriate quarterly data for local governments.
**** Net financial savings of households as a percentage of total household income (notincluding the revaluation total due to exchange rate changes and other factors).+
Based on the labour-market survey of the Central Statistical office according to ILOstandards; number of unemployed people as a percentage of the active population; seasonally adjusted data..
++The Bank’s own wage inflation index; see related text in Box, Chapter IV. As there is no methodology consistent with the current one for calculating an index for the period prior to 1999, no data are published for the previous year.
+++National Bank estimate of net earnings of employees in companies employing at least five people and for the entire government sector, taking into account the effect of income tax changes.
Main monetary indicators
1998 1999 2000
Q1 Q2 Q3 Q4 Q1 Q2 Q3 Q4 Q1
Changes over the same period of the previous year (%)
Inflation (CPI)** 16.4 14.2 12.5 10.3 9.3 9.1 10.9 11.2 9.6
Producer price index** 13.5 11.6 10.4 7.1 4.9 4.5 4.8 8.2 9.9
Devaluation rate of the forint’s central parity 12.9 12.2 11.4 10.3 9.4 8.4 7.5 6.5 5.9
Real growth of monetary aggregates*
Changes over the same period of the previous year (%)
M0 1.7 3.3 3.7 5.8 8.5 7.9 3.9 11.5 6.2
M1 6.7 9.1 7.9 6.1 7.1 6.3 5.6 6.8 6.9
M3 2.3 4.0 4.6 4.4 8.0 7.1 5.0 4.3 5.0
M4 10.0 9.8 9.4 9.4 9.1 9.0 7.7 6.9 6.6
Real growth of loans extended by credit institutions**
Changes over the same period of the previous year (%)
Corporate sector, foreign + domestic* 13.1 14.5 16.4 11.2 13.4 10.8 7.0 13.4 17.3
Corporate sector, domestic 14.5 15.5 15.6 9.9 11.0 7.2 3.5 11.3 15.8
Household –11.4 –2.4 2.4 0.8 11.6 14.0 17.8 20.4 28.0
Interest rates (%)**
Reverse repo/one month deposit*** 18.75 18.00 18.00 16.75 16.00 15.25 14.75 14.25 11.25
90-day Treasury bill 18.65 17.33 19.06 16.10 15.68 14.74 14.07 12.44 10.63
12-month Treasury bill 18.70 17.32 18.96 15.88 15.61 14.77 14.17 12.33 10.42
3-year Treasury bond 17.42 16.31 18.00 14.18 14.01 14.03 13.45 10.75 9.09
Budapest Stock Exchange (BUX) 8,656 7,806 4,571 6,308 5,490 6,486 6,747 8,819 11,000
Interest rate premium (bsp)**** 364 363 674 533 531 551 551 426 309
Conversion
Conversion, EUR millions 2,253 850 –1,996 –175 313 239 1,211 1,043 1,466
Banking sector net foreign borrowing,+EUR millions* 854 231 –617 –158 7 –173 151 312 707
Corporate sector net borrowing,++EUR millions* 384 –24 209 579 109 753 390 316 –199
* Based on methodology considerations, the Bank has retroactively revised the monthly balance of payments accounts, as well as certain entries for foreign-related assets and liabilities published for 1995–1999.
** At the end of the period, in respect of government securities, reference yields of the State Debt Management Centre.
*** The maturity of the reverse deposit facility was reduced from one month to two weeks as of January 8, 1999.
**** Interest rate premium: excess yield on three-month T-bill investment over the devaluation rate and foreign interest rates. The current devaluation rate was modified upon official announcement of the change.
+Excluding privatisation revenues.
++Including inter-company loans.
T
he twelve-month consumer price index stood at 9.2% in April, two percentage points down on the end of 1999 (11.2%). The core inflation index computed by the National Bank, which excludes the effects of changes in seasonal food- stuff prices, as well as certain energy and regulated prices, has re- flected a stronger disinflation trend: the index stood at 7.3% in April, following a steady decline over the past 12 months(see Chart I-1).Inflation in the euro area has recently gained momentum, with the euro-area harmonised price index (MUICP) rising from last year’s average rate of 1.1% to 2% this year. As a combined re- sult of the decline in domestic inflation and the acceleration of foreign inflation, convergence has speeded up, bringing down the inflation differential between Hungary and the euro area – measured in terms of a domestic indicator comparable with the MUICP – below the nearly 8.5% average recorded last year to un- der 7% during March and April 2000(see Chart I-2).
The Bank regards core inflation indices as the main measures of inflationary processes relevant for monetary policy. The un- broken trend of disinflation reflected by such indices suggests that the factors behind the temporary halt in the decline of the consumer price index last year and its stagnation since then are essentially not related to changes in aggregate demand and sup- ply. The slower decline in consumer prices is due to the impact of increases in world oil prices and a reversal of the earlier down- ward trend in unprocessed foodstuff prices. At the same time, there is no evidence that the sharper price increases in these cate- gories have caused cost-side inflationary pressure and pushed up the rate of inflation in other categories as well.
Disinflation in internationally-traded products, calledindus- trial products, has continued and even gained momentum rela- tive to the nominal exchange rate. By contrast, there has been a jump infood price inflation; this increase, however, has been completely confined to the category ofunprocessed foodstuffs, which is a noteworthy and positive development in respect of long-term disinflation. With regard toprocessed foodstuffs, there have been signs of a slowdown in inflation. Disinflation inmar- ket services, which are crucial for the long-term inflation trend, seems to have broken, along with an apparent rise in the price in- dex fordemand-sensitive market services. The cost-push from rising energy and food prices on the prices in this category is not negligible. In addition, stronger demand in the wake of house- holds’ rising real income has also pushed up prices in this cate- gory. In view of the fact that the trend of wage increases with re- spect to these activities has continued to lose much of its momen- tum, the Bank considers the higher rate of inflation to be a phe-
I. Inflation
5 7 9 11 13 15 17 19
J M M J S N J M M J S N J M
5 7 9 11 13 15 17 19
CPICore NBH Core CSO
1998 1999 2000
Per cent Per cent
Chart I-1 Consumer price index and core inflation indices
6 8 10 12 14 16 18
J M M J S N J M M J S N J M
6 8 10 12 14 16 18
Original
3-month moving average
1998 1999 2000
Per cent Per cent
Chart I-2 Inflation differential vis-à-vis the euro area, measured in terms of harmonised price indices *
* Difference in percentage points. Euro-area inflation is measured by the official har- monised consumer price index (MUICP), published by Eurostat. For comparability, Hungarian inflation is measured with an indicator which is consistent with the MUICP in terms of the consumer basket, and thus excludes goods and services not included in the MUICP (in 1999 and 2000, such items included pharmaceuticals, medical products, owner-occupied housing, health and educational services, as well as gambling). This index covers 90% of the original domestic consumer basket. For a more detailed discussion on the topic, see Box I-1.)
nomenon concomitant with the cyclical position of the econ- omy, thus posing no threat to the sustainability of the exchange rate path(see Chart I-3).
Regulated price inflation, which falls outside the scope of monetary policy, has remained subdued of late, reflecting the Government’s anti-inflationary commitment. Due to the lon- ger-term impact of one-off price hikes in January, the 12-month rate of inflation of centrally controlled prices sank to 10.2% by April, which is consistent with the Government’s inflation path of 6% for the year as a whole.
1See related studies in issue 7/1999 of the Statistical Review, a periodical of the Central Statistical Office.
2See Extended coverage and earlier release dates for the HICP, Eurostat Memo, No. 2/2000 (February 18, 2000).
Box I-1 How is inflation convergence towards the euro area measured?
Within the context of European integration, the objective of the National Bank’s monetary policy – a sustainable reduc- tion of inflation – means narrowing the inflation differential between Hungary and the euro area. Evaluating the suc- cess of such convergence in inflation rates is only feasible using comparably defined and computed price indices.
The official measure of euro-area inflation is the Monetary Union Harmonised Index of Consumer Prices (MUICP), published by Eurostat, the statistics organisation of the European Union. The MUICP is a weighted average of the na- tional harmonised indices of consumer prices (HICPs), computed by the statistical offices of the member states. There is also a harmonised consumer price index, aggregated on the basis of similar principles, referring to the entire Euro- pean Union (EICP). The methodology of compiling harmonised consumer price indices at the national level is deter- mined by a number of European directives and guidelines produced in the course of the ongoing harmonisation pro- cess for price statistics compilation procedures launched in 1992. Harmonisation typically affects the types of goods and services covered by the price index, as well as data collection and compilation methods. In other words, the objec- tive is not the selection of one common consumer basket, but a pattern based on the same principles, which allows for differences between national consumption habits. Hence, national harmonised price indices can differ – and indeed frequently do – from the initial consumer price indices of the individual countries. Whether the harmonised index has replaced or merely supplemented the original index varies from country to country.
Hungary is also obliged by law to construct a harmonised consumer price index. Since the Central Statistical Office cur- rently does not publish such an index, the National Bank of Hungary, which – under a provisional arrangement and ex- clusively as a means of measuring inflation convergence – computes a harmonised price index for the Hungarian econ- omy, using the data provided by the Statistical Office and a methodology that is reasonably consistent with that used for the MUICP. Consistency is ensured by harmonising the categories of goods and services covered by the index with the HICP principles. In 2000, this means the exclusion of the price indices for the categories ofowner-occupied hous- ingandgambling(compared with the former practice of ex- cluding pharmaceuticals, medical products, health and beauty services). In harmony with Eurostat procedures, no 12-month index is to be constructed on the newly included categories.2 As far as the categories measured with 12-month price indices are concerned, the composition of the Hungarian HICP, com- puted by the Bank for 2000, covers nearly 90% of the original price index. Thus, due to the relatively high rates of inflation for the goods excluded, there remains a considerable differ- ence of nearly 1 percentage point between the original price index and the Bank’s harmonised price index at the level of 12-month price indices in 2000 as well. In terms of the inflation differential relative to the euro area, by convention it is mea- sured as the simpledifferencebetween the 12-month harmo- nised indices (MUICP and Hungarian HICP) that is taken, even though it would be more accurate to use theirratio, which would remove the distortion caused by the scale effect. Never- theless, relevant data suggest that so far this has had only a neg- ligible numerical impact.
8 11 14 17 20
-2 -1 0 1 2
J M M J S N J M M J S N J M
Difference (right scale) Original index Harmonized index
1998 1999 2000
Per cent Percentage point
Chart I-3 Official consumer price index published by the Central Statistical Office and the harmonised price index computed by the National Bank of Hungary
Same period a year earlier = 100, difference in percentage points
Box I-2 Inflation convergence towards the euro area by product categories
As was noted above, the convergence of the Hungarian index towards the Monetary Union index of consumer prices (MUICP) has been unbroken.
An analysis of the individual product categories can provide additional information on how the inflation differential between Hungary and the euro area is developing, as breaking down the differential between the average inflation rates into the differentials between the constituent parts may help pinpoint the individual categories which facilitate or, on the contrary, hamper the convergence manifested in the aggregate indices. In the latter case, it can be examined how inflation in the category concerned is being affected by monetary policy. On the other hand, in terms of both goods and factor mobility, the domestic economy has achieved such a high level of integration into the euro zone that it is likely to exhibit identical responses toshocksthat areexogenousto both regions. An examination of inflation conver- gence by individual product category may reveal if this is the case.
The data show that the category comprising what ourReportscall industrial goods and household energy products (including articles of clothing, furnishings, household equipment, household energy, goods for recreation) exhibits a clear trend of inflation convergence. Also, the transport category has converged recently, though to a lesser extent(see Chart I-4). By contrast, the inflation differential for food, alcohol and tobacco prices, as well as communication prices has been flat to rising(see Chart I-5).
The inference that monetary policy can draw from this is that inflation convergence has solid foundations and is comprehen- sive, since the divergence from corresponding rates in the euro area is due to temporary factors or factors falling outside the scope of monetary control.
One of such factors is that the foodprice deflation experi- enced in Hungary in 1998 did not occur (or occurred later and to a less extent) in the euro area, and its correction – as discussed in previousReports – is now manifested in terms of diverging rates of inflation. As far as the remaining categories are con- cerned, the effects ofregulationare passed on in the form of in- flation divergence: in respect of alcohol and tobacco prices, regulation has involved a rise in tax content, implemented in the framework of EU harmonisation.
The inflation divergence observed in respect ofcommunica- tionprices can be attributed to the fact that the drop in service prices in some Western countries following deregulation was not so significant in Hungary (prices for communication activi- ties in the euro area have beenfallingby 3-5% annually for a long time).
It may also be of significance that, unlike the MUICP, the Hungarian domestic price index does not include the prices of telecommunicationdevices(such as fixed line telephones, mo- bile telephones, fax machines, etc.), the price level of which – similar to that of all new goods – is likely to steadily decrease in Hungary as well.
The lesson for monetary policy is that the design of the do- mestic consumer price index (not to mention the effects of de- regulation on prices) should by no means be ignored from the aspect of Hungary’s inflation convergence and ultimate EMU membership.
At the same time, the inflation differential for communica- tion prices had also declined substantially by 2000, due primar- ily to a drop in the domestic twelve-month communication price index (of telephone and postal services). It is also impor- tant for monetary policy that the inflation differential intrans- portprices (especially when measured as a quotient) is steadily decreasing. This means that the exogenous oil price shock has elicited the same response from the two economies, as it has not affected the general trend of inflation convergence.
2 4 6 8 10 12 14 16
J J A S O N D J F M A M J J A S O N D J F M 2 4 6 8 10 12 14 Clothing 16
Housing, water, energy Furnishing, household equip.
Recreation, culture Hotels, cafes etc.
All
2000
1998 1999
Per cent Per cent
Chart I-4 Inflation convergence by product categories: converging main categories *
Difference between twelve-month indices, in percentage points
* NBH estimates: the 160 categories contained in the domestic consumer price index have been divided among the 12 main MUICP categories. Then the euro-area rates have been deducted from the twelve-month inflation rates of the main categories constructed with domestic weights. Three-month central moving averages. The same applies for Chart I-5.
0 5 10 15 20 25 30
J J A S O N D J F M A M J J A S O N D J F M 0 5 10 15 20 25 30
Alcohol, tobacco Transport Communications AllFood, drinks
1998 1999 2000
Per cent Per cent
Chart I-5 Inflation convergence by product categories: diverging main categories
Difference between twelve-month indices, in percentage points
1 Imported inflation
T
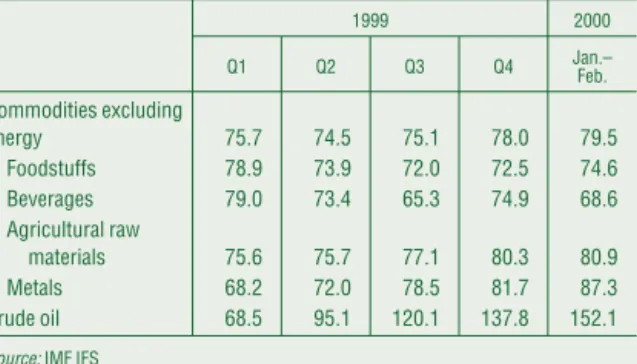
he global price trends seen in the second half of 1999 contin- ued in 2000 Q1: commodity prices, excluding energy, and crude oil prices continued to rise. Nevertheless, the pace of price increases seems to have lost some momentum. Compared with a 4% rise in commodity price indices and a 15% rise in oil prices over 1999 Q4, they were only up by 2% and 10%, respectively, in the first quarter this year. As far as raw materials are concerned, there was a nearly 7% upsurge in metal prices, and food prices, which had been falling a year earlier, also increased by 2% (see Table I-1).As a result of the 6–13% decline in food and beverage prices and the 7–28% rise in agricultural raw material and metal prices, relative to the equivalent period a year earlier, commodity prices excluding energy were up by 5%. The supply- restricting behaviour of OPEC and the drop in the level of re- serves caused a 126% jump in the price of crude oil relative to the low base in 1999 Q1.
Theimport unit price indexrose to 10.9% in 2000 Q1, from 7.6% in 1999 Q4, outstripping the forint’s pre-announced rate of devaluation by nearly 5%. A comparison with the nominal effec- tive exchange rate index yields an even larger difference of 6.6%.
A quarter-on-quarter comparison shows that the growth in the import unit price index lost momentum in the first quarter (down from 16.1% in 1999 Q4 to 9.9%).3
As a new development, 2000 Q1 also produced a rise in the imported inflation index based on effective foreign prices, up from 4.1% in 1999 Q1 to 8%. Thus, the increasing pressure of im- ported inflation can also be attributed to inflation affecting our chief trading partners. The price of machinery imports from de- veloped countries, which had put downward pressure on im- ported inflation in the past, was slightly above the pre- announced rate of devaluation.
Prices in this category rose by 6.8% compared with the same period a year earlier. As before, sharp increases in energy import prices caused the overall import price index from Central and Eastern Europe to jump by 39%.
Looking at individual product categories, energy import prices rose by 86%. Price increases in food, beverage, tobacco, as well as machinery and transport equipment imports amounted to 5–6% (5.7% and 5.2%, respectively). Processed goods and raw material import prices were up by 9.1% and 11.4%, respectively.
Hence, the strengthening of imported inflation can be equally at- tributed to the effect of energy and raw material price increases and the general inflation trends experienced by our chief trading partners(see Chart I-6).
As noted in the Bank’s MarchReport, the rapid pace of energy price increases and the weakening of the euro also caused a rise in the twelve-month consumer price index of euro-area coun- tries, Hungary’s most important trading partners. In March the rate was up to 2.1% from 1.2% in December, pushing the index over the 2% ceiling set by the European Central Bank for the first
Table I-1Changes in world prices in 1999–2000*
Compared to the 1995 average
Per cent
1999 2000
Q1 Q2 Q3 Q4 Jan.–
Feb.
Commodities excluding
energy 75.7 74.5 75.1 78.0 79.5
Foodstuffs 78.9 73.9 72.0 72.5 74.6
Beverages 79.0 73.4 65.3 74.9 68.6
Agricultural raw
materials 75.6 75.7 77.1 80.3 80.9
Metals 68.2 72.0 78.5 81.7 87.3
Crude oil 68.5 95.1 120.1 137.8 152.1
Source:IMF IFS
* World prices in dollars terms.
3Short-base indices are calculated from seasonally adjusted trend-cycle data.
0 2 4 6 8 10 12 14 16 18 20
Q1 Q2 Q3 Q4 Q1 Q2 Q3 Q4 Q1 Q2 Q3 Q4 Q1 0 2 4 6 8 10 12 14 16 18 20
Import unit-value index Currency basket Nominale-effective Effective foreign prices in HUF
Import unit-value index relative to developed countries
1997 1998 1999 2000
Per cent Per cent
Chart I-6 Import prices and exchange rate indices
time since the establishment of the Economic and Monetary Un- ion. Seven of the eleven member countries reported inflation rates in excess of 2%, with Ireland reporting the highest rate at 4.6%.
In April, however, falling oil prices caused euro-area con- sumer price inflation to return below the threshold of 2% (1.9%), which is more in line with expectations.
In March, the United States reported an unexpectedly sharp rise in the consumer price index. The 3.7% increase in the twelve-month index – the highest rate in a long time – was mostly due to rapid oil price increases. At the same time, the April drop on the previous month in other indicators, such as the rate of manufacturing capacity utilisation or retail turnover, reflects the fact that there is no need to fear that inflationary pressure will strengthen (in the course of April, both the pro- ducer and the consumer price indices declined to 3.7% and 3%, respectively).
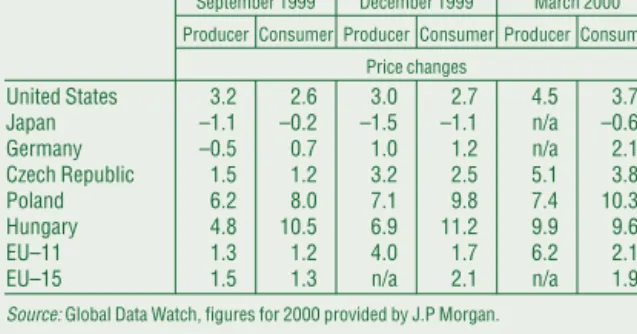
From its 5.6% low in April 1999, the twelve-month consumer price index in Poland began to accelerate and has been in the double-digit range since January of this year. Although inflation slowed somewhat in March to 10.3%, it was still higher than ana- lysts’ forecasts. In the Czech Republic, even against a back- ground of stronger economic activity and high oil prices, con- sumer price inflation rose to a rate of merely 3.8% in March, up from 3.2% last year. The favourable development of food and clothing prices was one of the factors in the subdued rate of price inflation(see Table I-2).
2 Components of changes in consumer prices
S
imilar to last year, the pace of disinflation was slowed by the rise in fuel prices and the acceleration of food price inflation over the first quarter of 2000. Moreover, the past few months have also witnessed the addition of demand-sensitive compo- nents of market services to the factors hampering disinflation(see Tables I-3 and I-4).Monetary policy is primarily able to influence market- determined price inflation, with special regard to industrial goods and market services.
Although regulated price inflation and market-determined price inflation are linked via inflation expectations and cost-side inflationary pressure, monetary policy instruments primarily have control over the latter group by influencing the nominal path of the exchange rate and aggregate demand.
The rate of inflation for prices typically determined by market forces remained around the average seen in the second half of 1999 (8.7%).
This, however, was partly due to the rise in fuel and non-regulated household energy prices. Together these pushed up the market sector price index by nearly 2 percentage points in the period from February to April.
The market sector price index excluding fuel and energy prices has been steadily declining since the end of 1999, in con-
Table I-2 International inflation data, 1999-2000 Relative to the same period a year earlier
Per cent September 1999 December 1999 March 2000 Producer Consumer Producer Consumer Producer Consumer
Price changes
United States 3.2 2.6 3.0 2.7 4.5 3.7
Japan –1.1 –0.2 –1.5 –1.1 n/a –0.6
Germany –0.5 0.7 1.0 1.2 n/a 2.1
Czech Republic 1.5 1.2 3.2 2.5 5.1 3.8
Poland 6.2 8.0 7.1 9.8 7.4 10.3
Hungary 4.8 10.5 6.9 11.2 9.9 9.6
EU–11 1.3 1.2 4.0 1.7 6.2 2.1
EU–15 1.5 1.3 n/a 2.1 n/a 1.9
Source:Global Data Watch, figures for 2000 provided by J.P Morgan.
Table I-4Contribution of certain product and service categories to changes in the inflation rate *
Relative to the same month a year earlier
Per cent
Weight in CPI
1999 Dec.
1999/
1998.Dec.
2000
Q1 Q2 Q3 Q4 Q1 April
Quarterly average, relataive to
previous quarter Relataive to 1999 Q4 Consumer Price Index
(CPI) 100.0 –1.8 –0.4 1.5 0.2 0.9 –1.0 –1.6
Categories causing a rise in the rate of inflation
Food 19.1 –0.9 –0.9 0.6 0.7 0.2 0.3 0.4
Alcohol and tobacco 9.4 –0.2 –0.1 0.0 –0.1 –0.3 0.1 0.1 Non-regulated house-
hold energy 1.3 0.0 0.0 0.0 0.1 0.2 0.0 0.0
Petrol 4.9 0.0 0.4 0.4 0.4 1.6 0.1 0.0
Categories offsetting the rise in the rate of inflation
Regulated prices 18.0 –0.1 0.2 0.6 –0.2 0.7 –1.0 –1.4 Industrial products 29.6 –0.3 0.0 –0.3 –0.4 –1.0 –0.4 –0.6 Market services 17.6 –0.3 0.0 0.0 –0.2 –0.6 –0.1 –0.2
* Due to rounding, figures do not always add up accurately.
Table I-3Inflation rates of various components * Relative to the same month a year earlier
Per cent Weight
in CPI
1999 2000
Aver-
age Dec. Jan. Feb. March April Consumer Price Index
(CPI) 100.0 10.0 11.2 10.0 9.8 9.6 9.2
Of which:
Industrial products, food, alcohol, excluding tobacco
and petrol 29.6 8.8 6.9 6.1 6.1 5.6 5.1
Petrol 4.9 18.7 37.8 30.7 32.4 36.7 29.7
Non-regulated energy 1.3 11.7 16.5 13.4 12.1 12.7 17.3
Food 19.1 1.7 5.4 5.7 5.4 5.6 6.3
Regulated prices 18.0 16.6 17.6 13.9 12.6 10.9 10.2 Market services 17.6 12.5 11.0 10.8 10.3 10.3 10.4 Alcohol and tobacco 9.4 11.5 10.6 10.9 11.9 11.7 11.5
Core inflation 89.9 9.3 8.8 8.1 7.8 7.5 7.3
Depreciation of the nomi- nal effective exchange
rate 7.0 2.7 4.2 5.0 4.1 5.4
Pre-announced nominal
devaluation of the forint 8.4 6.7 6.4 6.2 6.0 5.4
* The categories of items used as a basis for the consumer price index differs from those used by the CSO. See previous Reports for details.
trast with the index including the effect of such prices(see Chart I-7).
The market category is dominated by the group of interna- tionally-traded goods, calledindustrial goods. Monetary policy exerts direct influence over prices in this category by determin- ing the nominal exchange rate path, that is, via imported infla- tion. Underlining the long-term nature of the anchor role played by the exchange rate, the rate of industrial goods price inflation relative to the twelve-month depreciation rate of the forint’s cen- tral parity has been fluctuating within the ±1% range for a long period. Although movements within such a narrow range are not regarded as being statistically significant, the recent period has witnessed a narrowing and subsequent negative turn in the infla- tion differential, i.e. stronger disinflation in industrial goods prices. Within the category of industrial goods, attention should be given to the fact thatdurablesprices seem to be decreasing at a somewhat slower pace. This may be attributed to the demand effect of the first-quarter jump in retail sales volume growth (by 22%), an inference apparently contradicted by the fact that the sales boom in mid-1999 did not entail any changes in the rate of inflation. This question may be answered as further data become available in coming months.Non-durable goods price disinfla- tion has been uninterrupted, even gathering pace since Febru- ary, bringing the twelve-month overall rate of industrial goods price inflation down to approximately 5%(see Chart I-8).
Foodstuffs account for the second largest group within the sector of market-determined prices. The twelve-month rate of in- flation for this category, which exhibited a steady upward trend over the second half of 1999, seems to have stabilised around 6%
at the turn of 1999/2000. As pointed out in the MarchReport, this may well be a temporary development. Latest data indicate that food price inflation has picked up again, although at a slower pace than last year, edging close to 7% in April. However, this year’s trend differs from last year’s in two aspects. First, the re- sumption of the rise in the 12-month price index partly reflects the effect of the low base early last year, when food prices were falling. Second, unlike in 1999, the stronger rate of inflation af- fecting food prices as a whole over recent months seems to be confined tonon-processed foodstuffs, leaving the rate of inflation for processed foodstuffs unaffected. The acceleration in non-processed foodstuff price inflation comes as no surprise, as it is part of the correction of the deflationary trend seen in 1998.
Data indicate that the price increases beginning in mid-1999 have only recouped about three-quarters of the deflation-induced drop in the price level. As noted in the March Report, price changes in the category ofprocessedfoodstuffs are determined partly by unprocessed foodstuffs prices and partly by industrial goods prices. Data from recent months seem to indicate that in- flation in this category tends to resemble industrial goods price inflation. This, however, can only be confirmed as information from forthcoming months becomes available (see Charts I-9 and I-10).
The decline in the price inflation ofmarket services, which ac- count for nearly one-quarter of the private sector, has slowed over recent months with the twelve-month index still hovering just above single-digit range. Prices in this category are only indi- rectly affected by the path of the nominal exchange rate, via in- dustrial goods prices, i.e. via relative prices. The cost-push from
0 5 10 15 20 25
J M M J S N J M M J S N J M
0 5 10 15 20 Market determined 25
Regulált
Market determined excl petrol and energy CPI
1999
1998 2000
Per cent Per cent
Chart I-7 Consumer price index and its main componentsRelative to same period a year earlier)
-2 3 8 13 18 23 28 33 38
J M M J S N J M M J S N J M
-2 3 8 13 18 23 28 33 Household energy 38
Petrol Non-tradables Tradables Food
1999 2000
1998
Per cent Per cent
Chart I-8 Market determined price inflation and its componentsTwelve-month indices
-6 -4 -2 0 2 4 6
J M M J S N J M M J S N J M
-6 -4 -2 0 2 4 6 Relative to nominal effective exchange rate
Relative to currency basket
1999 2000
1998
Per cent Per cent
Chart I-9 Twelve-month relative rate of inflation of industrial goods
-15 -10 -5 0 5 10 15 20 25 30 35 40
J M M J S N J M M J S N J M
-15 -10 -5 0 5 10 15 20 25 30 35 40
Not processed Processed All foods
1999 2000
Per cent Per cent
Chart I-10Changes in price levels for food and its main categoriesRelative to the same period a year earlier