QUARTERLY REPORT
ON INFLATION
December
2000
V. Szabadság tér 8–9. H–1850 Budapest.
Head: Judit Neményi Managing Director Phone: 36-1-312-2469
Fax: 36-1-2690-753
Published by the Secretariat of the National Bank of Hungary Head: dr. József Kajdi Managing Director
Mailing: Miklós Molnár Phone: 36-1-312-4484
Fax: 36-1-302-3714 Internet: http: //www.mnb.hu
ISSN 1419-2926
Bank of Hungary with the aim of providing the general public with regular information on the current and expected state of inflation as well as the Bank’s interpretation of macroeconomic develop- ments determining inflation. Wider access to information on monetary policy objectives is expected to lead to a better under- standing of the Bank’s policy responses.
The goal of this publication is to describe and interpret the develop- ments of the preceding quarter.
1² ² ²
1The previous issues of the “Quaterly Report on Inflation” are available on the home page of the National Bank of Hungary.
SUMMARY . . . 9
I. INFLATION . . . 15
1 Inflation convergence . . . 15
2 Imported inflation . . . 16
3 Components of changes in consumer prices. . . 18
4 Core inflation . . . 24
II. MONETARY POLICY . . . 26
1 Monetary conditions and changes in the interest rate and the exchange rate . . . 26
1.1 Monetary base and demand for forint conversion . . . 29
1.2 Demand for forint conversion and its components. . . 30
2 Yield curve, interest rate and inflation expectations . . . 32
3 Interest rate policy of the commercial banks. . . 35
4 Monetary aggregates . . . 36
5 Demand for corporate credit . . . 37
III. DEMAND. . . . 38
1 Household consumption . . . 39
2 Investment . . . 41
3 The fiscal stance. . . 42
4 External demand . . . 43
IV. SUPPLY. . . 49
1 The labour market . . . 49
1.1 Labour utilisation. . . 49
1.2 Labour reserves and the risk of labour market tightening . . . 51
1.3 Wage inflation. . . 54
2 Capacity utilisation . . . 56
3 Competitiveness . . . 56
V. EXTERNAL EQUILIBRIUM. . . . 59
1 Net savings position . . . 59
2 Current account and its financing . . . 62
3 International investment position . . . 65
Contents
1998
Changes in the central bank’s monetary instruments . . . 23
Wage inflation – the rise in average wages . . . 62
Wage increases and inflation . . . 63
Impact of international financial crises on Hungary . . . 85
March 1999 The effect of derivative FX markets and portfolio reallocation of commercial banks on the demand for Forints . . 20
What lies behind the recent rise in the claimant count unemployment figure? . . . 34
June 1999 New classification for the analysis of the consumer price index . . . 14
Price increase in telephone services . . . 18
Forecasting output inventory investment . . . 32
Correction for the effect of deferred public sector 13thmonth payments . . . 39
What explains the difference between trade balances based on customs and balance of payments statistics? . . . 44
September 1999 Indicators reflecting the trend of inflation . . . 14
The consumer price index: a measure of the cost of living or the inflationary process? . . . 18
Development in transaction money demand in the South European countries . . . 28
Why are quarterly data used for the assessment of foreign trade? . . . 37
The impact of demographic processes on labour market indicators . . . 41
What explains the surprising expansion in employment?. . . 42
Do we interpret wage inflation properly? . . . 45
December 1999 Core inflation: Comparison of indicators computed by the National Bank of Hungary and the Central Statistical Office . . . 18
Owner occupied housing: service or industrial product? . . . 20
Activity of commercial banks in the foreign exchange futures market . . . 26
March 2000 The effect of the base period price level on twelve-month price indices – the case of petrol prices . . . 19
The government’s anti-inflationary programme in the light of the January CPI data and prospective price measures over 2000 taken within the regulated category . . . 21
The impact of the currency basket swap on the competitiveness of domestic producers . . . 51
Quarterly report on inflation
June 2000
How is inflation convergence towards the euro area measured? . . . 14
Inflation convergence towards the euro area by product categories . . . 15
Changes in the central bank’s monetary instruments . . . 23
Transactions by the banking system in the foreign exchange markets in 2000 Q2 . . . 26
Coincidence indicator of the external cyclical position . . . 39
How is the wage inflation index of the NBH calculated? . . . 47
September 2000 Background of calculating monetary conditions . . . 20
Foreign exchange market activities of the banking system in 2000 Q3 . . . 25
December 2000 Changes in the classification methodology of industrial goods and market-priced services . . . 25
Different methods for calculating the real rate of interest . . . 27
Changes in central bank instruments . . . 28
Foreign exchange market activities of the banking system in the period of September to November . . . 31
Hours worked in Hungarian manufacturing in an international comparison . . . 53
Composition effect within the manufacturing price-based real exchange rate . . . 57
T he National Bank of Hungary’s policy target is to achieve price stability and a sustainable decline in inflation. Predictability and moderate interest rates, concomitant with a low inflation environ- ment, are both factors which facilitate long-term, rapid economic growth. Achievement of the infla- tion target is assisted by an exchange rate regime based on a pre-announced crawling peg. This sys- tem promotes a nominal path which poses no risk to external balance, while ensuring convergence of the domestic inflation rate towards the level of Hungary’s main trading partners.
The third quarter of 2000 continued to be dominated by adverse inflationary shocks, with inertial effects also playing an increasing role. The main factor to blame for the upsurge in inflation is the sharp rise in (non-processed) food prices in the wake of regional supply shocks at the end of last summer. Another reason for the adverse developments is that the rapid rise in imported energy prices, which started one and a half years ago, has been incorporated into consumer prices after the appropriate lags. As a result of these effects, the twelve-month consumer price index (CPI) returned to the double-digit range once again in September, and rose to 10.4% in October. Although the in- crease in the CPI was primarily caused by one-off factors that are exogenous to monetary policy, the rise in core inflation seen since July also reflected an increase in the trend of inflation. The core CPI calculated by the National Bank of Hungary removes the effects on inflation of seasonal foodstuffs, petrol and certain energy and regulated prices, in an effort to monitor changes in the components that have a long-term impact on inflation. Following the 7% low measured in June, this core index rose to 9.6% in October.
In view of the fact that international economic forecasts do not predict that inflationary shocks (such as energy and food price shocks and the weakness of the euro) on the scale experienced during 2000 will occur again next year, the current rise in inflation will probably remain a temporary phe- nomenon.
The third-quarter rise in imported inflation also contributed to the strengthening of unfavour- able inflationary pressures, as reflected in a 15% rise in the import unit value index. Again, this was partly due to energy price rises, but there was also a considerable simultaneous increase in the infla- tionary pressure experienced by Hungary’s main trading partners. The rise in inflation, however, was lower than that seen in Hungary, which pushed up the differential relative to the euro area to 7.8 per- centage points. This unwelcome development was primarily due to the fact that the impact of an in- crease in food prices in the euro-area countries is dampened by regulation, but the higher weight of energy in the Hungarian consumer basket was another factor. In respect of commodities that are di- rectly disciplined by the exchange rate path (such as industrial goods), the inflation differential re- mained at the level seen in the previous quarter.
In contrast to the previous year, regulated prices changes appeared to assist disinflation. In the category of services with regulated prices, accounting for 9% of the consumer basket, prices rose at a rate of 7.2% in October – a much slower pace than market services (11.9%). At the same time, eco- nomic policy considerably dampened the impact of imported energy prices on domestic consumer prices, by allowing only of small portion of input cost increases in pipeline gas and public transport prices to be passed on to households. This stifling of the price level together with the indirect
Summary
cost-push of the oil price explosion, which will emerge after a long lag, may exert significant infla- tionary pressure in the future.
Inertial effects are exerting increasingly greater influence over the course of inflation. This is re- flected in private sector wage growth. The decline in inflation is being hampered by the fact that wage growth did not slow relative to the previous period. This effect also fed through to services prices. In addition, input price increases take a shorter time to feed through to services prices than rises in in- dustrial goods prices, as the latter enjoy faster productivity growth and are directly disciplined by the exchange rate. As price increases were not hampered on the demand side either, the rise in wages and other costs were incorporated into services price growth, which was close to 12% in October. The difference between market services and industrial goods prices rose to 7.2%.
GDP growth continued to decline in 2000 Q3, amounting to 4.6% according to preliminary fig- ures. The rate of demand growth was primarily determined by a decline in net export growth. In addi- tion to nearly flat export growth (at 20.6% of GDP), imports rose at a 4-percentage-point higher rate than in the previous quarter, (at 16.4% and 20.2% of GDP in 2000 Q2 and Q3, respectively). Based on the currently available data it remains unclear whether the higher import requirement is the result of domestic demand or export growth. This is because it was predominantly intermediate goods im- ports that expanded, which are used as input in both areas. Similarly to the second quarter, final con- sumption in the third quarter rose by 3.3%, while investment growth dropped to 2.2%. Rise in inven- tories contributed 1.7 percentage points to GDP growth, inclusive of measurement errors.
Buoyant external activity continued during the third quarter. Confidence indices and for- ward-looking indicators equally suggest that the peak in aggregate demand growth experienced by Hungary’s main trading partners is likely to have occurred during this quarter. Exports to the CEFTA countries rose by 37%, outstripping export growth both to the developed countries (31%) and the EU countries (29%). Export rates to the CIS countries remained flat. Due to a 3.1% deterioration in the terms of trade caused by the increase in world prices for energy and commodities, the balance of trade calculated in euro reflected a worse situation than the volume data. The increase in the season- ally adjusted deficit on the customs-statistics-based balance of trade continued during the third quar- ter.
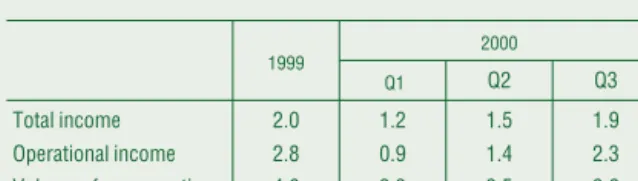
Of the components of domestic demand, consumer spending continued to expand at a slower pace than last year (3.6%), though still above income growth (operational income growth was 2.3% in the year to the third quarter). The decline in consumer spending growth is likely to have been caused by slower growth in pecuniary social benefits, as net earnings rose at an approximately 4% rate.
Credit-financed consumer spending remained flat during the quarter. The narrowing gap between income and consumption growth rates led to a rise in the gross saving rate to 10.7%, up 0.8 percent- age points on the previous quarter. Furthermore, the composition of gross saving also changed. The inflation-adjusted financial saving rate of 4.9% exceeded both the rate for a year earlier (3.3%) and for the previous quarter (3.1%). By contrast, the 6.4% investment rate was 1.3 percentage points down on a year earlier, despite strong growth in building and property purchase loans. The unexpected up- surge in financial savings was primarily due to one-off wage outflows, as well as increased caution arising from the higher-than-expected inflation.
Whole-economy investment expanded by 2.2% relative to 1999 Q3, which fell short of both ex- pectations and the rates for previous quarters. This slower investment growth could not be foreseen in either industrial output or capacity utilisation changes, with the only telltale sign perhaps being subdued growth in investment imports.
The SNA-based primary balance of the government improved by 1.0% of GDP relative to 1999
Q3; thus, the general government restricted demand to this extent. Although a considerable portion
of this fiscal tightening will not last and stems from the changing seasonality of expenditures, fiscal
policy is expected to remain tight for the year as a whole. This better-than-expected position is attrib-
utable to the effect of the automatic stabilizer, as stronger-than-expected growth and higher inflation
tend to boost fiscal revenues, while expenditures are nominally fixed. In respect of pension expendi-
tures, accounting for nearly 70% of transfer payments, there will be a correction for the infla- tion-induced loss in value during the fourth quarter.
As reflected in weak investment activity, so far faster economic growth has not run into capacity shortages. Nevertheless, manufacturing capacity utilisation rose to over 81%, simultaneously with a rise to over 10% in the proportion of companies reporting capacity shortages relative to prospective orders. Potential labour use also increased. Employment growth to over 50%, induced by a 1.3% ex- pansion in private-sector employment, and a parallel rise in total hours worked reflect steady, exten- sive growth in the use of labour. The drop in unemployment to 6%, in addition to the lowest rate of collective redundancies seen in the past few years and rising average hours worked, especially in manufacturing, warn of tightness in labour reserves. The tight labour market is accompanied by high nominal wage growth in the private sector. Although private-sector wage inflation tapered off some- what in a quarter-on-quarter comparison, the 13.2% rate in the third quarter can be regarded as a sign of nominal accommodation to the higher-than-expected inflation path. The increased wage bill was covered by stronger manufacturing productivity and higher services price inflation. Although the 11.9% wage index in the public sector is somewhat above the announced rate, this is broadly due to fiscal institutions’ wage rises funded from their own resources and to one-off extra sums in healthcare paid in July.
The demand structure in the third quarter was conducive to equilibrium, as robust export growth was accompanied by moderate domestic absorption. This, however, did not prove to be suffi- cient to offset the price losses triggered by persistently high levels of external energy and oil prices, boosting the country’s financing requirement to 3.4% of GDP. At the same time, this rise in the financ- ing requirement could only partly be attributed to losses caused by deterioration in the terms of trade.
In 2000 Q3, nominal deterioration in the balance of trade was simultaneous with a capital outflow via current forint transfers. The higher net position was due to the higher private sector financing re- quirement as the public sector’s need for funds declined during the quarter.
There was a significant change in the composition of the private sector’s financing requirement relative to the previous year. Households’ improved financing capacity, which was primarily due to temporary factors, was accompanied by a higher corporate borrowing requirement. Although busi- ness profitability continued to increase in an environment of robust economic growth, it fell short of the rate of GDP growth, and adverse price effects and foreign residents’ profit repatriation worsened companies’ financial position (as a proportion of fast-growing GDP).
These factors combined led to a deficit of EUR 126 million on the current account of the balance of payments. Despite further improvement in the balance of services, the deteriorating trend in the trade balance exerted downward pressure on the overall trend of real-economy transactions. The balance of transfer payments also registered a rise in net income outflows linked to non-debt invest- ments.
The third-quarter deficit on the current account of the balance of payments was financed by waning non-debt-generating (EUR 92 million) net capital inflows, while financing by debt-type in- vestments was characterised by net capital outflows. In respect of non-debt-generating items, net eq- uity purchases within foreign direct investment and the acquisition of ownership stakes amounted to EUR 320 million, as a result of an inflow of EUR 519 million and an outflow of EUR 199 million. This greatly exceeded the deficit on current account in its own right. This, however, was offset by foreign direct investment by Hungarian resident companies, at nearly EUR 200 million, which can be traced back to one single exceptionally large transaction. Following a slowdown during the second quarter, the private sector began to step up its borrowing again during the third quarter. Credit institutions pri- marily used foreign-currency funds to increase financing loans to the corporate sector.
The strengthening of the inertial components of inflation and the development of labour-market
bottlenecks, still accompanied by rapid growth and a favourable corporate sector position, called for
the tightening of monetary conditions. Although the stronger real appreciation caused by rising infla-
tion tightened monetary conditions in the third quarter, the drop in forward-looking real interest rates
was a major cause for concern. Therefore, the central bank made a proposal to the government to re- place the exchange rate regime as a means of obtaining greater flexibility in dealing with the impact on inflation of external price shocks. In the absence of an agreement with the government on the tim- ing of the change, the Bank was left no other means of responding to the visible rise in inflation than via interest rate policy. This is the background for the 100-basis-point rise in the benchmark rate on October 11
th. In order to control sterilization costs, the central bank also modified its sterilization in- struments as of October 24
th, in respect of the conditions of the two-week deposit facility. In terms of the change, periodical availability was replaced by volume bidding as of October 31
st. A volume ten- der means that the Bank invites bids for deposits up to a pre-set amount. Central bank clients can then make competitive bids, stating the rates of interest they are willing to accept, in view of the an- nounced interest rate ceiling.
The 100-basis-point rise in the interest rate premium did not induce any interest-rate sensitive capital inflow before the end of October, as international capital markets were characterised by nega- tive investment sentiment about riskier investments (such as those in emerging markets). This pushed up the required interest rate premium. External demand for forint investments and the inter- est rate premium on the forint was dampened by the fact that the same period also saw a temporary rise in euro yields. Speculative forint demand during the period under review was, in all likelihood, curbed by the August 31
stsession of the Central Bank Council, which made it clear to the markets that, contrary to previous expectations, there would be no cut in the rate of devaluation in the course of 2000. As, despite the higher interest rate premium, the speculative demand for forint investments re- mained subdued, the forint’s exchange rate moved away from the strong edge of the band by an aver- age of 30–40 basis points, which implies that the size and timing of the interest rate hike was justified.
The underlying factors in the significant rise in long-term market yields beginning from mid-August were the rise in inflation expectations and the increase in the risk premium caused by greater uncertainty. The September inflation figure and the central bank interest rate hike drew a strong reaction from the government securities market, with the rise in short-term yields approximat- ing the rise in the central bank rate, and that in yields with the longest terms to maturity at roughly 60 basis points. From end-October, the sharp rise in forint yields induced capital inflow on the govern- ment securities market, which, however, was dampened by the weaker risk rating of emerging mar- ket investment. Following a temporary phase in the aftermath of the interest rate hike, there was a slight drop in long-term yields – especially those with maturities of up to 10 years – which reflects fa- vourable changes in medium-to-long term inflation expectations during the period following the rise in the interest rate.
The rise in central bank and market rates fed through to commercial bank rates as early as Octo- ber. Interest rate transmission was fastest and most efficient in respect of corporate rates, while the pass-through of the rise in market rates into household rates was smoothed by commercial banks over a long period of time.
The slowdown in the real growth of monetary aggregates continued in 2000 Q3. In contrast to the past two years, the asset structure of both the household and corporate sectors saw a shift towards medium-to-long-term time deposits. Households seemed to give preference to assets outside M4 (such as shares, life insurance reserves, pension-fund savings), which reduced real growth in the household components of monetary aggregates. By contrast, the weight of government securities and, to a smaller extent, that of time deposits began to increase within corporate sector assets, at the expense of liquid assets. Thus, real M3 and M4 growth outpaced that of the corporate component of M1.
The third quarter witnessed a small rise in the net financing requirement of non-financial compa-
nies. While the volume of borrowing did not change significantly, there was an increase in the stock
of financial assets. However, in light of the much weaker-than-expected investment figures, this im-
provement fell short of the expected level. Thus, net positions suggest a drop in corporate-sector
profitability and/or an upsurge in the level of inventories.
Main macroeconomic indicators
1999 2000
Q1 Q2 Q3 Q4 Q1 Q2 Q3
Growth rate (at constant prices) Percentage changes on a year earlier
GDP* 3.4 3.8 4.5 5.7 6.6 5.8 4.6
Of which: domestic absorption 5.3 4.2 2.4 4.8 5.7 3.7 4.5
– final consumption 4.3 4.3 4.1 3.6 3.0 3.2 3.3
= household consumption 4.5 5.0 4.6 4.4 3.3 3.5 3.6
– investment 8.0 3.9 –1.4 7.4 12.7 4.8 7.5
= fixed investment 5.7 6.1 3.6 7.5 7.0 5.5 2.2
Exports (GDP) 9.5 9.8 13.6 18.9 21.5 20.9 20.6
Imports (GDP) 12.9 10.2 9.3 16.6 18.9 16.4 20.2
Real effective exchange rate index**
On CPI basis 2.8 0.3 –3.5 –5.7 –3.1 –0.9 –1.2
On PPI basis 5.2 1.9 –2.5 –6.6 –6.1 –4.7 –5.5
On unit labour cost basis (on value-added basis) 6.4 5.0 4.7 3.2 4.3 4.6 3.7
On unit labour cost basis (on gross output basis) 8.5 6.5 7.3 6.5 10.1 11.7 11.5
Deficit As a percentage of GDP
General government deficit (cash flow basis))*** –9.5 –5.9 –4.4 –2.9 –4.5 –3.9 –2.4
General government primary balance*** –1.5 0.1 1.8 2.7 1.3 1.7 2.7
EUR billions
Current account balance –0.5 –0.6 –0.1 –0.8 –0.4 –0.5 –0.1
Foreign direct investment (net) 0.3 0.3 0.3 0.7 0.2 0.7 0.4
Savings rate**** (%) 8.5 6.4 6.9 8.4 6.7 5.9 8.0
Unemployment rate+(%) 7.1 7.0 7.0 6.8 6.5 6.5 6.2
Wage inflation++(Same period a year earlier = 100 %) 15.3 16.3 14.5 14.6 11.6 13.4 12.8
Net average per capita income in real terms+++(Same period a year earlier = 100 %) 5.0 5.0 3.6 3.8 2.1 3.2 2.7
* These entries are partially based on Bank estimates.
** Positive figures indicate real depreciation; nominal exchange rate indices are calculated with market exchange rates from 1995; deflators refer to the manufacturing industry
*** Estimated values, as there are no appropriate quarterly data for local governments.
**** Net financial saving of households as a percentage of total household income (notincluding the revaluation total due to exchange rate changes and other factors).
+Based on the labour-market survey of the Central Statistical Office according to ILO standards; number of unemployed as a percentage of the active population; seasonally adjusted data.
++Wage inflation is calculated by the National Bank, see June Report. As there is no consistent methodology by which to compute the index for the period prior to 1999, there are no figures for the years previous to 1999.+++
National Bank estimate of net earnings of employees in companies employing at least five persons and for the entire fiscal sector, taking into account the effect of income tax changes.
Main monetary indicators
1998 1999 2000
Q1 Q2 Q3 Q4 Q1 Q2 Q3 Q4 Q1 Q2 Q3
Percentage changes on a year earlier
Inflation (CPI)** 16.4 14.2 12.5 10.3 9.3 9.1 10.9 11.2 9.6 9.1 10.3
Producer price index** 13.5 11.6 10.4 7.1 4.9 4.5 4.8 8.2 9.9 11.6 12.8
Devaluation rate of the forint’s central parity 12.9 12.2 11.4 10.3 9.4 8.4 7.5 6.5 5.9 5.0 4.3
Real growth of monetary aggregates**
Percentage changes on a year earlier
M0 1.7 3.3 3.7 5.8 8.5 7.9 3.9 11.5 6.2 5.1 6.0
M1 6.7 9.1 7.9 6.1 7.1 6.3 5.6 6.8 6.9 7.6 5.4
M3 2.3 4.0 4.6 4.4 8.0 7.1 5.0 4.3 5.0 4.2 3.0
M4 10.0 9.8 9.4 9.4 9.1 9.0 7.7 6.9 6.6 6.5 4.7
Real growth of the stock of lending by financial institutions**
Percentage changes on a year earlier
Corporate sector, foreign + domestic 13.1 14.5 16.4 11.2 13.4 10.8 7.0 13.4 17.3 22.6 24.0
Corporate sector, domestic 14.5 15.5 15.6 9.9 11.0 7.2 3.5 11.3 15.7 20.7 23.3
Household –11.4 –2.4 2.4 0.8 11.6 14.0 17.8 20.4 28.0 30.6 30.8
Interest rates (%)**
Reverse repo/two-week deposit*** 18.75 18.00 18.00 16.75 16.00 15.25 14.75 14.25 11.25 11.00 10.75
90-day Treasury bill 18.65 17.33 19.06 16.10 15.68 14.74 14.07 12.44 10.63 10.50 10.75
12-month Treasury bill 18.70 17.32 18.96 15.88 15.61 14.77 14.17 12.33 10.42 10.42 10.71
3-year Treasury bond 17.42 16.31 18.00 14.18 14.01 14.03 13.45 10.75 9.09 9.43 9.95
Budapest Stock Exchange (BUX) 8,656 7,806 4,571 6,308 5,490 6,486 6,747 8,819 10,000 8,318 8,270
Interest rate premium (bsp)**** 364 363 674 533 531 551 551 426 309 227 208
Conversion
Conversion, EUR millions 2,253 850 –1996 –175 313 239 1,211 1,043 1,466 79 815
Banking sector net foreign borrowing,+EUR millions* 854 231 –617 –158 7 –173 151 312 707 8 464
Corporate sector net borrowing,++EUR millions* 384 –24 209 579 109 753 390 316 –199 –271 –308
* Based on methodology considerations, the Bank has retroactively revised the monthly balance of payments accounts, as well as certain entries for foreign-related assets and liabilities published for 1995–1999.
** At the end of the period, in respect of government securities, reference yields of the State Debt Management Centre.
*** The maturity of the reverse deposit facility was reduced from one month to two weeks as of January 8, 1999.
**** Interest rate premium: excess yield on three-month T-bill investment over the devaluation rate and foreign interest rates. The current devaluation rate was modified upon official announcement of the change.
+Excluding privatisation revenues.
++Including inter-company loans.
I
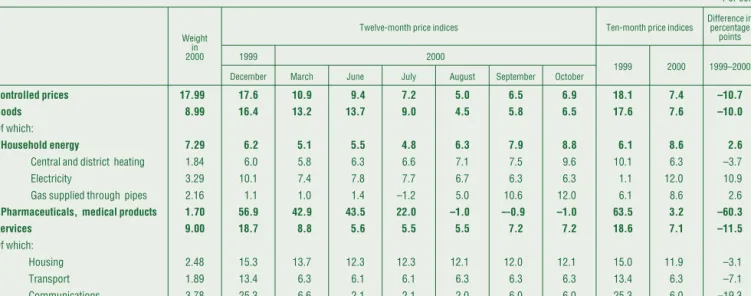
n 2000 Q3, the inflationary pressure first observed in the sec- ond quarter continued. The twelve-monthconsumer price in- dex(CPI) returned to the double-digit range in September, and reached 10.4% in October. The core inflation index calculated by the Central Statistical Office (CSO) stood at 8.7% in October, compared with the Bank’s core measure of 9.6%. August 1999 was the last time that the latter index reached such heights. It is now clear that not only has the robust trend of disinflation in progress up to 2000 Q1 come to a halt, but prices are again rising at an accelerating pace, due to the inflationary shocks on the economy. In contrast to the previous favourable trend, food pricesare no longer retarding the rise in the price level, but exert- ing upward pressure, pushing up the twelve-month index to 14.1% in October. Annual price inflation ofindustrial goods, dis- ciplined by the exchange rate path, has remained a little under 5% nearly uninterruptedly since April, and the annual index was at 4.7% in October. By contrast, the market services price index, which is primarily sensitive to domestic demand, has been on a steady increase for six months now, with the annual index reach- ing 11.9% in October. As a result of the global oil price explosion, market-determined household energy prices as well as vehicle fuel prices, rose at an over 25 % rate in the year to October.In respect of goods withregulated prices,the twelve-month inflation rate was only 7.0% in October, due to the government’s price control efforts. Inflation in excisables excluding vehicle fuel (alcohol and tobacco) remained in excess of 10%, standing at 11.7% in October.
Prices that are highly exposed to idiosyncratic shocks (energy and food) have been significantly affected by inflationary pres- sures recently, especially compared with last year’s favourable developments. Despite the government’s efforts to dampen the unfavourable trend with the instruments at their disposal (such as the stringent control of regulated prices), they have not been able to neutralise the impact of input price increases and, in re- spect of agriculture, the export demand shock. This impact may be incorporated into inflation expectations, reflected in the slow but steady rise in services price inflation, which is less strongly in- fluenced by external factors and exchange rate policy.
1 Inflation convergence
T
he European Union has recently been affected by the same inflationary shock as Hungary. Our main trading partners also experienced significant upward pressure on consumer en- ergy prices (leading to a 16% year-on-year rise in September),I. Inflation
triggered by the oil price shock. However, this rise remained be- low the Hungarian rate (24.4% in September and nearly 30% in October). Food prices also rose at a slower pace than in Hungary (by 2.2% in the year to October and 0.5% at the beginning of the year). The latter difference was partly due to the price stabilizing effect of the EU’s common agricultural policy, an effect which has been much more efficient than in this country. The impact of the inflationary shock on the euro area’s fairly stable services price index has been strongly muffled: the 1.9% rise in October was the result of a modestly rising trend from the 0.6% lower rate a year earlier. With the price index of internationally tradedin- dustrial goodsedging up, the 12-month index stood at 0.8% in September, up 0.3 % on the figure for the middle of the year.
As a combined result of the above factors, the Eurostat’s har- monised consumer price index (HICP) crept up to 2.8 % in the euro area in September, in a year-on-year comparison. The com- parable figure in Hungary was 10.6%. This made it clear that the process of convergence, measured by the inflation differential, was affected by an adverse change(see Chart I-1).
The factors to blame for the interruption of inflation conver- gence include the fact that the energy and July food price shocks had a stronger impact in Hungary (see Chart I-2). Energy- producing materials are given smaller weight in the euro-area consumer basket than in Hungary (household energy at 5.5%, compared with 8.6% in Hungary; motor fuel at 4% and 4.9%, re- spectively), similarly to food prices (16.7% and 19.1%, respec- tively). Furthermore, food price swings had a much smaller am- plitude in the euro area, thanks to more efficient market regula- tion and lower price volatility on the larger market. Nevertheless, the aforementioned factors fail to fully account for the adverse developments seen over the past six months. Convergence was also interrupted in terms of the indices excluding all major en- ergy and food price effects, although the slight divergence seen between the original harmonised price indices becomes less clear now. The relationship between indices which exclusively remove the effect of energy prices followed a similar trend to that of the original harmonised price indices. Both the index calcu- lated excluding all food, alcohol and tobacco, and the index only excluding unprocessed foodstuffs reflect stronger convergence as well as a later date for its interruption. The inflation differential relating to industrial goods directly disciplined by the exchange rate path remained at the level seen in the previous quarter. Con- sequently, it cannot be said for certain whether the price indices, i.e. the trend in inflation, have entered a divergent phase.
Incidentally, other Central and East European countries in a similar situation to Hungary have also been unsuccessful in mak- ing inflation rates converge(Chart I-3).
2 Imported inflation
I
n 2000 Q3, commodity prices excluding energy and energy prices changed in a different direction to that seen in the previ- ous quarter (see Table I-1). Commodity prices in dollar terms were 4% down on the previous quarter (the second quarter regis- tered a drop of 2%). The decrease was due to a 5% to 8% decline in food, beverages and agricultural raw material prices and a0 2 4 6 8 10 12 14 16 18
J M M J S N J M M J S N J M M J S
0 2 4 6 8 10 12 14 16 18 Difference
Three-month moving average
Per cent Per cent
1998 1999 2000
Chart I-1 Inflation convergence: difference between the harmonised price indices of Hungary and the euro area
Source:Eurostat
0 2 4 6 8 10 12 14 16 18
J M M J S N J M M J S N J M M J S
0 2 4 6 8 10 12 14 16 18 Without energy
Without energy and unprocessed food Non-energy industrial goods Full HICP
Without energy, food, alcohol and tobacco
1998 1999 2000
Chart I-2 Inflation convergence relative to the euro area – alternative indicators
*Source: Eurostat, NBH calculation.
-2 0 2 4 6 8 10 12 14 16 18
J M M J S N J M M J S N J M M J S
-2 0 2 4 6 8 10 12 14 16 Czech Republic Hungary 18
Poland Slovenia
Slovakia
Per cent Per cent
1998 1999 2000
Chart I-3 Inflation differentials based on 12-month indices
Source: Eurostat
Table I-1World market price levels in 1999–2000*
Percentage changes relative to the average for 1995
Per cent
1999 2000
Q2 Q3 Q4 Q1 Q2 Q3
Commodities excluding
energy 74.5 75.2 78.1 79.4 77.9 74.8
Food 73.3 71.6 72.3 74.4 74.0 70.6
Beverages 73.4 65.3 74.9 68.1 63.2 58.7
Agricultural
raw materials 76.1 77.5 80.8 80.8 81.2 74.8
Metals 72.3 78.7 82.0 87.2 82.5 85.5
Crude oil 89.9 119.2 141.0 157.0 155.6 177.9 Source: IMF IFS
*World market prices in dollars.
3.6% rise in metal prices. At the same time, after a stable sec- ond-quarter, energy and oil prices rose by over 14% during the third quarter, despite the OPEC’s repeated quota increase in July.
This can be attributed to exceptionally low stock levels in the United States, the largest user. In addition to the impact of changes in world prices, Hungary was also affected by the 3.1%
average depreciation of the euro against the dollar which took place during the third quarter.
In 2000 Q3, theimport unit value indexrose from 13.9% in the previous quarter to 15.0%. This exceeded the pre-announced de- valuation rate of the forint’s exchange rate by 10.5% and the de- preciation in the nominal effective exchange rate index by 9.2%.
The 11% year-on-year growth in the indicator calculated with ef- fective foreign prices1was also above the index for the previous quarter(see Chart I-4). These data suggest that imported infla- tionary pressure did not moderate during the third quarter, primarily as a result of the feed-through of the inflation trends experienced by our main trading partners. Another factor is the effect of last year’s low base-period values, in view of the fact that short-term developments reflect a slightly different picture.
Quarter-on-quarter price inflation derived from the seasonally adjusted import unit value index (see Chart I-5) implies that imported inflationary pressure, although still a factor in the Hungarian economy, has moderated somewhat. Imported inflation seems to have peaked during the second quarter of 2000.
Prices for imports from developed countries continued to in- crease in the third quarter, also spreading tomachineryprices, which had previously been growing at a more moderate rate. In the third quarter prices in this product group rose by 8.9% in a year-on-year comparison. This was most likely due to the fact that rising energy prices and costs were beginning to feed through to foreign producer prices at that time. It also seems probable that this year’s growth in demand exerted upward pres- sure on prices. Just as in the previous quarter, import prices from Central and East Europe continued to rise, up by 41.5%, due pri- marily to higher energy prices.In respect of price growth, energy import prices continued to top the list in the third quarter, up by 83.9% on a year earlier. Food, beverage and tobacco import price increases also gathered pace (10.4%). As in the second quarter, machinery price rises (9.2%) exerted further imported inflation- ary pressure. Imported inflation relating to processed goods and commodities remained at the previous high, 12.2% and 20.1%, rates, respectively. Clearly, the continuing third-quarter strength- ening of imported inflationary pressure was equally due to im- ported energy and machinery inflation. The latter is likely to have been caused by positive demand shocks and rising costs.
This year, CPI inflation in the euro area was constantly in ex- cess of the European Central Bank’s 2% medium-term target(see Table I-2).The twelve-month rate hit a six-year peak of 2.8% in September, compared with 2.1% in March and 2.4% in June. Price inflation was primarily triggered by high energy prices and the weakening euro, while CPI inflation excluding energy prices was
0 2 4 6 8 10 12 14 16 18 20
Q1 Q2 Q3 Q4 Q1 Q2 Q3 Q4 Q1 Q2 Q3 Q4 Q1 Q2 Q3 0 2 4 6 8 10 12 14 16 18 20
Import unit-value index Currency basket Nominale-effective Effective foreign prices in HUF
Import unit-value index relative to developed countries
1997 1998 1999 2000
Per cent Per cent
Chart I-4Changes in import prices and various exchange rate indices
1The imported inflation indicator calculated with effective foreign prices is constructed by multiplying the weighted average of the producer price indi- ces of Hungary’s main trading partners by the nominal effective exchange rate index.
0 1 2 3 4 5
Q1 Q2 Q3 Q4 Q1 Q2 Q3 Q4 Q1 Q2 Q3 Q4 Q1 Q2 Q3 0 1 2 3 4 5 Seasonally adjusted
Trend
Per cent Per cent
1997 1998 1999 2000
Chart I-5Quarter-on-quarter changes in the import unit value index
up by 1.6%. The highest rate of inflation was measured in Ireland at over 6%, while the lowest rates were seen in Austria and France, at 2.2% and 2.3%, respectively.
Twelve-month CPI inflation in the European Union countries stood at 2.5% in September. In the United States, the peak of 3.7%
for CPI measured in March and June (the highest rate measured in recent years) fell to 3.5% in September, while core inflation re- mained at the end-of-July rate of 2.6%. So far the inflationary pressure from high energy prices has been broadly offset by rapid productivity growth from IT advances. The slowdown in economic growth seen in the third quarter also exerts downward pressure on inflation.
In September the twelve-month rate of inflation in the Czech Republic held steady at the 4.1% rate measured in June. Accord- ing to the different forecasts, despite stronger economic activity and steady energy and food price increases, CPI inflation in De- cember will be 4.4% at most. This year’s CPI inflation in Poland remained virtually flat, at slightly above 10%, with a 10.3% rate in September.
The inflation outlook for 2000 depends on the extent to which the upward pressure exerted by food and fuel prices feeds through to wage and services prices.
3 Components of changes in consumer prices
Industrial goods
C
hanges in the prices of internationally traded industrial goods play a prominent role from the aspect of monetary policy. (We have modified the methodology used in previousRe- portsin respect of the classification of industrial goods and mar- ket services, see Box for more details). Due to international com- petition, prices in this category are basically determined by the prices of (potential) imports calculated in forints. Both foreign and domestic prices in this category are fairly stable. Conse- quently, changes in industrial goods prices convey high-quality information on the transmission mechanism of monetary policy and the exchange rate path(see Table I-3).Industrial goodsprices, accounting for 26.7% of the consumer basket,(see Chart I-6)increased at a favourable rate of 4.7% in the year to October. Within this group, the twelve-month price index of non-durables, accounting for 19.5% of the basket, rose from 5.3% in July to 6% in October.
On the other hand, the price level of durable consumer goods, with a basket-weight of 7.1%, remained basically stable, with the twelve-month price index hardly in excess of 1%. During the au- tumn, prices of the cultural items component continued the downward trend which started in April.
The average rate of industrial goods price inflation was only exceeded by that of building materials, included with the item ofowner occupied housing,due partly to increased energy costs.
The Bank last reduced the devaluation rate of the forint in April (from a monthly 0.4% to 0.3%), which was followed by an announcement at the end of the summer that there would be no
Table I-3Inflation rate of different goods and services*
Relative to same month a year earlier
Per cent Weight
in CPI Dec.
1999 2000
March June July Aug. Sep. Dec.
Consumer Price
Index (CPI) 100.0 11.2 9.6 9.1 9.6 9.6 10.3 10.4 Of which:
Industrial products, excluding food, alcohol, tobacco
and petrol** 26.7 6.5 5.2 4.3 4.3 4.7 4.7 4.7 Petrol 4.9 37.8 36.7 33.4 27.9 24.2 25.9 26.7 Non-regulated
household
energy prices 1.3 16.5 12.7 17.6 21.5 22.7 24.4 29.2
Food 19.1 5.4 5.6 6.4 11.8 14.4 15.3 14.1
Regulated
prices 18.0 17.6 10.9 9.4 7.2 5.0 6.5 6.9
Of which: energy 7.3 6.2 5.1 5.5 4.8 6.3 7.9 8.8
Services 9.0 18.7 8.8 5.6 5.5 5.5 7.2 7.2
Market services 20.6 10.8 10.2 10.3 10.5 10.7 11.4 11.9 Alcohol and
tobacco 9.4 10.6 11.7 10.5 9.9 10.5 10.7 11.2 Core inflation 89.9 8.8 7.5 7.0 7.4 8.5 9.4 9.6 Depreciation of
the nominal effec-
tive exchange rate 2.7 4.1 6.2 6.0 5.7 5.6 5.4 Pre-announced
nominal devalua-
tion of the forint 6.7 6.0 5.1 4.8 4.6 4.4 4.3
* The classification of items included in the consumer basket is different from that applied by the Central Statistical Office. See the Bank’sQuarterly Inflation Reportsfor more details.
** We have modified the methodology used in previousReportsin respect of the classifica- tion of industrial goods and market services (see Box for more details).
Table I-2International inflation data, 1999–2000 Percentage changes on a year earlier
Per cent
March 2000 June 2000 September 2000
Producer Consumer Producer Consumer Producer Consumer price changes
United States 4.5 3.7 4.8 3.7 3.3 3.5
Japan n/a –0.6 n/a –0.7 n/a n/a
Germany 2.1 2.1 2.9 1.9 4.3 2.6
Czech Republic 5.1 3.8 5.0 4.1 5.4 4.1
Poland 7.3 10.3 8.7 10.2 8.3 10.3
Hungary 9.9 9.6 12.0 9.1 12.8 10.3
EU-11 6.2 2.1 5.6 2.4 n/a 2.8
EU-15 n/a 1.9 n/a 2.1 n/a 2.5
Source:Global Data Watch, J.P. Morgan’s figures for 2000.
0 2 4 6 8 10 12 14 16
J M M J S N J M M J S N J M M J S
0 2 4 6 8 10 12 14 Durable traded goods (1) 16
Non-durable traded goods (2) Traded goods (1+2)
Per cent Per cent
1998 1999 2000
Chart I-6 Industrial goods prices
further cut for the remainder of the year. Thus, the halt in tradables inflation is not in contradiction with the exchange rate path, which is reflected in the fact thatrelative twelve-month in- flationof industrial goods, as compared to the rate of devalua- tion, although slightly rising, continued to remain within the± 1 % range2(see Chart I-7).This implies that the pre-announced ex- change rate path is continuing to act as a nominal anchor.
Energy price shock
The Hungarian economy has recently been hit by two significant inflationary shocks. First, energy (oil and natural gas) prices have been rising sharply at a nearly uninterrupted pace for one and a half years; and second, there was an upsurge in food prices at the end of the summer.
The monthly average price of a barrel of Brent in euro terms increased over 4.5-fold from the December 1998 low. The price of natural gas imported by Hungary is linked to the world price for oil, following it with a nine-month lag in a smoothed way, as a result of a contract, which is quite unfavourable under the pres- ent circumstances.
The latter factor deserves special attention, as the Hungarian use of natural gas outstrips oil consumption (in terms of heating value equivalence). In other countries rises in the price of im- ported natural gas do not follow – at least in the short run – oil price inflation. This means that Hungary was hit by an especially high-amplitude energy price shock, even in international com- parison.
As, however, world oil prices have been going up for one and a half years now, and the incorporation of gas price increases into inflation was in fact prevented by the government with ad- ministrative measures, the shock probably did not directly speed up third-quarter inflation, relative to previously. Thus, the mid-year adverse reversal in disinflation cannot be attributed to a directimpact of energy price explosion.
It can be seen fromChart I-8that the oil price shock had the strongest impact on the Hungarian economy in 1999 Q4. The 63.5% rate of year-on-year price inflation seen in 2000 Q3 was no
‘novelty’ as for the past six quarters energy import prices have been rising at a year-on-year rate of above 60%.
The last one and a half years have seen a steady year-on-year rise of 30% and 50% in motor fuel and bottled gas prices, account- ing for 5% and 0.5% of the consumer basket, respectively. Mar- ket-determined energy and motor fuel prices rose at an annual rate of 25.7% over the past one and a half years (in October 2000, the combined twelve-month price index stood at 27.2%). Due to the 6.3% weight of this category in the consumer basket, the twelve-month rate of inflation rose by 1.6–1.7% over the last one and a half years on account of this product category alone, as a directimpact of the oil price shock. This impact can be regarded as temporary because if oil prices and the associated gas prices
-8 -6 -4 -2 0 2 4 6
J M M J S N J M M J S N J M M J S
-8 -6 -4 -2 0 2 4 Relative to nominal effective exchange rate 6
Relative to currency basket
Per cent Per cent
1998 1999 2000
Chart I-7Twelve-month relative inflation rate of industrial goods
-100 -50 0 50 100 150 200
Per cent Per cent
Q1 Q2 Q3 Q4 Q1 Q2 Q3 Q4 Q1 Q2 Q3 Q4 Q1 Q2 Q3 Q4 Q1 Q2 Q3 0.0 0.5 1.0 1.5 2.0 2.5 3.0 3.5 Annualised q/q change
(left-hand scale) Level (right-hand scale)
1996 1997 1998 1999 2000
Chart I-8Changes in energy import prices in forint terms
2The change in the methodology reduced the figure for relative inflation by 0.5–0.7%. Under the former methodology, industrial goods’ relative inflation would have slightly exceeded 1%.
even just stabilize at the current level, this will reduce the rate of inflation by the same percentage.
As far as thedirectinflationary effect of energy prices is con- cerned(see Chart I-9),there is a conspicuously widening gap be- tween centrally controlled and market-set energy price indices within the household energy category (up by 8.8% and 29.2%, re- spectively, in a year-on-year comparison). Market-priced en- ergy, with a weight of 1.3%, has followed the world market trend.
Prices of solid fuels (such as coal, briquette and firewood) rose by 13–18% over the twelve months. Oil and gas import prices also went up sharply in the third quarter.
This almost immediately fed through to the price for bottled gas, pushing its price up one-and-a-half times during the course of one year.
The control mechanism ofcentrally regulated energy prices, accounting for 7.2% of the basket, resulted in a 12% rise in the price for natural gas (and a linked 5% increase in district heating) as of July 1st. This proved to be far insufficient to offset the rise in import costs. In an effort to relieve tensions on the gas market, the government raised gas prices for large users by 43% as of No- vember. This measure does not directly affect household costs (even district heating prices remaining unchanged), but it is likely to exert indirect inflationary pressure, with November and December being the earliest time when the feed-through would be reflected in the price indices. Higher energy costs may be passed on to product prices, and the extra costs incurred by electricity production, the chief user of energy input, would ac- count for a relatively large rise in electricity prices in January. In October, the 8.8% twelve-month rise in centrally controlled household energy prices was below the rise in the general price level.
Thus, thedirectimpact of imported energy price rises on do- mestic consumer prices was considerably dampened by eco- nomic policy to the extent that only a small portion of the in- crease in input costs was allowed to be passed on to household prices by the central setters of pipeline gas and public transport prices. (Freezing the excise duty content of motor fuel prices is intended to serve a similar anti-inflationary objective in the fu- ture.) This kind of ‘stifling’ of a rise in the price level together with the oil price explosion, which is expected to boost costs indi- rectly and after a long lag, may become important inflationary factors.
Food price shock
The unexpected jump in July in the prices ofunprocessed food- stuffs(accounting for 5.4% of the basket) supplied the other cru- cial inflationary shock for the economy(see Chart I-10).The sea- sonally adjusted index rose by 14.4% in the course of one month.3 This shock fed through to processed foodstuffs (with a 13.8%
weight) after a lag and significantly dampened. The seasonally adjusted price level of this sub-category rose by 1.25%, 2.81% and
-20 -15 -10 -5 0 5 10 15 20 25 30
J F M A M J J A S O N D J F M A M J J A S O -20 -15 -10 -5 0 5 10 15 20 25 30 All food
Unprocessed foodstuffs Processed foodstuffs
Per cent Per cent
1999 2000
Chart I-10 Food price changes
3In July 2000, unprocessed foodstuff prices rose by 11.3% on average, al- though thanks to seasonal effects prices for unprocessed foodstuffs normally fall during this month. There were exceptional rises in pork and eggs prices.
0 5 10 15 20 25 30 35 40
J F M A M J J A S O N D J F M A M J J A S O 0 5 10 15 20 25 30 35 40 Petrol
Energy / market-determined Energy / regulated
Energy / market-determined + petrol Per cent
1999 2000
Per cent Chart I-9 Changes in energy prices
3.20%, on a monthly basis, in July, August and September, re- spectively. As a consequence, the 12-month index for food reached the 12–15% range in the third quarter, compared with 6–7% a year earlier, and the year-on-year index in October de- clined only to 14.1%. Thus, rather than remaining below the over- all rate of CPI inflation, food prices have risen at a significantly higher rate than previously.
As isshown in Chart I-10,the rise in food prices occurring late in the summer did not only cause a one-off shift in the price level in line with expectations, but was partially corrected as early as by August in respect of unprocessed foodstuffs. Thus, the shock is not expected to exert lasting upward pressure on inflation. The jump in the price of unprocessed foodstuffs in July, due primarily to the marked expansion of the export taking capacity of East Eu- ropean markets was built into processed food prices after a lag of one or two months. However, even in respect of the latter cate- gory, the seasonally adjusted monthly price index shows signs of a correction.
Food, especially unprocessed foodstuffs, constitutes one of the least stable categories of the consumer price index. Its con- siderable short-term volatility and unstable seasonality obstruct statistical analysis and render related forecasting rather unreli- able. It is vital, therefore, that in the assessment of inflation trends the ‘distorting’ effect of food prices on overall consumer price in- dices should be taken into account to the greatest possible ex- tent.
Market services
It is a lingering cause for concern that the price index of market services is exceeding the tradables price inflation to an ever in- creasing degree(see Chart I-11).In contrast to industrial goods prices, which are controlled by the exchange rate path, under the current system, monetary policy can only influence inflation in market services prices to a limited degree. The cornerstone of ex- change-rate-based disinflation lies in the capability of the econ- omy’s complex equilibrium mechanisms to influence non- tradable prices, structurally ‘protected’ from international com- petition, ensuring that they change consistently with import prices over the long term.
Prices of market services rose nearly 7.2% faster than the ag- gregate price for industrial goods in the year to October, though the quarter-on-quarter (seasonally adjusted index) suggests that the opening of the ‘price gap’ came to a halt during the third quar- ter. According to calculations by National Bank analysts, the varying rate of productivity growth across the various sectors ac- counts for a 4–6% inflation differential over the long term, given the current stage of economic convergence. This implies that the 7% change in the price ratio, characteristic of the first ten months, is hardly sustainable.
The problem is rooted in the fact that the twelve-month price index ofmarket services,with a weight of 20.2%, has been on a steady rise since the third quarter, remaining just below 12% in October.
In the following section the notions of food price shock and wage inflation inertia are to be investigated by dividingmarket servicesinto three groups. These are 1) thefood-price-sensitive
1 6 11 16 21 26
J M M J S N J M M J S N J M M J S N J M M J S 0 1 2 3 4 5 6 7 Processed food (1) 8
Market services/industrial goods (3/2) Industrial goods (2)
Market services (3)
Overall index excluding energy and unprocessed food
1998
1997 1999 2000
Per cent Per cent
Chart I-11Inflation in respect of major aggregates