QUARTERLY REPORT
ON INFLATION
November
2002
Prepared by the Economics Department of the Magyar Nemzeti Bank István Hamecz, Managing Director Published by the Magyar Nemzeti Bank Krisztina Antalffy, Director of Communications
1850. Budapest, Szabadság tér 8-9.
www.mnb.hu ISSN 1419.2926
The new Act on the Magyar Nemzeti Bank, enacted by Parliament and effective as of 13 July 2001, defines the primary objective of the Bank as the achievement and maintenance of price stability. Using an infla- tion targeting system, the Bank seeks to attain price stability by imple- menting a gradual, but firm disinflation programme over the course of several years.
In order to provide the public with a clear insight into the operation of central bank policies and enhance transparency, the Bank publishes the “Quarterly Report on Inflation”, covering recent and prospective developments in inflation and evaluating the macroeconomic devel- opments determining inflation. This publication summarises the pro- jections and deliberations that underlie the decisions of the Monetary Council.
The Monetary Council, the supreme decision making body of the Magyar Nemzeti Bank , will carry out a comprehensive review of the expected development of inflation once every three months, in order to establish the monetary conditions that are consistent with achieving the infla- tion target. The first section of the publication (released on 5th of No- vember) is the Statement of the Monetary Council, containing its cur- rent assessment of economic perspectives and the grounds for its deci- sions. This is followed by an analysis prepared by the Economics De- partment on the outlook for inflation and the underlying principal macroeconomic developments. The expected path and uncertainty of the exogenous factors used in the projection reflect the opinion of the Monetary Council.
✧ ✧ ✧
STATEMENT BY THE MONETARY COUNCIL ... 5
SUMMARY TABBLE OF PROJECTIONS ... 7
I. INFLATION ... 8
I. 1 The previous inflation projection versus the actual data ... 8
I. 1. 1 Assessment of third-quarter data ... 8
I. 1. 2 The previous inflation projection versus the actual rate ... 9
I. 1. 3 Evaluation of assumptions underlying the August projections ... 9
I. 1. 4 Reasons for the difference between the projection and actual data ... 10
I. 2 Projecting the consumer price index ... 11
I. 2. 1 Assumptions of the central projection ... 11
I. 2. 2 Details of the central projection ... 12
I. 2. 3 Uncertainty surrounding the projection and some alternative paths ... 14
II. DEMAND AND OUTPUT ... 15
II. 1 Demand ... 15
II. 1. 1 External demand ... 16
II. 1. 2 Fiscal stance ... 16
II. 1. 3 Household consumption, savings and fixed investment ... 18
II. 1. 4 Corporate investment ... 20
II. 1. 5 Inventory investment ... 20
II. 1. 6 External trade ... 21
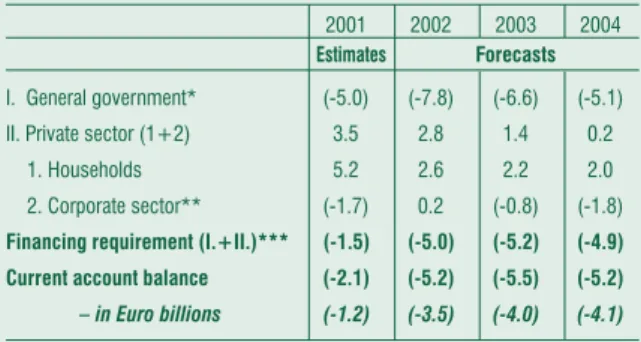
II. 1. 7 External balance ... 22
II. 2 Output ... 23
III. LABOUR MARKET AND COMPETITIVENESS ... 25
III. 1 Use of labour ... 26
III. 2 Labour market reserves and tightness ... 27
III. 3 Wage inflation ... 27
III. 4 Productivity and unit labour costs ... 29
III. 5 Competitiveness ... 29
IV. MONETARY DEVELOPMENTS ... 32
IV. 1 International economic environment and risk perception ... 32
IV. 2 Interest rate and exchange rate developments ... 34
IV. 3 Capital flows ... 36
IV. 4 Long-term yields and inflation expectations ... 37
V. SPECIAL TOPICS ... 40
V. 1 What do business wage expectations show? ... 40
V. 2 Should we expect a revision to 2002 GDP data? ... 41
BOXES AND SPECIAL ISSUES IN THE QUARTERLY REPORT OF INFLATION ... 46
CONTENTS
Inflation projection fan chart*
Percentage changes on a year earlier
* The fan chart shows the probability distribution of the outcomes around the central projection. The central band with the darkest shading includes the central projection.
The entire coloured area covers 90% of all probabilities.
Outside the central projection (centred around the mode), the bands represent 15% probability each. The uncertainty intervals have been estimated relying on the Bank’s his- toric forecast errors and the uncertainties perceived by the Monetary Council regarding the current forecast. The year-end points represent the fixed inflation targets (7%, 4.5%, 3.5% and 3.5%, respectively for December 2001- 2004); while the straight lines mark the ±1% tolerance intervals on either side of the target rates.
Inflation has continued to moderate in recent months, prices rising by 4.6%
in September year on year. In the Monetary Council’s evaluation, however, there have been significant upside risks to inflation.
The rapid expansion of domestic demand is the most important among the factors exposing the economy to inflationary risks. Whereas the inter- national business climate remains unfavourable, domestic demand has been rising above its long-term sustainable rate, mainly due to the increase in household expenditure. Although some sectors of the economy are faced with selling problems on account of weak external demand, there appear to be signs of excess demand in areas crucial for the disinflation process, primarily in sectors selling their output to the domestic market. This adds to inflationary pressures and leads to a rapid rise in Hungary’s current ac- count deficit, which may exceed 5% of GDP in 2002, despite continued weak corporate sector fixed investment demand.
The most powerful driving force of the fast increase in domestic demand has been the massive expansion of household income. Despite the tight- ening of monetary conditions in the past 18 months the rate of private sector nominal wage growth has been slowing only modestly, jeopardising international competitiveness. Over the past year, real appreciation has been induced by faster increase in real wages than in productivity, simultaneously with a nearly flat nomi-
nal exchange rate. Pub- lic sector wages have been rising by 30% an- nually. The Govern- ment’s measures aimed at reducing the tax bur- den have also contrib- uted to the increase in net earnings.
The rate of wage growth is likely to slow in 2003. The draft for next year’s Budget does not contain a sig- nificant increase in public sector employ- ees’ wages. Neverthe- less, annual average nominal wage growth is expected to be around 17% as a conse- quence of the full-year effects and earlier com- mitments, such as the
Statement by the Monetary Council
Considerable upside risks to inflation...
...due to the unsustainable increase in domestic demand over the long term
Rapid real wage growth encour- ages expansion of demand 11 November 2002
At its meeting of 11 November 2002, the Monetary Council discussed the Economics Department’s forecasts of eco- nomic developments and approved the November 2002 issue of the Quarterly Report on Inflation for publication.
The current rate of private sector wage growth is unsustainable
0 1 2 3 45 6 7 89 10 11
Percent
01:Q1 01:Q2 01:Q3 01:Q4 02:Q1 02:Q2 02:Q3 02:Q4 03:Q1 03:Q2 03:Q3 03:Q4 04:Q1 04:Q2 04:Q3 04:Q4
Statement of the Monetary Council
Rapidly rising household debt exerts upward pressure on domestic de- mand
No rapid recovery in investment ex- pected
Fiscal policy is to contract domestic demand growth
Wage increases are the greatest risk to inflation
Investor sentiment depends on the prospective date of joining the euro
Monetary conditions should remain tight
adjustment of public servants’ salaries. In the Monetary Council’s view, a much lower wage growth than this is required, in order to be able to achieve the inflation targets without substantial real economic sacrifices. There- fore, the Council supports the Government’s and employers’ joint recom- mendation of a 3%–4.5% gross nominal wage increase in 2003.
Another key component in the expansion of domestic demand is the decline in households’ net financial savings. A better outlook for income, decreasing nominal interest rates and the wide availability of government subsidised credit have led to a rapid rise in the stock of lending to house- holds. The rise in household debt is a natural trend, which is taking the structure of Hungarian household wealth closer to that in Europe. How- ever, the increased access to subsidised credit and the fast income growth have caused the process to accelerate, which is another source of inflation- ary pressure.
Other components of domestic demand are expected to continue to grow at a subdued pace. In terms of the draft Budget, government will moderate its investment spending. Due to sluggish activity in Europe and the utilisation of manufacturing capacities, activity in the corporate sector is forecast to increase only slowly.
The increase in the risks to inflation has been partly due to the expan- sionary fiscal policy in 2002. Most of the growth in demand could be attrib- uted to higher wage and transfer payments and a drop in the debt burden, which continue to determine a great proportion of fiscal expenses and receipts in the course of 2003. In terms of the draft Budget, the govern- ment seeks to reduce the budget deficit in 2003 to the level defined by the Medium-term Economic Policy Programme. Available information suggests that the planned measures will likely curb aggregate demand by 1.2% of GDP.
Thus, fiscal policy seeks to facilitate meeting the inflation target via damp- ening domestic demand growth. However, over the short term, the deficit will only be lowered in respect of expenditure items that have less signifi- cant bearing on inflation, while items with a direct impact on household income will continue to increase. The MNB’s inflation forecast, based on the assumptions of moderate wage growth, fiscal tightening and that last month’s average exchange rate and oil price remain unchanged, is around the still acceptable rate of 4.5% in December 2003 (at 4.6%), and falls within the upper section of the target range in 2004 (4.2%). In 2003, the overall risks to inflation are weighted to the upside, due primarily to uncertainty around the path for wage growth.
Recent uncertainty about the date of Hungary’s joining the euro has sig- nificantly influenced changes in both the exchange rate and the yield curve.
Progress made with the negotiations in preparation of Hungary’s Euro- pean Union entry, and the favourable outcome of the Irish referendum on the Treaty of Nice, have increased the probability of an early entry. Im- provement in investor sentiment has also been reflected in the strengthen- ing of the exchange rate.
The risks to inflation are high. Although the recent tightening of mon- etary conditions will reduce the probability of inflation exceeding the tar- get, the Monetary Council currently sees no room for easing monetary con- ditions.
Magyar Nemzeti Bank Monetary Council
Summary Table of Projections
Percentage changes on a year earlier unless otherwise indicated
2002 2003 2004
CPI
December 5.3 4.6 4.2
Annual average 5.4 5.2 4.3
Economic growth
External demand (-2.3) - (-1.9) - (-1.6) 3.0 - 4.7 - 5.9 4.0 - 6.2 - 8.4
Manufacturing value added (-1.5) - (-0.5) - 0.3 3.0 - 4.7 - 6.0 5.0 - 7.0 - 9.0
Household consumption1 9.1 - 9.4 - 9.7 6.1 - 7.3 - 8.5 2.9 - 3.9 - 5.0
Gross fixed capital formation 5.5 - 6.5 - 7.5 2.5- 4.3 - 6.1 2.0 - 4.2 - 6.4
Domestic absorption 5.2 - 5.6 - 6.0 3.8- 4.9 - 6.0 2.6- 3.7 - 4.8
Exports 4.0 - 4.8 - 5.6 4.0 - 5.7 - 7.0 7.0 - 9.7 - 13.0
Imports 7.8 - 8.4 - 9.0 5.0 - 7.1 - 9.0 6.5 - 8.7 - 11.5
GDP 3.0 - 3.2 - 3.4 3.5- 3.9 - 4.3 3.7 - 4.2 - 4.7
Current account deficit6
As a percentage of GDP 4.8 - 5.2 - 5.7 5.0 - 5.5 - 6.0 4.3 - 5.2 - 6.0
EUR billions 3.2 - 3.5 - 3.8 3.6 - 4.0 - 4.4 3.4 - 4.1 - 4.8
General government Demand impact
(as a percentage of GDP) 3.3 - 3.4 - 3.5 (-0.8) - (-1.2) - (-1.4) -1.42
Labour market (private sector) 3
Wage inflation 13.0 - 13.4 - 13.8 6.04 6.04
Employment (-0.4) - (-0.2) - 0.0 (-0.2) - 0.3 - 0.8 0.4 - 1.2 - 2.0
Real exchange rate5 11.1 - 11.7 - 12.3 (-0.7) - (-0.2) - 0.3 (-3.0) - (-2.2) -.(-1.4)
1 Household consumption expenditure
2 Assumption, see Chapter II.1
3 Average of manufacturing and market services unless otherwise indicated
4 Assumption, see Chapter III.
5 On ULC basis, manufacturing, an increase is an appreciation
6 Based on the 2002 methodology Summary Table of Forecasts
Chart 1-1 CPI and core inflation Percentage changes on a year earlier
1 The 4.9 percent October data has been published after finalising our Report. Ac- cording to our preliminary assessment, new pieces of information were in line with the developments described above.
2 The September fall in nondurables and, consequently, tradables inflation is due to a large price fall in a single CPI item (holiday abroad), which can be considered as noise.
I. Inflation
I. 1 The previous inflation projection versus the actual data
I
n 2002 Q3 the Consumer Price Index stood at 4.6%.Disinflation in consumer prices continued in the third quar- ter, with the index down by 0.9 percentage points on the rate for Q2. In contrast, core inflation declined only moderately in a quarter-on-quarter comparison, and the index remained flat at 5.6% during the quarter. It should be stressed, however, that just as the CPI, the core inflation index also declined signifi- cantly over the previous few quarters.1
I. 1. 1 Assessment of third-quarter data
The decline in the CPI seen in the third quarter was primarily due to one-off exogenous shocks, while inflation of groups that are most relevant from the point of view of monetary policy (such as tradable goods and market services) can be said to have remained flat.
Although the annual tradables price index was lower than in Q2, month-on-month developments suggest that the defla- tion process, which gained momentum in the wake of the monetary regime change last May, was interrupted in the last quarter. Third-quarter data reflect a reversal in disinflation in durable goods prices, and monthly growth rates are evidence of acceleration for the third consecutive month in September.
In contrast, inflation in nondurable goods prices remained flat during the quarter and fell off in September.2
Inflation in nontradable goods prices, most sensitive to the inflationary effects of domestic demand and inflation inertia, showed stagnation and slight acceleration during Q3. It is impor- tant to note, however, that the sharp acceleration of price increases in September is mainly attributable to a one-off price hike in the CPI item „Newspapers, periodicals”. Apart from this effect, nontradable inflation showed stagnation in September as well.
Inflation in processed food prices moderated in Q3, although the rapid rise in domestic demand and wages also had an im- pact on this group, just as on tradables and market services. The decline in the prices of this group was probably due to the ripple effect of the summer deflation in unprocessed food prices.
4 5 6 7 8 9 10 11 12
Jan-00 Mar-00 May-00 July-00 Sept-00 Nov-00 Jan-01 Mar-01 May-01 July-01 Sept-01 Nov-01 Jan-02 Mar-02 May-02 July-02 Sept-02
Percent
4 5 6 7 8 9 10 11 12
Percent
Core inflation CPI
Chart I-2 Inflation in tradable goods prices Seasonally adjusted, annualised month-on-month growth rates
-6.0 -4.0 -2.0 0.0 2.0 4.0 6.0 8.0
Percent
-6.0 -4.0 -2.0 0.0 2.0 4.0 6.0 8.0
Percent
Durables Nondurables Tradebles
Jan.02 Mar.02 May.02 July.02 Sept.02
Jan.01 Mar.01 May.01 July.01 Sept.01 Nov.01
Chart I-3 Inflation of market services prices Seasonally adjusted, annualised month-on-month growth rates
0.0 2.0 4.0 6.0 8.0 10.0 12.0 14.0 16.0
Percent
0.0 2.0 4.0 6.0 8.0 10.0 12.0 14.0 16.0
Percent Jan.01 Mar.01 May.01 July.01 Sept.01 Nov.01 Jan.02 Mar.02 May.02 July.02 Sept.02
Nontradables excl. „Newspapers, periodicals”
Nontradables
I. Inflation
Chart I-4 Food price inflation
Seasonally adjusted, annualised month-on-month growth rates
Chart I-5 Producer price of pork * (HUF)
Inflation of unprocessed food prices considerably slowed down, due to the negative price shock seen between May and August. The negative price shock lasted as long as September, when prices resumed rising. This trend can be best traced in changes in the consumer price of pork, the most significant fac- tor in the inflation of this product group. Deflation of pork prices ended in August, and September witnessed an over 6 percent rise in a month-on-month comparison. In September, the domes- tic producer price for pork exceeded the price level for Europe.
The drop in unprocessed food prices experienced in the period from May to August was not unique in an international comparison. In the wake of the inflationary shock early in the year, unprocessed food prices also was a lasting fall within the euro area, before turning up again in the middle of the sum- mer. The latest international statistics also suggest that unproc- essed food price inflation has been gathering pace.
In addition to deflation in unprocessed food prices, the other one-off factor, exogenous to monetary policy, which contrib- uted to the third-quarter decline in inflation was a drop in regu- lated prices, due to the cancelling of a charge payable by house- holds that owned television sets. This measure is estimated to push down this year’s CPI inflation rate by 0.3 percentage points.
The exogenous factors exerting upward pressure on infla- tion included a rise in the price of petrol, due primarily to the rise in the world oil price and the weakening of the euro, as well as the increase in tobacco price inflation, due to the Au- gust rise in the excise duty on tobacco.
I. 1. 2 The previous inflation projection versus the actual rate
In 2002 Q3, both actual CPI inflation and core inflation were 0.1 percentage point lower than projected in the August Report. The table of the projections versus the actual data shows, however, that the prices of the product groups most relevant from the point of view of monetary policy rose faster than projected.
Five product groups showed major differences between ac- tual and projected rates. Most of the deviation could be attrib- uted to the lower-than-expected inflation of unprocessed food prices. In addition, alcohol, tobacco and regulated prices also increased less sharply than expected, while the actual rate of inflation was higher in respect of tradable goods and market services.
The differences between the actual and projected rates can be explained partly by the assumptions underlying the projec- tions and partly by the shortcomings of the projection model.
The following section will take a closer look at the reasons for the discrepancies.
I. 1. 3 Evaluation of assumptions underlying the August projections
The forint/euro exchange rate and imported inflation in tradables prices, two key exogenous variables, exerted down- ward pressure on inflation during 2002 Q3. By contrast, the dollar/euro exchange rate and world oil prices exerted infla- tionary pressures.
As variations in the dollar/euro exchange rate and the world oil price does not take long to feed through into fuel prices,
* Quality “E”, HUF/kg, AKII data
-20.0 -15.0 -10.0 -5.0 0.0 5.0 10.0 15.0 20.0 25.0 30.0
Percent
-40.0 -20.0 0.0 20.0 40.0 60.0
Percent
Jan.01 Mar.01 May.01 July.01 Sept.01 Nov.01 Jan.02 Mar.02 May.02 July.02 Sept.02
Processed Unprocessed (right scale)
200 250 300 350 400 450 500 550 600
HUF/kg
200 250 300 350 400 450 500 550 600
HUF/kg
Hungary Germany EU
Jan.98 May.98 Sept.98 Jan.99 May.99 Sept.99 Jan.00 May.00 Sept.00 Jan.01 May.01 Sept.01 Jan.02 May.02 Sept.02
Chart I-6 Unprocessed food price inflation in Europe and Hungary
Seasonally adjusted, annualised month-on-month growth rates
Table I-1 Central inflation projection and actual data in 2002 Q3
Food 19.0 2.0 3.4 -1.3 -0.26
Unprocessed 6.2 -4.3 -0.7 -3.6 -0.22
Processed 12.8 5.1 5.3 -0.2 -0.03
Tradables 27.0 2.3 2.1 0.2 0.06
Market services 19.4 9.0 8.6 0.4 0.09
Market-priced energy 1.5 2.3 3.6 -1.3 -0.02
Vehicle fuels 5.2 1.8 1.0 0.8 0.04
Alcohol and tobacco 9.1 9.3 10.4 -1.1 -0.10
Regulated prices 18.9 3.8 4.2 -0.4 -0.07
CPI 100.0 4.6 4.7 -0.1 -0.14
Core inflation 68.2 5.6 5.7 -0.1 -
Actual data
August projection
Differ- ence Effect of
difference on CPI Percentage changes
on a year earlier, % Weight
Category (%)
-40 -40
-30 -30
-20 -20
-10 -10
0 0
10 10
20 20
30 30
40 40
50 50
Percent
Percent
Eurozone-12 Germany
Hungary
Jan.01 Mar.01 May.01 July.01 Sept.01 Nov.01 Jan.02 Mar.02 May.02 July.02 Sept.02
I. Inflation
Chart I-7 Inflation in the price of German and euro area tradable goods
Seasonally adjusted, annualised month-on-month growth
the difference between the actual and assumed values of these two factors may explain the higher-than-expected inflation in vehicle fuel prices. By contrast, the disinflationary impact caused by the strengthening of the forint/euro exchange rate and the decline in imported tradables inflation can only be expected to appear over the longer term.
Information on household expenditure and private sector wages in the third quarter is not yet available. Nevertheless, the data released so far indicate that neither of these will sig- nificantly divert from the Bank’s previous expectations.
I. 1. 4 Reasons for the difference between the projection and actual data
Changes in the exogenous variables examined above do not fully account for higher-than-anticipated actual inflation in the price of tradables and market services in the third quarter.
Considering the difference the followings can be supposed.
First, the projection of tradables prices is based on the as- sumption that imported inflation, a factor influencing the course of domestic prices, moves in correlation with the larg- est trading partner’s, Germany’s tradables prices. However, the drop in German prices seen in April-August was extremely sharp, and it did not seem to feed through into neither domes- tic nor euro area tradables prices. As German tradable price movements are seen to be more volatile and be exposed to individual shocks relative to euro area tradables inflation, the current projection is based on tradables prices in the euro area.
Second, the discrepancy between the projected and actual rates suggests that the previous projections for tradables and market services prices underestimated the inflationary pres- sure exerted by robust growth in domestic demand and wages.
The current projection pays greater attention to the inflation- ary pressure via these two channels.
That actual unprocessed food prices were lower than fore- cast could be attributed to the fact that, although the negative price shock dates back to as early as June, due to the strong volatility typical of this group deflation was not expected to be lasting. Accordingly, the August Report used a cautious as- sumption about the development of agricultural prices, which have the greatest influence over unprocessed food prices, and expected the negative price shock to end sooner.
At the time of making the August projection, information on the events with the greatest impact on alcohol and tobacco prices and regulated prices, such as the increase in the excise duty on tobacco and the cancellation of charges payable by television set owners, had already been available. The discrep- ancy between the projections and actual data arises in both cases from the relevant expert’s estimates. The estimate for the impact of the excise duty rise shows that the increase was ex- pected to affect prices sooner, whereas, in reality, the full im- pact will only unfold in the course of October and November.
As far as the group with regulated prices is concerned, the Bank’s estimate for the impact of the cancellation of television charges was lower than the value eventually calculated by the Statistical Office.
Table I-2 Assumptions of the August projection and actual data in 2002 Q3
Forint/euro exchange rate (HUF) 246.6 245.2
Dollar/euro exchange rate (cent) 99.2 98.3
Brent oil price (dollar/barrell) 25.8 27.0
Imported inflation of tradables prices (%)* 0.50 0.02 Household consumption expenditure (%)** 10.0 9.6 Gross private sector wages growth (%)** 13.0 13.4
* COICOP term: Non-energy industrial goods, Eurostat NewCronos code:
igoodsxe; mean of annualised month-on-month growth rates.
** Percentage changes on a year earlier; estimate of actual data in 2002 Q3.
Assumption used in the August Projection
Actual data
-1.5 -0.5 0.5 1.5 2.5 3.5
Percent
-1.5 -0.5 0.5 1.5 2.5 3.5
Percent
Germany Eurozone-11
Jan.95 May
.95
Sept.95 Jan.96 May.96
Sept.96 Jan.97 May
.97
Sept.97 Jan.98 May
.98
Sept.98 Jan.99 May
.99
Sept.99 Jan.00 May.00
Sept.00 Jan.01 May
.01
Sept.01 Jan.02 May
.02 Sept.02
I. Inflation
Chart I-8 Inflation projection fan chart*
(y(y(y(y(yearearearearear-on-y-on-y-on-y-on-y-on-year change, %)ear change, %)ear change, %)ear change, %)ear change, %)
3 The 4.9 percent October consumer price data was in line with our projection, and there is no need to modify our forecast.
* The fan chart shows the probability distribution of the outcomes around the central projection. The entire coloured area covers 90% of all probabilities. Outside the central projection (centred around the mode), the bands represent 15% probability each. The uncertainty intervals have been estimated relying on the Bank’s historical fore- casting errors and the uncertainties perceived by the Mon- etary Council regarding the current forecast. The year-end points represent the fixed inflation targets (7%, 4.5%, 3,5%
and 3.5% for December 2001-2004), while the straight lines mark the ±1% tolerance intervals on either side of the tar- get rates. The fan chart is always based on the quarterly CPI projections, so the end-of-the-year (December) target points are not directly comparable to quarterly data points.
Table I-3. Central CPI projection
2002 2003 2004
Weights Actual data Projection
(%) Q1 Q2 Q3 Q4 Dec. Q1 Q2 Q3 Q4 Dec. Q1 Q2 Q3 Q4 Dec.
Food 19.0 8.5 6.0 2.0 3.0 3.6 2.9 2.7 4.7 4.3 4.3 4.3 4.3 4.5 4.5 4.5
Unprocessed 6.2 9.5 5.3 -4.3 -0.9 0.8 -1.8 -0.2 6.6 5.2 5.0 4.9 4.7 4.7 4.7 4.7
Processed 12.8 7.9 6.1 5.1 4.9 5.0 5.1 4.1 3.9 3.9 4.0 4.0 4.1 4.4 4.4 4.4
Tradables 27.0 3.3 2.6 2.3 2.0 1.9 1.8 1.8 1.5 1.2 1.0 0.8 0.5 0.4 0.5 0.5
Market services 19.4 9.2 8.9 9.0 8.9 8.8 9.3 9.3 8.6 7.7 7.4 6.8 6.3 6.0 6.0 6.1
Market-priced energy 1.5 0.0 1.9 2.3 4.0 4.2 3.6 3.0 3.6 3.6 3.6 3.9 4.3 4.6 4.9 4.8
Vehicle fuels 5.2 -9.1 -7.3 1.8 11.4 13.8 12.9 8.2 4.2 1.1 1.1 3.3 3.6 3.5 3.5 3.4
Alcohol and tobacco 9.1 9.4 9.1 9.3 11.1 11.3 10.0 11.6 10.8 9.2 9.1 9.1 7.8 7.6 7.5 7.5
Regulated prices 18.9 7.9 7.2 3.8 3.3 3.3 4.0 5.1 6.6 6.1 6.0 6.2 5.8 6.0 5.8 5.8
CPI 100.0 6.2 5.5 4.6 5.1 5.3 5.3 5.3 5.5 4.7 4.6 4.6 4.2 4.2 4.2 4.2
Core inflation estimate 6.7 5.9 5.6 5.7 5.7 5.7 5.7 5.2 4.6 4.5 4.2 3.8 3.7 3.7 3.8
Annual average price index 5.4 5.2 4.3
I. 2 Projecting the consumer price index
T
he current projection has been prepared consistent with the macroeconomic course described in Chapters II.-III. The CPI is projected to be 5.4% in December 2002 and 4.6% in Decem- ber 2003. The current projections for both dates are higher than those of the August Report, indeed the CPI gets close to the 5.5%upper limit of the target range this December, and the inflation projection for next December is above the upper limit.3
The current projection of the December 2002 CPI figure has increased since the August Report despite the fact that the ac- tual CPI for the third quarter of 2002 proved to be below our previous forecast. One factor at work in this rise is that, as noted in the previous section, the favourable data for this summer were primarily due to impermanent price developments of volatile items falling outside the scope of monetary policy.
Another factor is that our “rules” for assumptions on exogenous variables implied that in this Report we used a relatively high oil price and weak dollar assumption all leading to a higher short term forecast (see more on this later).
This is the first Report that also forecasts inflation in 2004. The need that inflation should also be projected in the longer term arises as the full impact of the developments most relevant for inflation in 2003 will only unfold over the longer term. Thus, when judging monetary policy decisions, it may be useful to look fur- ther into the future. In the Bank’s projection, CPI is at 4.2% in December 2004, close to the upper limit of the target range.
I. 2. 1 Assumptions of the central projection
The current central projection is based on assuming gross wage growth in the private sector to be at 6% in 2003. Nevertheless, the ripple effects on demand and costs of the upsurge in wage and income growth experienced in 2002 are also taken into consideration.
In case of the oil prices we used, as previously, the highest price scenario of a number of available forecasts, for consider- ations of risk management. Just as at the time of the August
0 1 2 3 45 6 7 89 10 11
Percent
01:Q1 01:Q2 01:Q3 01:Q4 02:Q1 02:Q2 02:Q3 02:Q4 03:Q1 03:Q2 03:Q3 03:Q4 04:Q1 04:Q2 04:Q3 04:Q4
I. Inflation Chart I-9 Assumed Brent oil price developments
Chart I-10 Projections for tradables price inflation Seasonally adjusted, annualised quarter-on-quarter growth rates
Report, this involves a constant path fixed at the mean for the latest month (October).4
The current Report is different in that it estimates the rate of imported inflation using the Euro area rate of tradables price inflation rather than the German one, for reasons presented in the previous Chapter. However, the projection rule that the monthly growth in the inflation of Euro area tradable goods prices is in line with the historical average has remained un- changed. Our assumption on the exchange rate pass-through has also remained unchanged, but it is important to note that the anti-inflationary effects of nominal appreciation are damp- ened in 2003 by the ripple effects of the currently experienced high growth in wages and consumption.
The forint/euro exchange rate, in accordance with a con- stant assumption for monetary policy, and the dollar/euro ex- change rate are fixed at the average rate of October. The nu- merical assumptions of the current and the August Reports are shown in the table below.
I. 2. 2 Details of the central projection
In the Bank’s experience, methods based on expert informa- tion and process inertia have a better forecasting power over the one to two quarter horizon than economic theory-based models. Therefor the short-term forecasts for one and two quar- ters ahead are separated from medium-term forecasts used on the one-to-two year horizon.
Short-term forecast
Based on developments seen between July and September, the CPI is expected to rise during the final quarter. In particular, the price index for tradable goods is expected to be flat to fall- ing in the next two quarters, as indicated by data on the third quarter and according to the short-term forecast based on the inertia of inflation process.
The price index for market services remained static in the final quarter, in a month-on-month comparison. Yet this is only expected to last during the last quarter of 2002, as the path for unit labour costs derived on the basis of the wage growth as- sumption will begin to exert downward pressure on inflation.
Medium-term forecast
Tradables price inflation is expected to moderate during the period to end-2003. The factor in the decline lies primarily in the Bank’s wage cost and consumption assumptions for 2003, in addition to the direct impact of the earlier appreciation of the exchange rate. However, the impact of the 2001 apprecia- tion will taper off in 2004, simultaneously with a pick-up in quarterly wage growth, pushing up quarterly rates in 2004.5
Market service prices will follow a similar trend with the only difference being that in early 2003 the disinflationary pressure of low wage costs on the demand side will be offset, to some extent, by the full-year effect of the upsurge in consumption in 2002.6 As a combined result of these two opposing factors, the
19 20 21 22 23 24 25 26 27 28
dollar/barrel
Projection based on futures prices Constant Consensus Economics
01:Q1 01:Q2 01:Q3 01:Q4 02:Q1 02:Q2 02:Q3 02:Q4 03:Q1 03:Q2 03:Q3 03:Q4 04:Q1 04:Q2 04:Q3 04:Q4
Table I-6 Assumptions of the central projection
August 2002 Current projection projection
2002 2003 2002 2003 2004
Forint/euro exchange rate 246.6* 246.6 243.6* 243.6 243.6 Dollar/euro exchange rate (cent) 99.2* 99.2 98.2* 98.2 98.2 Brent oil price (USD/barrel) 25.8* 25.8 27.6* 27.6 27.6 Imported inflation (annual average of
annualised monthly growth rates) 0.4** 0.5** 1.4** 1.1** 1.1**
Gross wage growth in
private sector (%) 13.0 5.0 13.4 6.0 6.0
Growth in consumption expenditure (%) 9.8 7.1 9.4 7.3 3.9
* Assumptions for the remainder of the year.
** The assumptions of the August projection apply to German tradable inflation, while for the current projection they apply to euro area tradable inflation.
* Constant: October average (27,6 dollar/barrel); Consen- sus Economics path is based on the September 16 survey;
Futures prices path is based on 5 November market prices.
0.0 0.5 1.0 1.5 2.0 2.5 3.0 3.5 4.0 4.5 5.0
Percent
01:Q1 01:Q2 01:Q3 01:Q4 02:Q1 02:Q2 02:Q3 02:Q4 03:Q1 03:Q2 03:Q3 03:Q4 04:Q1 04:Q2 04:Q3 04:Q4
4 The effects of the decrease in the price of vehicle fuels observed in late October and early November are analyzed among the risk factors.
5 As part of the 2003 Budget Act, the consumption tax on coffee and gold will be abolished in January 2004, which is expected to exert slight downward pressure on the price index.
6 The factors to blame for the higher price index of market services in early 2003 also include the cancellation of the preferential VAT classification of goods transport.
I. Inflation
Chart I-11 Projection for market services inflation Seasonally adjusted , annualised quarter-on-quarter growth rates
rate of inflation for the year as a whole is predicted to rise un- til mid-2003, despite the decline in quarter-on-quarter rates, expected as early as the start of 2003. The full impact of low wage growth assumed for 2003 will only be felt after mid-2003, leading to a fall in inflation in the course of 2004 and a slight increase towards the end of the forecast horizon.
The inflation differential between market services and tradables prices is another good illustration of the full-year ef- fect of the 2002 consumption shock in 2003. As market service prices tend to be more vulnerable to changes in demand, the inflation differential will widen in early 2003, to fall off again by late 2004. The nominal appreciation experienced in 2001 also influence the inflation differential by decreasing the in- flation of tradable goods.
After discussions with agricultural experts, the Bank’s as- sumption for the price of pork, accounting for a major share of unprocessed food products, is for moderately rising prices beginning from the second half of 2003 and lasting until the end of the forecast horizon. This is a cautious estimate, which assumes that domestic prices, despite the current situation, will not persistently break away from the euro area price level and that there is no evidence of any increase in the price level in European markets. The estimate for the price of wheat also reflects the Bank’s expectation of a rising price level before the end of the forecast horizon.
All this will naturally feed through into processed food prices as well, but manufacturing wage costs also play a significant role. This is the reason why, just as in the case of tradables and market services, the price index for this group declines until late 2003, before it begins to climb up slowly in the course of 2004.
As far as the alcohol and tobacco group is concerned, to- bacco prices are crucially affected by an intended increase in excise duties in April 2003, as indicated by the 2003 Budget Act.7 The planned increase on its own will raise the rate of in- flation by 0.3 percentage points in December 2003, as staff’s preliminary tests suggest that the duty rise will fully feed through into consumer prices. The low estimates of motor fuel price indices in 2003 are due to the assumption that the planned duty rise will not take place in 2003, but only in early 2004.
The August projection for the inflation of regulated prices is maintained for technical reasons. This is based on the as- sumption that, with the planned taxation changes included, regulated prices will largely develop in accordance with the inflation target. The only departure from this rule occurs when there is reason to do so on account of price increases post- poned from 2002.
As no information is currently available concerning the evo- lution of regulated prices in 2004,8 the technical rule adopted is that they will change at the same rate as market service prices.
Chart I-12 Inflation differential between market service and tradables prices
Difference of year-on-year indices
5 6 7 8 9 10 11 12 13 14
Percent
01:Q1 01:Q2 01:Q3 01:Q4 02:Q1 02:Q2 02:Q3 02:Q4 03:Q1 03:Q2 03:Q3 03:Q4 04:Q1 04:Q2 04:Q3 04:Q4
5.0 5.5 6.0 6.5 7.0 7.5 8.0 8.5
Percentagepoint
01:Q1 01:Q2 01:Q3 01:Q4 02:Q1 02:Q2 02:Q3 02:Q4 03:Q1 03:Q2 03:Q3 03:Q4 04:Q1 04:Q2 04:Q3 04:Q4
7 Although the Bank has no information on 2004, it assumes an increase in the price of cigarettes of an average rate for the tobacco group, scheduled in April for technical reasons.
8 The Bank assumes that the zero-rate VAT classification of pharmaceuticals and textbooks will be abolished, consistent with European Union regulations.
I. Inflation
I. 2. 3 Uncertainty surrounding the projection and some alternative paths
The Bank believes that the size of the uncertainty surround- ing the central projection does not significantly differ from the value deriving from the volatility of historical observations. The only exception seems to be the short-term projection for oil prices based on the technical rule, which is surrounded by larger-than-usual uncertainty, due to the geopolitical situation.
In the Monetary Council’s view private sector wages and oil prices have significant influence over the direction of the un- certainty. The assumption for wage growth poses upside risk to the central inflation projection both in 2003 and 2004. This risk, which is especially high in 2003, is offset by the downside risk to the projected global oil price profile over the full fore- cast horizon.
The upside risk to inflation associated with private sector wage growth is grounded in the possibility that unless eco- nomic agents change their behaviour, in other words, unless there is a change in the past labour market trend, the Bank’s projected wage growth profile will be significantly higher than the central projection, especially in 2003.
The risk to the oil price projection is governed by both a short-term and a long-term trend. On the one hand, while the staff were finalising the projection, global oil prices began to sink as of late October. As a result, Hungarian petrol prices also began to fall in late October and early November, in addi- tion to a weakening of the dollar. Provided that these trends continue until the year-end, the December CPI will be 0.2 per- centage points lower than the estimated 5.3%.
On the other hand, the central projection is based on a higher oil price scenario over the full forecast horizon, due to consid- erations of risk management. This constitutes a downside risk over the longer term, as market indicators, such as analysts’
consensus forecast and futures prices, all point to the likeli- hood of a lower oil price. The distribution in the fan chart is determined by this asymmetrical uncertainty over the longer term.
On the whole, the uncertainty about wages and oil prices constitutes a downside risk to the central projection for the CPI at end-2002 and to an upside risk in 2003, while the risks around the end-2004 projection are broadly neutral.
The direction of the risks is also reflected in the probability distribution. Accordingly, the probability that the price index exceeds the upper limit of the target range is at roughly 20%
this December, and 70% at end-2003. The probability that in- flation will fall below the lower limit of the target range is mar- ginal in both years. In contrast, the corresponding figures for December 2004 show a much more balanced picture, with 40%
probability that the price index exceeds the upper limit and 20% that it moves below the lower limit.
Table I-5 Bounds of the bands in the fan chart Changes on a year earlier
90% 60% 30% Central 30% 60% 90%
lower lower lower path upper upper upper (mode)
2002 Q4 3.6 4.4 4.8 5.1 5.4 5.7 6.2
2003 Q1 3.3 4.3 4.8 5.3 5.7 6.1 6.9
2003 Q2 3.3 4.2 4.8 5.3 5.8 6.4 7.5
2003 Q3 3.4 4.4 5.0 5.5 6.1 6.9 8.2
2003 Q4 3.0 3.8 4.3 4.7 5.5 6.4 8.1
2004 Q1 2.4 3.5 4.1 4.6 5.4 6.4 8.0
2004 Q2 1.6 2.9 3.6 4.2 5.1 6.0 7.8
2004 Q3 1.1 2.6 3.5 4.2 5.0 6.0 7.7
2004 Q4 0.7 2.4 3.4 4.2 5.0 6.0 7.7
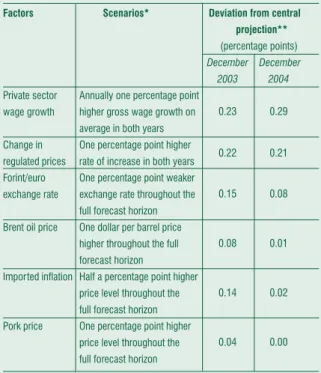
Table I-6 shows how deviations by the projected key variables from the basic assumptions affect the rate of inflation.
Table I-6 Changes in the central projection under a variety of scenarios Factors Scenarios* Deviation from central
projection**
(percentage points) December December
2003 2004
Private sector Annually one percentage point wage growth higher gross wage growth on
average in both years
0.23 0.29
Change in One percentage point higher
regulated prices rate of increase in both years 0.22 0.21 Forint/euro One percentage point weaker
exchange rate exchange rate throughout the full forecast horizon
0.15 0.08
Brent oil price One dollar per barrel price higher throughout the full forecast horizon
0.08 0.01
Imported inflation Half a percentage point higher price level throughout the full forecast horizon
0.14 0.02
Pork price One percentage point higher price level throughout the full forecast horizon
0.04 0.00
*For each scenario, the shocks are assumed to occur from January 2003.
** Difference of year-on-year indices.
II. Demand and Output
II. 1 Demand
T
he Bank has revised down its current forecasts of economic growth for both 2002 and 2003 by more than half a per cent relative to the August Report. The major difference be- tween the current and the previous projection reflects the Bank’s assessment of future developments in external demand.Information which has become available for 2002 since the previous Report suggests that, following a pick-up in the sec- ond quarter, external demand will likely stagnate in the sec- ond half. The current forecast for 2003 also contains a some- what more moderate increase in external demand. From among the GDP items on the uses side, this projected lower external demand has had a downward effect on the Bank’s forecasts of exports and corporate investment and, on the production side, on its forecast of manufacturing value added.
According to actual data for the first half, Hungarian eco- nomic growth has been driven by the very high level of house- hold consumption in 2002. Investment has been a less robust contributory factor. Net trade has dampened the rate of eco- nomic growth a little. The Bank expects the above develop- ments to continue in H2, with a higher negative net trade bal- ance. The high negative value of inventories and the statistical error in H1 suggests inconsistencies between the uses and pro- duction sides. Due to the problems with measuring gross do- mestic product, the Bank sees it a legitimate choice to base the forecast of GDP in the Report primarily on its projection for the production side, following a cautious central bank ap- proach. The uncertainty in aggregate GDP figures, however, do not cause a problem in forecasting inflation, as according to the Bank, household purchased consumption will likely be a driving force of movements in prices on the 1 to 2-year hori- zon.
The Bank’s forecast for 2003 is conditional, as, we assumed a very modest increase in corporate sector gross wages as a basis. The current lower expected economic growth for 2003 relative to the previous forecast reflects the lower outturn for growth in investment and exports, in addition to a somewhat more modest actual level of household demand than previ- ously thought.
In 2004, domestic demand will likely grow at a more mod- est rate compared with the previous year, but this will be off- set by a pick-up in external demand, with the result that eco- nomic growth may turn out to be higher over the year as a whole.
Demand and Output
Chart II-1 Quarterly GDP growth projection (Annualised quarter-on- quarter growth rates)
0 1 2 3 4 5 6 7
Percent
0 1 2 3 4 5 6 7
Percent
New Previous
98:Q1 98:Q3 99:Q1 99:Q3 00:Q1 00:Q3 01:Q1 01:Q3 02:Q1 02:Q3 03:Q1 03:Q3 04:Q1 04:Q3
Table II-1 Growth in GDP and its components Percentage changes on a year earlier
Actual Projection 2001 2002 2003 2004
Household consumption 5.0 8.3 6.4 3.4
Household consumption expenditure 5.6 9.4 7.3 3.9
Social transfers in kind 2.5 3.5 2.5 1.3
Public consumption 4.4 2.8 1.5 1.5
Gross fixed capital formation 3.5 6.5 4.3 4.2
‘Final domestic sales’* 4.6 7.3 5.4 3.5
Inventory investment and
other non-specified use** (-41) (-45) (-20) (+20)
Domestic absorption 2.0 5.6 4.9 3.7
Exports 9.1 4.8 5.7 9.7
Imports 6.3 8.4 7.1 8.7
GDP 3.7 3.2 3.9 4.2
* Final domestic sales = household consumption + public consumption + gross fixed capital formation.
** This reflects the statistical error which may be significantly negative in 2002.