QUARTERLY REPORT
ON INFLATION
August
2001
Prepared by the Economics Department of the National Bank of Hungary Head: István Hamecz, Head of Department
Issued by the Department for General Services and Procurement of the National Bank of Hungary
Responsible for publishing: Botond Bercsényi, Head of Department Prepared for publication by the Publications Group of the Department
for General Services and Procurement 1850 Budapest, V., Szabadság tér 8–9.
Mailing: Miklós Molnár Phone: 36-1-312-4484
Fax: 36-1-302-3714 Internet: http: //www.mnb.hu
ISSN 1419-2926
The new Act on the National Bank of Hungary, enacted by Parliament and effective as of 13 July 2001, defines the primary objective of the Bank as the achievement and maintenance of price stability. Using an inflation targeting system, the Bank seeks to attain a 2% rate of infla- tion, corresponding in effect to price stability, by implementing a grad- ual, but firm disinflation programme over the course of several years.
In order to provide the public with a clear insight into the operation of central bank policies and enhance transparency, the Bank publishes the “Quarterly Report on Inflation”, covering recent and prospective de- velopments in inflation and evaluating the macroeconomic develop- ments determining inflation. This publication summarises the projec- tions and considerations that underlie the decisions of the Monetary Council.
The Monetary Council, the supreme decision making body of the Na- tional Bank of Hungary, will carry out a comprehensive review of the expected development of inflation once every three months, in order to establish the monetary conditions that are consistent with achieving the inflation target. The first section of the publication presents the Mone- tary Council’s position and the grounds for its decisions. This is followed by a projection prepared by the analysts at the Bank’s Economics Department on the outlook for inflation and the underlying principal macroeconomic developments. This projection serves as background information for Monetary Council members.
Since the Monetary Council was only established subsequent to the com- pletion of this Report, the first projections presented herein for the vari- ables that can be regarded as exogenous to monetary policy are either determined on the basis of market expectations or use the data for the last complete month, assuming that these remain unchanged during the forecast period. In the future, the assumptions underlying the pro- jections will reflect the stance of the Monetary Council.
² ² ²
AUGUST2001 • QUARTERLYREPORT ONINFLATION
3
EVALUATION OF MONETARY POLICY . . . 9
I. INFLATION . . . 11
II. MONETARY POLICY, INTEREST RATES AND THE EXCHANGE RATE . . . . 13
1 Central bank interest rates and short-term market yields. . . 13
2 Changes in risk perceptions . . . 14
3 Capital flows and the exchange rate . . . 15
4 Long-term yields and inflation expectations . . . 17
III. DETERMINANTS OF INFLATION . . . 19
1 Demand. . . 19
1.1 Household consumption . . . 21
1.2 Investment . . . 22
1.3 The fiscal stance. . . 23
1.4 External trade . . . 24
2 Supply factors – the labour market . . . 25
2.1 Wage inflation . . . 26
3 Imported inflation . . . 28
4 Effect of regulation and extraordinary factors . . . 29
IV. FORECAST OF THE CONSUMER PRICE INDEX AND RISK ASSESSMENT . . . 30
1 The forecast . . . 30
2 Assumptions of the central projection . . . 31
3 Balance of risks . . . 32
4 Market participants’ inflation expectations . . . 34
SPECIAL TOPICS . . . 35
1 New system of monetary policy . . . 35
2 Forecasting methodology . . . 37
3 Inflationary effect of exchange rate changes . . . 38
AUGUST2001 • QUARTERLYREPORT ONINFLATION
5
Contents
1998
Changes in the central bank’s monetary instruments . . . 23
Wage inflation – the rise in average wages . . . 62
Wage increases and inflation . . . 63
Impact of international financial crises on Hungary . . . 85
March 1999 The effect of derivative FX markets and portfolio reallocation of commercial banks on the demand for Forints . . . 20
What lies behind the recent rise in the claimant count unemployment figure? . . . 34
June 1999 New classification for the analysis of the consumer price index . . . 14
Price increase in telephone services . . . 18
Forecasting output inventory investment . . . 32
Correction for the effect of deferred public sector 13thmonth payments . . . 39
What explains the difference between trade balances based on customs and balance of payments statistics? . . . 44
September 1999 Indicators reflecting the trend of inflation . . . 14
The consumer price index: a measure of the cost of living or the inflationary process? . . . 18
Development in transaction money demand in the South European countries . . . 28
Why are quarterly data used for the assessment of foreign trade? . . . 37
The impact of demographic processes on labour market indicators . . . 41
What explains the surprising expansion in employment? . . . 42
Do we interpret wage inflation properly? . . . 45
December 1999 Core inflation: Comparison of indicators computed by the National Bank of Hungary and the Central Statistical Office . . . 18
Owner occupied housing: service or industrial product? . . . 20
Activity of commercial banks in the foreign exchange futures market . . . 26
March 2000 The effect of the base period price level on twelve-month price indices – the case of petrol prices . . . 19
The government’s anti-inflationary programme in the light of the January CPI data and prospective price measures over 2000 taken within the regulated category . . . 21
The impact of the currency basket swap on the competitiveness of domestic producers . . . 51
June 2000 How is inflation convergence towards the euro area measured? . . . 14
Inflation convergence towards the euro area by product categories . . . 15
6
NATIONALBANK OFHUNGARYBoxes and Annexes in the Quarterly Report
on Inflation
Changes in the central bank’s monetary instruments . . . 23
Transactions by the banking system in the foreign exchange markets in 2000 Q2 . . . 26
Coincidence indicator of the external cyclical position . . . 39
How is the wage inflation index of the NBH calculated? . . . 47
September 2000 Background of calculating monetary conditions . . . 20
Foreign exchange market activities of the banking system in 2000 Q3 . . . 25
December 2000 Changes in the classification methodology of industrial goods and market-priced services . . . 25
Different methods for calculating the real rate of interest . . . 27
Changes in central bank instruments . . . 28
Foreign exchange market activities of the banking system in the period of September to November . . . 31
Hours worked in Hungarian manufacturing in an international comparison . . . 53
Composition effect within the manufacturing price-based real exchange rate . . . 57
March 2001 Foreign exchange market activities of the banking system from December 2000 to February 2001. . . 30
Estimating effective labour reserves . . . 50
August 2001 1 New system of monetary policy . . . 35
2 Forecasting methodology . . . 37
3 Inflationary effect of exchange rate changes . . . 38
AUGUST2001 • QUARTERLYREPORT ONINFLATION
7
Boxes and Annexes in the Quarterly Report on Inflation
A t its session on 23 July 2001, the Monetary Council reviewed the report on the state of the economy and the expected developments with regard to growth and inflation. After the discussion of the report, the Monetary Council took the position that there was currently no need to change the monetary conditions. On the basis of the currently expected external and internal economic conditions, an exchange rate in the current range of 245–250 forints to the euro will help inflation stay within the projected 7 ± 1% band at the end of 2001 and meet the 4.5 ± 1% inflation target by the end of 2002. This inflation projection is based on the assump- tion that the world price for oil and the euro/dollar exchange rate will not change significantly relative to their average values in June, and cyclical conditions will also be in line with projec- tions.
The past two months have witnessed significant tightening in monetary conditions. Based on the joint decision of the Central Bank Council and the Government, the Bank widened the in- tervention band of the forint's exchange rate to ±15% as of 3 May 2001, while retaining the 0.2%
monthly rate of devaluing the forint's central parity. Since the change in the exchange rate sys- tem, the central bank has not made any interest rates changes, but the widening of the band has been followed by an appreciation of the forint. The key factor behind the appreciation has been higher external demand for longer term government securities. As a complementary measure to the band-widening, a government decree, effective as of June 18, removed, all remaining restric- tions in the way of the forint's full convertibility. In spite of this foreign currency liberalisation, there have been no significant speculative short-term interest rate sensitive capital inflows.
The transformation of the monetary regime was necessitated by the persistently high rate of inflation. This unfavourable development could be primarily attributed to a series of negative external shocks occurring over the past one and a half years. In addition to these shocks, the neg- ative effects of inflation expectations have also become a contributing factor from the second half of 2000.
In the opinion of the Monetary Council, it is not the overheating of the economy that is to blame for the worse-than-projected outcome of inflation: the unfavourable turn in the external cyclical conditions is expected to cause a slowdown in this year's aggregate demand growth compared to 2000. Consequently, the National Bank seeks to moderate inflation expectations so that the slowing of inflation can take place at the smallest possible cost to economic growth.
Under the regime of inflation targeting, the National Bank will give guidance to economic agents by projecting a disinflation path over a horizon of several years. If prices and wages rise in accor- dance with the projected path, it will be possible to curtail the economic costs of disinflation.
The National Bank expects that the private sector will exhibit greater flexibility than this year in adjusting wage increases.
Based on its forecasts, the Bank expects GDP to grow in a balanced manner at a rate in the range of 4–5% in both 2001 and 2002. The slowdown in the economic growth of Hungary's main international trading partners in 2001 will be offset by expansionary fiscal policy. Of the domestic
AUGUST2001 • QUARTERLYREPORT ONINFLATION
9
Evaluation of monetary policy
components of demand, consumer spending is expected to grow by 4.5%, thanks to a rapid rise in household incomes.
In 2002, the forces driving growth are expected to change.
In line with international forecasts, the National Bank also expects a pick-up in external economic growth. Public sector demand will no longer rise compared with 2001; fiscal policy will not signifi- cantly increase aggregate demand according to the Monetary Coun- cil's expectations.
As a result of domestic absorp- tion outstripping GDP growth in both years, the external financing requirement will increase. The cur- rent account deficit is expected to amount to about 4% of GDP in 2001 and slightly above it in 2002. Based on projections regarding financing, these deficits are consistent with the Bank's exchange rate objectives.
Forecasting the path of inflation over the short term is a difficult task since during the current period of transition the National Bank has not yet gained sufficient experience about how long economic agents' adjustment to the new regime will take. Therefore, when making its projec- tions, the National Bank has also relied on the experience of European small open economies with exchange rate regimes similar to that of Hungary in order to make up for missing informa- tion. The Monetary Council expects that economic agents will pay increasing attention to the new exchange rate and inflation path when setting their prices.
The Monetary Council's expectation is that the external inflationary pressures that prevailed over the past two years will gradually disappear. This assumes, inter alia, that unprocessed food- stuff prices will increase at a considerably slower pace.
With unchanged monetary policy and assuming that the external and domestic develop- ments are in line with the above projections, the National Bank projects the rate of consumer price inflation to be in the range of 7–8% in December 2001, i.e. the upper range of the Bank's inflation target band. In comparison, the inflation rate for December 2002 is more likely to fall in the lower range of the target band. The degree of uncertainty about the inflation outcome is sig- nificant in both years. In 2001, the risks have an asymmetrical distribution, being more on the up- side. This is due to the uncertainty about the development of unprocessed foodstuff prices. The uncertainty about the inflation outcome in 2002 can be viewed as symmetrical.
MONETARY COUNCIL
10
NATIONALBANK OFHUNGARYEvaluation of monetary policy
01 23 45 678 109 1112
2000:Q1 2000:Q2 2000:Q3 2000:Q4 2001:Q1 2001:Q2 2001:Q3 2001:Q4 2002:Q1 2002:Q2 2002:Q3 2002:Q4
%
Chart 1Inflation projection Percentage changes on a year earlier
Note:The fan chart shows the probability distribution of the outcomes around the central projection.
The central band with the darkest shade includes the central projection. The entire shaded area cov- ers 90% of all probabilities, with a 5% likelihood that the inflation outcome will fall outside the upper- most shaded band. Outside the central projection, the bands represent a 15% probability each. The uncertainty intervals have been estimated on the basis of the Bank’s past forecasting experience er- rors, taking into account the uncertainties about the current projections. The two white dots represent the inflation targets (7% and 4.5%); the straight lines mark the ±1% tolerance band on either side of the target rates..
I
n the first half of 2001, the consumer price index (CPI) of 10.4%exceeded the average rate for the past two years. The factor be- hind this negative development was inflation inertia emerging in the aftermath of last year’s temporary inflationary shocks, aggra- vated by yet another rise in unprocessed foodstuff prices in the second quarter.
In terms of consumer basket components,tradable goods and market services pricesplay a crucial role from the point of view of monetary policy. The former provides information as to the effi- ciency of the transmission mechanism of exchange rate policy, i.e.
the operation of the exchange rate channel. The latter reflects the credibility and sustainability of exchange rate-based disinflation.
Inflation in tradable goods, accounting for roughly one- quarter of the consumer basket, is determined by the imported inflation rate and the exchange rate path. During the first six months, inflation rates of over 5% exceeded the rate at which the forint depreciated in 12 month. Yet this difference between the rates of price increases and devaluation can be satisfactorily ex- plained by the acceleration in tradable goods price inflation im- ported from Europe (see Chart I-1).
The direct effect of past supply shocks and the indirect effect of the inflation inertia triggered by such have been most apparent in market services price inflation. Unlike tradable goods prices, those ofmarket servicesare not disciplined by import competi- tion. They are primarily governed by cost-side inflation develop- ments, domestic demand and domestic price setters’ inflation ex- pectations. The first was undoubtedly a contributing factor to the rise in the services price index, with the jump in energy and fuel prices, and in meat prices last summer, not taking long to feed through to services prices. However, the direct inflationary pres- sures arising from last year’s developments have tapered off this year, and domestic demand growth has also moderated. There- fore, the Bank attributes the acceleration in the price index to ser- vices sector price setters’ higher inflation expectations. In 2001 Q2, the adverse trend in the price index of services seemed to have reversed, beginning to decline again in this quarter (see Chart I-2).
In 2001 Q2, the jump in the price of pork directly raised head- line CPI inflation by 0.8 percentage points. According to the Bank’s estimates, within the course of one year, unprocessed foodstuff price inflation may feed through to about one-fifth of the goods in the consumer basket. This will first push up pro- cessed foodstuff prices and subsequently prices of certain ser- vices that are sensitive to food prices. Last summer’s meat price shock, together with the cereal price increases in autumn 2000, has kept the quarterly price index values high for nearly a year .
AUGUST2001 • QUARTERLYREPORT ONINFLATION
11
I. Inflation
-2.0 -1.5 -1.0 -0.5 0.0 0.5 1.0 1.5 2.0
Jan.99 Apr.99 July.99 Oct.99 Jan
.00
Ap
r.00
July
.00
Oct.00
Jan
.01
Ap
r.01
%
-2.0 -1.5 -1.0 -0.5 0.0 0.5 1.0 1.5 2.0
%
Difference from imported inflation expressed in forint terms Difference exchange from rate path
Chart I-1Difference between increases in domestic tradable goods prices and imported tradable goods price inflation
Difference between annual rates of increase
8 10 12 14 16 18 20
98:Q1 98:Q2 98:Q3 98:Q4 99:Q1 99:Q2 99:Q3 99:Q4 00:Q1 00:Q2 00:Q3 00:Q4 01:Q1 01:Q2 %
Market services
Chart I-2Market services price inflation Percentage changes on a year earlier
Extreme fluctuations in the prices of domestic agricultural products, which significantly exceed the rates seen in neighbour- ing countries and the EU countries, represent additional serious challenges to disinflation policy (see Chart I-3).
After declining at the end of last year, the price level ofvehicle fuels,regarded as a large CPI component, rose at a steady rate throughout the first six months, approaching the peak rate mea- sured before last year's decreases. In addition to flat oil prices and a weak euro, this appeared to be the result of a one-off sup- ply shock, exerting extra upward pressure on the regional price level of petrol. Available data show that the domestic price level of petrol has started to decrease since May, due party to the strengthening of the forint. This decline is expected to first ap- pear in the July price index. Following an over 60% rise in 2000, market-priced household energy (bottled gas, briquette, coal and firewood) prices have been falling steadily over the past few months.
On the whole,regulated pricesfollowed our expected trend, rising by 7.8% during the first six months, not as fast as the CPI, which thus exerted downward pressure on inflation during the first half of the year.
Prices regulated by the central authorities increased by 6% in general. This rate refers to electricity and, in rough terms, com- munication and subsidised pharmaceuticals prices. The price for natural gas rose by 12% in July, but the impact of this increase will first appear in August.
The prices of services provided by local government authori- ties increased faster than the targeted 6% rate. Prices for housing services went up by 10% during the first half of the year. District heating prices will begin increasing from the start of the heating season in autumn.
The 6% average valorisation of excise duties took place early in the year. This comprised a 15% rise in the tax on tobacco, aimed to approximate tax content norms within the EU. By con- trast, the excise tax on vehicle fuel remained unchanged. The rate of excise duties had a 0.3 percentage point impact on head- line CPI.
12
NATIONALBANK OFHUNGARYI. Inflation
-15 -10 -5 0 5 10 15 20 25 30
98:Q1 98:Q2 98:Q3 98:Q4 99:Q1 99:Q2 99:Q3 99:Q4 00:Q1 00:Q2 00:Q3 00:Q4 01:Q1 01:Q2 %
-15 -10 -5 0 5 10 15 20 25 30
%
Processed foodstuffs Unprocessed foodstuffs Chart I-3 Food price inflation
Percentage changes on a year earlier
100 110 120 130 140 150 160
Jan.99 Apr.99 July.99 Oct.99 Jan
.00
Apr.00
July
.00
Oct.00
Jan
.01
Apr.01
1998=100
100 110 120 130 140 150 160
1998=100
Petrol Market-priced household energy
Chart I-4 Vehicle fuel and market-priced household energy price levels
1 Central bank interest rates and short-term market yields
T
he National Bank has not changed its key rates over the past four months. While the level of interest rates remained un- changed, monetary conditions tightened significantly, as the widening of the band was followed by a 5–10% appreciation of the forint’s exchange rate. Under the narrow-band regime pre- ceding the band-widening, the so-called interest premium, de- rived as the difference between three-month forint and foreign (euro) yields and the rate of devaluation announced for the sub- sequent three months, provided a good approximation of ex- pected excess returns on short-term forint investments. This was because, apart from periods of capital market crises, intra-band exchange rate movements were minimal: the exchange rate, which stayed near the strong edge of the intervention band, was expected to depreciate over the short term at virtually the same rate as the official rate of devaluation.With the widening of the band in May, the earlier method of calculating the interest premium is no longer suitable, since the official rate of devaluation and the exchange rate expectations are no longer as closely linked as under the narrow-band system.
Therefore, following the change of the regime, the Bank is focus- sing on the (actual and expected) three-month interest rate dif- ferential vis-à-vis the euro area (see Chart II-1).
The difference between three-month forint and euro yields has fluctuated in the range of 630 and 670 basis points over the past four months. (see Chart II–2). Short-term forint rates re- mained relatively stable in this period. The fluctuation of the in- terest rate differential was more of a result of swings in short-term euro yields as expectations of an ECB rate cut were continuously changing.
Forward yields derived from the yield curve and the Reuters poll provide indications of market participants’ expectations re- garding the future course of the central bank interest rate. The ex- pectations for the central bank rate at end-2001 remained virtu- ally unchanged during the period from March to early July, at around 10%. Thus, neither the band-widening, nor the an- nouncement of the inflation target have significantly altered ex- pectations pertaining to this year’s interest rate policy. At the same time, unchanged nominal rates reflect higher real interest rate expectations, since the period since March has seen a de- crease in macroanalysts’ inflation expectations for end-2001.The investor confidence crisis about emerging markets first experi- enced on July 6th and the weakening of the forint have changed
AUGUST2001 • QUARTERLYREPORT ONINFLATION
13
II. Monetary policy, interest rates and the exchange rate
9 9.5 10 10.5 11 11.5 12
02.01.01 16.01.01 30.01.01 13.02.01 27.02.01 13.03.01 27.03.01 10.04.01 24.04.01 08.05.01 22.05.01 05.06.01 19.06.01 03.07.01
%
4 4.5 5 5.5 6 6.5 7
%
3-month HUF yield NBH base rate 3-month EUR yield (rhs) ECB MRO rate (rhs) Chart II-1 Central bank base rate and short-term market yields
550 570 590 610 630 650 670 690 710 730 750
02.01.01 16.01.01 30.01.01 13.02.01 27.02.01 13.03.01 27.03.01 10.04.01 24.04.01 08.05.01 22.05.01 05.06.01 19.06.01 03.07.01
basispoints
Chart II-2 Three-month interest rate differential vis-à-vis the euro area
interest rate expectations. There has been an upward shift in the expected path of central bank rates: according to the two-week interest rate path derived from the yield curve, at mid-July, mar- ket participants did not expect a rate cut for the following month (see Chart II-3).
2 Changes in risk perceptions
T
he perceived risk of forint investments, which is crucial to the development of capital flows and yields, is more markedly reflected in exchange rate movements now that the band has been widened. In addition to domestic economic fundamentals, international money and capital markets’ “global appetite for risk” frequently has a great influence on the perceived risk of Hungarian investments.Over the past few months, foreign investors’ willingness to take risk has been influenced by swings in expectations about US growth prospects and the Fed’s interest rate moves. A similar fac- tor of uncertainty was associated with the cyclical position of the euro area, where the adverse effect of slowing US growth and the European Central Bank’s tight interest rate policy have both dampened growth expectations. Furthermore, the general risk perception of emerging countries has also had an impact on in- vestors’ willingness to take on risk, especially in July.
Continuing the trend seen early in the year, the indicators of the „appetite for risk” in developed countries continued to in- crease in March, thanks primarily to deterioration in and higher uncertainty about US economic prospects. However, the publi- cation of more favourable data in April and another unexpected rate cut by the Fed on April 18th gave rise to more optimism.
Since then, indicators of risk-taking willingness have steadily de- clined. This first upward, then downward path of risk perception has been reflected in the interest premium on Hungarian foreign currency bonds as well as the inflow of portfolio capital, which showed a modest pace in March, but strengthened in April.
The EMBI spread,1 reflecting the risk premia on dollar- denominated emerging country sovereign bonds, moved in an opposite direction to global risk indicators in April. However, this was exclusively due to unfavourable news from Argentina and the higher required risk premia on South American sover- eign bonds. Other (European and Asian) components of the EMBI indicate that investors only perceived a region-specific threat (see Chart II-4).
During May and June, foreign investor behaviour on the Hun- garian money and capital market was primarily influenced by country-specific factors (such as the widening of the band, for- eign currency liberalisation and the announcement of the new exchange rate regime). Nevertheless, global investor sentiment was also beneficial to capital inflows: there was improvement in the risk perception of both emerging and developed markets during this period.
However, the Hungarian foreign exchange market experi- enced another episode of emerging market contagion in July.
14
NATIONALBANK OFHUNGARYII. Monetary policy, interest rates and the exchange rate
8 8.5 9 9.5 10 10.5 11 11.5 12
04.01.00 04.03.00 04.05.00 04.07.00 04.09.00 04.11.00 04.01.01 04.03.01 04.05.01 04.07.01
%
600 650 700 750 800 850 900 950 1000
basispoint
3 year HUF yield EMBI spread (right-hand scale) Chart II-4 EMBI spread and the three-year HUF yield
1 JP Morgan’s Emerging Markets Bond Index+ (EMBI+) consist of spreads of dollar-denominated emerging country sovereign bonds over US trea- sury bond yields. The EMBI+ is thus an indicator of perceived emerging country risk.
8 9 10 11 12 13 14
15.03.00 14.05.00 13.07.00 11.09.00 10.11.00 09.01.01 10.03.01 09.05.01 08.07.01 06.09.01 05.11.01 04.01.02 05.03.02 04.05.02
%
8 9 10 11 12 13 14
%
2-week NBH deposit
8 March 28 June
12 July Reuters poll, 18 July Chart II-3 Central bank base rate expectations:
two-week interest rate path derived from the yield curve and the Reuters poll
A fresh wave of simultaneous bad news from Turkey and Argen- tina, suffering from economic and financial troubles for several months, and the controversy surrounding fiscal policy in Poland triggered a depreciation of a few percentage points in the forint’s exchange rate from July 6th on. At the same time, there was no significant increase in either the spread of Hungarian foreign cur- rency bonds or in forint yields.
3 Capital flows
and the exchange rate
T
he narrow-band exchange rate regime, in place for the first four months of the year, was characterised by a strong de- mand for forints. Demand was exceptionally high in February and April. The main factors behind this were non-residents’ pur- chases of long-term government securities and FDI inflows, while companies’ foreign currency borrowing fell. April saw a significant rise in non-residents’ demand for short-term govern- ment securities. Thanks to the vigorous inflow of funds, until the band was widened, the exchange rate of the forint lingered at the upper range of the intervention band, prompting the central bank to intervene on several occasions (see Chart II-5).After the band was widened on May 4th, non-residents’ de- mand for long-term government securities increased. The in- crease in foreign demand was offset by a decrease in commercial banks’ on-balance-sheet foreign currency open positions. Banks were only willing to wind up open positions as the exchange rate was steadily appreciating. The domestic currency strengthened steadily from HUF 267 to the euro on May 3rd to HUF 240 on July 4th, against the background of a nearly twofold rise in spot ex- change market turnover relative to that prior to the band- widening.
Non-residents’ government security purchases amounted to approximately HUF 100 billion in May. Growth was largely due to purchases of medium-term (one- to four-year) government se- curities. Since the risk premium on forint yields is not likely to have decreased in the wake of the band-widening, and me- dium-term euro yields rose during this period, the upturn in the demand for government securities can mainly be ascribed to a shift in exchange rate expectations. Movements in the stock of government securities point to foreign investors’ expectations of a strengthening of the forint over the medium term, while the un- certainty about more immediate movements has caused them to refrain from buying short-term paper.
In June, non-residents’ forint demand fell from HUF 141.2 bil- lion in May to HUF 4.7 billion. However, from the second week of June, commercial banks reopened their net on-balance-sheet foreign currency positions, which was a contributory factor in the June strengthening of the forint’s exchange rate.
The less favourable capital market situation in the aftermath of the Argentinian crisis in July led to a marked weakening in the ex- change rates of Central and East European national currencies, with the zloty down by 12% and the forint by 7%. The initial major shift in the exchange rates was followed by a correction in re- spect of both currencies. The depreciation of the forint might have been partly due to the closing of earlier positions estab- lished in expectation of an appreciation and the insufficient
AUGUST2001 • QUARTERLYREPORT ONINFLATION
15
II. Monetary policy, interest rates and the exchange rate
220 240 260 280 300 320 340
01.02.01 02.02.01 03.02.01 04.02.01 05.02.01 06.02.01 07.02.01
forint/euro
220 240 260 280 300 320 340
forint/euro
Forint/euro Central parity NBH intervention band
Chart II-5 Exchange rate of the forint
230 240 250 260 270
31.12.00 28.02.01 30.04.01 30.06.01 31.08.01 31.10.01 31.12.01 28.02.02 30.04.02 30.06.02 31.08.02 31.10.02 31.12.02
forint/euro
230 240 250 260 270
forint/euro
Analysts' exchange rate expectations - June poll Exchange rate - June 2001 poll
Analysts' exchange rate expectations - July poll Exchange rate - July 2001 poll
Forint/euro
Chart II-6 Analysts’ exchange rate expectations, Reuters polls
0 0.5 1 1.5 2 2.5
2 March 16
March 29 March 13
Apr 27
Apr 11
Mai 25
Mai 8
June 22 June 6
July
%
Hungarian forint Polish zloty Czech koruna
Chart II-7 Weekly volatility of Central and East European national currency exchange rates*
* Volatility has been defined as the weekly standard deviation of daily exchange rate returns.
depth of the domestic foreign exchange market. The weakening of the exchange rate led to a minor withdrawal of funds in the lat- ter part of the month, along with an apparently weaker demand at government security auctions.
During the period between the widening of the band and the emerging market shock, exchange rate expectations moved in in line with spot exchange rates. According to the Reuters poll pub- lished on July 19th, macroanalysts’ average forecast for the ex- change rate is HUF 249.8 to the euro at end-August 2001, HUF 252 at end-December 2001 and HUF 249.4 in December 2002, with the individual forecasts showing significant variance.
Apparently, the shock in emerging countries early in July also de- creased analysts’ expectations of the forint’s future exchange rate (see Chart II-6 on Page 15).
Exchange rate volatility increased sharply as a consequence of the characteristics of the new regime and the uncertainties con- comitant with the period of transition. In the period since the band was widened, the forint appeared to be slightly more vola- tile than the Czech crown and significantly less volatile than the Polish zloty (see Chart II-7 on Page 15).
Despite the increased risk, the volume of trade reported by the two foreign exchange futures markets failed to increase, and in- deed there was even some evidence of a downward trend.
Banks’ foreign exchange derivative positions developed sym- metrically to those of their on-balance-sheet exposures in order to prevent their total FX positions from being short. It is not the two Hungarian FX futures markets that banks have used to ac- commodate their changing hedging requirement, since the vol- ume of exchange-traded futures appeared to be much more sta- ble than the banks’ total derivative transactions. Naturally, not only banks can trade on the exchanges, yet non-bank partici- pants seem to be less active in using the exchange-traded instru- ments for risk management (see Table II-1 and Charts II-8 and II-9).
Since the widening of the exchange rate band, the central bank has not intervened in the foreign exchange markets. How- ever, since25 June 2001, the central bank has been purchasing
16
NATIONALBANK OFHUNGARYII. Monetary policy, interest rates and the exchange rate
Table II-1Components of foreign exchange market demand and supply The + sign denotes forint demand and the – sign denotes negative forint supply
HUF billions 2001
January February March April May June
Central bank intervention* –4.1 –133.4 –40.4 –135.0 –28.0 0
Current account balance –62.8 –14.3 –12.9 –0.5 –34.5
Non-interest-rate-sensitive capital-flows 54.8 66.8 40.5 38.0 30.4
FDI inflow (private sector) 42.9 67.0 32.8 34.2 28.3
Equities 11.9 –0.2 7.7 3.8 2.1
Interest rate sensitive capital flows 20.9 51.4 –10.8 54.5 –8.1
Change in non-residents’ holding of government securities –9.2 69.8 29.4 66.2 99.7 29.9
Short-term 6.9 5.4 –14.4 28.5 –10.1 –7.2
Long-term –16.2 64.4 43.8 37.7 109.8 37.1
Non-residents’ forint deposits 2.1 2.6 –12.0 19.8 41.5 –25.2
Non-residents, total –7.1 72.4 17.4 86.0 141.2 4.7
Credit institutions (change in on-balance-sheet open position) 37.0 31.3 –3.0 15.2 –107.7 79.7
Corporate sector 3.9 –51.8 –31.0 –46.2 –37.8
1 Change in net internal foreign currency lending 9.4 –44.5 9.0 21.9 –9.1
2 Change in non-residents’ foreign currency lending –5.5 –7.3 –40.1 –68.1 –28.7
Household sector –12.9 –0.5 5.7 –0.6 –3.7
General government demand for foreign currency –2.1
Other –8.8 29.5 23.6 43.0 40.2
*The entry “Central bank intervention” does not include foreign exchange market purchases associated with the public sector’s foreign exchange debt by the National Bank, acting as an agent of general government.
These purchases, made in equal amounts on a daily basis since 25 June 2001, are presented with the entry on “General government demand for foreign currency”.
0 200 400 600 800 1000
01.00 03.00 05.00 07.00 09.00 11.00 01.01 03.01 05.01 07.01
HUFbillions
1.5 1.6 1.7 1.8 1.9 2.0 2.1 2.2 2.3 2.4 2.5
year
Volume Average maturity (right-hand scale) Chart II-8 Volume and average maturity of non-residents’ government security holdings
-200-150 -100100150-50500
01.03.01 19.03.01 02.04.01 17.04.01 30.04.01 15.05.01 29.05.01 13.06.01 27.06.01
Openpos s s
itions(HUF billion)
-200-150 -100100150-50500
HUFbillion
Open Euro (DEM) and USD contracts outstanding on futures exchanges (Bn HUF) (5 days moving average)
Total open position (5-day moving average) Off balance sheet position (5-day moving average) On balance sheet position (5-day moving average) Chart II-9 Commercial banks’ open FX positions
foreign currency on a daily basis on behalf of the government in order to service the interest on the country’s sovereign FX debt.
The Bank will buy foreign currency amounting to EUR 366 mil- lion for the year as a whole. In order to prevent market partici- pants from incorrectly interpreting these transactions as central bank signals as well as to minimise their effect on the exchange rate, the National Bank will announce in advance both the total required amount of foreign currency and the size of daily pur- chases. Furthermore, the transactions will take place in equal in- stalments and at the same time on each business day.
4 Long-term yields and inflation expectations
T
he previous Report traced the developments on the govern- ment securities markets until end-February. Since then, yields with maturities in excess of one year have fallen signifi- cantly, with the largest downward shift (80–100 basis points) oc- curring in the two-to-five-year section of the yield curve (see Chart II-10). As a result of this fall and a slight rise in five to ten-year euro yields, the forint-euro yield differential fell consid- erably. The shift in the implied forward curve indicates that the decrease in long-term forint yields was mainly due to changes in expected short rates one to four years ahead (see Chart II-11).Following their upward trend in January and February, yields on medium-to-long-term government securities continued to in- crease in March. At the beginning of April, in parallel with the global capital market risk indicators, forint implied forwards de- rived from the zero-coupon yield curve increased by 100–150 ba- sis points relative to corresponding euro forwards (see Chart II-12). In addition to a rise in the required interest premium, ad- verse changes in CPI inflation2were also likely to have contrib- uted to the increase in yields. The yield differential (150–200 ba- sis points) showed the most marked rise in the two-to-four-year segment, implying that the series of negative shocks had become incorporated in medium-to-long-term inflation expectations.
Since the beginning of April, apart from ten-year yields re- maining flat, shifts in the yield curve have been governed by a de- crease in the required risk premium.
The widening of the forint’s exchange rate band represented a landmark event in the development of inflation expectations.
The market welcomed this change in monetary policy. Even though the rate of inflation was worse than expected in May, ana- lysts’ average inflation forecast for December 2002 decreased slightly at the end of the month and by 0.7 percentage points in terms of the survey following the June announcement of the in- flation target. This brought the forecast rate down from 6.34%
prior to the band-widening to 5.51%, close to the upper edge of the tolerance band around the inflation target. According to the July 19th poll, carried out after the emerging market turmoil in early in July, analysts’ expectations of the forint’s exchange rate in the next one-and-a half years seem to have declined. Consis- tently, there was also a slight upward shift – to 5.75 % – in the rate of inflation expected for end-2002.
AUGUST2001 • QUARTERLYREPORT ONINFLATION
17
II. Monetary policy, interest rates and the exchange rate
7 7.5 8 8.59 9.5 10 10.511 11.512
0 1 2 3 4 5 6 7 8 9 10
Year
%
7 7.5 8 8.5 9 9.5 10 10.5 11 11.5 12
%
05.02.01 26.04.01 10.07.01
1.
2.
Chart II-10 Zero-coupon yield curves
%
6 6.57 7.58 8.59 9.510 10.511
0 1 2 3 4 5 6 7 8 9
Year
6 6.5 7 7.5 8 8.59 9.5 10 10.5 11
%
05.02.01 26.04.01 10.07.01 1
2
Chart II-11 One-year implied forward yield curves
0 1 2 3 4 5 6
01.01 02.01 03.01 04.01 05.01 06.01 07.01
%
0 1 2 3 4 5 6
%
One year ahead Two years ahead Five years ahead Nine years ahead
Band widening (4 May 2001) Chart II-12 One-year implied forint
and euro forward rates on different time horizons
8.5 9 9.5 10 10.5 11
01.00 03.00 05.00 07.00 09.00 11.00 01.01 03.01 05.01 07.01
%
8.5 9 9.5 10 10.5 11
%
Analysts' forecast CPI
Chart II-13 Reuters survey on monthly inflation expectations versus actual inflation rates
2 Since last June, macroanalysts have underestimated inflation typically by 0.2–0.3% (see Chart II-13) in each month except December and April.
After the band-widening, yields on government securities fell spectacularly. The widening of the band and the strengthening of the forint exerted downward pressure on domestic investors’
medium-term inflation expectations, while increasing foreign in- vestors’ medium-term expectations of forint appreciation. This was most apparent over the one-to-three-year horizon, with im- plied forward rate differentials falling by 100–120 basis points.
After the announcement of the inflation-targeting regime, yields with one-to-two-year maturities continued to fall. In addition to the effect of medium-term inflation and exchange rate expecta- tions, international investors’ steadily increasing “appetite for risk” is presumed to have contributed to the trend only to a smaller extent.
All in all, the widening of the band, the new exchange rate re- gime and the announcement of the central bank’s inflation tar- geting policy have had a positive impact on inflation expecta- tions, reflected in the decrease in medium-to-long term yields.
This led to a significant fall in the difference between forint and euro yields, with the ten-year interest rate differential exceeding the rate satisfying the Maastricht convergence criterion by merely 60-80 basis points. It is important to note that the drop in lon- ger-term yields was mainly due to a decline in medium-term for- ward rates (one to five years ahead), whereas forward rates for terms over five years did not fall significantly. This implies that the band-widening and the inflation targeting regime have mainly reduced medium-term expectations, causing market par- ticipants to expect a brisker pace of disinflation and interest rate convergence. There has been no considerable change in six-to- ten-year interest rate expectations, probably because the market had already priced in EMU entry and nominal convergence with on that horizon.
18
NATIONALBANK OFHUNGARYII. Monetary policy, interest rates and the exchange rate
T
his chapter analyses the factors bearing on the development of inflation in Hungary. In a small open economy, prices are governed to a significant extent by external demand, the terms of trade, foreign prices and change in nominal exchange rates, in addition to domestic supply and demand. Firstly we deal with in- ternal demand and external trade, secondly we analyse external inflation trends. Supply-side developments are examined via the labour market of the private sector.11 Demand
I
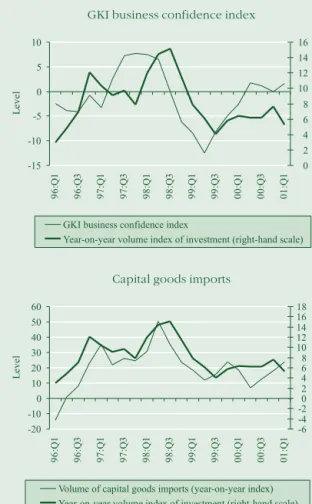
n 2001 Q1, GDP grew at an annual rate of 4.4%. The accelera- tion of household consumption expenditures was a major fac- tor contributing to this growth. In contrast to expectations, the volume of investment continued to rise at a moderate rate. Al- though the first quarter saw significant growth in exports, short-term trends point to a slowdown. Imports grew at a slower pace than exports, due to subdued investment growth and destocking, in addition to lower export expectations. During the first half of the year, general government’s demand effect was 0.4% of GDP.Over the forecast horizon, we do not expect a recurrence of last year’s deterioration in the terms of trade. In 2000, the deterio- ration in the terms of trade caused gross national disposable in- come (GNDI) to grow at a slower pace than GDP, which was also reflected in the trade balance. However, in 2001 and 2002, GNDI is not expected to hamper domestic absorption or worsen the trade balance in nominal terms (see Table III-1, III-2).
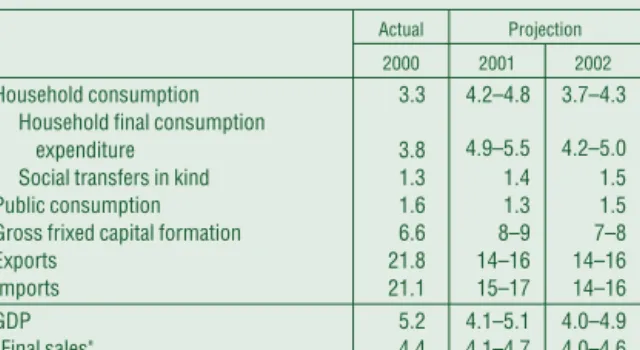
The National Bank forecasts that the economy will continue growing at a robust rate in 2001 and 2002. This is based on the projection that other effects, such as the fiscal demand shock this year and a better external cyclical environment next year, will offset the real impact of the forint’s appreciation. The Bank’s cen- tral projection falls in the middle of the ranges given in Table III-3, but in 2002, due to the appreciation of the forint, the out- come for GDP growth is more likely to fall within the lower half of the 4–4.9% range.
In 2001, both consumption and investment are projected to contribute to growth at a stronger rate, while the contribution of net exports becomes negative. In 2002, domestic absorption is expected to play a lesser role, while net exports put less down- ward pressure on economic growth than in the previous year. In
AUGUST2001 • QUARTERLYREPORT ONINFLATION
19
III. Determinants of inflation
Table III-1 Annual growth of GDP and its components Percentage changes on a year earlier
Per cent
2000 2001
Q1 Q2 Q3 Q4 Year Q1
Household final consumption
expenditure 3.7 3.8 3.7 4.0 3.8 5.4
Social transfers in kind 0.3 1.8 1.8 1.4 1.3 1.2 Household consumption 3.0 3.4 3.4 3.5 3.3 4.5
Public consumption 1.0 1.1 2.0 2.0 1.6 1.2
Gross fixed capital formation 7.7 6.2 2.9 9.1 6.6 5.3 Gross capital formation* 14.5 4.2 9.5 11.9 9.9 0.0 Domestic absorption, total 5.7 3.4 5.0 6.0 5.0 2.9
Exports 20.9 21.0 19.9 25.0 21.8 21.4
Imports 18.5 16.4 20.8 27.3 21.1 18.4
GDP 6.5 5.6 4.5 4.2 5.2 4.4
* Includes the statistical discrepancy, represented by the difference between the results of calculations for production and use. The value 0.0% for the increase in gross capital forma- tion is the result of rounding: the precise figure is 0.03%.
Table III-2 Contribution to GDP growth by components of use Percentage changes on a year earlier
Per cent
2000 2001
Q1 Q2 Q3 Q4 Year Q1
Household final consumption
expenditure 1.9 1.9 1.9 2.0 1.9 2.7
Social transfers in kind 0.1 0.2 0.2 0.1 0.2 0.2 Household consumption 2.0 2.1 2.1 2.1 2.1 2.9
Public consumption 0.1 0.1 0.2 0.2 0.2 0.1
Gross fixed capital formation 1.1 1.4 0.7 3.0 1.6 0.8 Gross capital formation* 3.8 1.3 2.7 3.7 2.9 0.0 Domestic absorption, total 5.9 3.5 5.0 6.0 5.2 3.0
Export 11.1 11.2 11.0 14.4 12.0 12.9
Import 10.5 9.1 11.5 16.2 12.0 11.5
Net exports 0.6 2.1 –0.5 –1.8 0.0 1.4
GDP 6.5 5.6 4.5 4.2 5.2 4.4
*Includes the statistical discrepancy, represented by the difference between the results of calculations for production and use.
1The employment and wage policies of the public sector will be viewed as part of fiscal policy, i.e. as factors contributing to aggregate demand.