QUARTERLY REPORT
ON INFLATION
February
2002
Prepared by the Economics Department of the National Bank of Hungary István Hamecz, Managing Director
Issued by the Department for General Services and Procurement of the National Bank of Hungary
Responsible for publishing: Botond Bercsényi, Head of Department Prepared for publication by the Publications Group of the Department
for General Services and Procurement 1850 Budapest, V., Szabadság tér 8–9.
Mailing: Miklós Molnár Phone: 36-1-312-4484
Fax: 36-1-302-3714 Internet: http: //www.mnb.hu
ISSN 1419-2926 ISBN 9639 383 244
The new Act on the National Bank of Hungary, enacted by Parliament and effective as of 13 July 2001, defines the primary objective of the Bank as the achievement and maintenance of price stability. Using an inflation targeting system, the Bank seeks to attain price stability by im- plementing a gradual, but firm disinflation programme over the course of several years. In order to provide the public with a clear insight into the operation of central bank policies and enhance transparency, the Bank publishes the “Quarterly Report on Inflation”, covering recent and prospective developments in inflation and evaluating the macro- economic developments determining inflation. This publication sum- marises the projections and deliberations that underlie the decisions of the Monetary Council.
The Monetary Council, the supreme decision making body of the Na- tional Bank of Hungary, carries out a comprehensive review of the ex- pected development of inflation once every three months, in order to es- tablish the monetary conditions that are consistent with achieving the inflation target. The first section of the publication presents the Mone- tary Council’s position and the grounds for its decisions released on 5 of Nov. This is followed by a projection prepared by the analysts at the Bank’s Economics Department on the outlook for inflation and the un- derlying principal macroeconomic developments. The expected path and uncertainty of the exogenous factors used in the projection reflect the opinion of the Monetary Council.
² ² ²
STATEMENT OF THE MONETARY COUNCIL . . . 9
SUMMARY OF FORECASTS . . . 11
I INFLATION – THE NBH’S PROJECTION AND LATEST DEVELOPMENTS . . . 12
II MONETARY POLICY, INTEREST RATES AND THE EXCHANGE RATE. . . 16
1 International economic environment and risk perception . . . 16
2 Short-term interest rates . . . 17
3 Capital flows and the exchange rate. . . 18
4 Yield movements . . . 20
III DETERMINANTS OF INFLATION . . . 22
1 Demand . . . 22
1.1 External demand and net exports . . . 25
1.2 Household consumption . . . 27
1.3 Investment . . . 29
1.4 The fiscal stance . . . 30
2 Supply side factors . . . 32
2.1 Business cycle developments on the supply side. . . 32
2.2 The labour market . . . 33
3 Imported inflation . . . 39
4 Effect of regulation and extraordinary factors . . . 40
IV FORECAST OF THE CONSUMER PRICE INDEX AND RISK ASSESSMENT . . . 43
1 Assumption of the central projection . . . 45
2 Details of the central projection. . . 46
3 Uncertainty in the central projection . . . 48
4 Inflation expectations . . . 49
SPECIAL TOPICS . . . 50
1 The effect of the revision of GDP data on the Banks’s forecasts . . . 50
2 Method for projecting unprocessed food prices. . . 52
3 What do we know about inventories in Hungary? . . . 53
Contents
1998
Changes in the central bank’s monetary instruments . . . 23
Wage inflation – the rise in average wages . . . 62
Wage increases and inflation . . . 63
Impact of international financial crises on Hungary . . . 85
March 1999 The effect of derivative FX markets and portfolio reallocation of commercial banks on the demand for Forints . . . 20
What lies behind the recent rise in the claimant count unemployment figure? . . . 34
June 1999 New classification for the analysis of the consumer price index . . . 14
Price increase in telephone services . . . 18
Forecasting output inventory investment . . . 32
Correction for the effect of deferred public sector 13thmonth payments . . . 39
What explains the difference between trade balances based on customs and balance of payments statistics? . . . 44
September 1999 Indicators reflecting the trend of inflation . . . 14
The consumer price index: a measure of the cost of living or the inflationary process? . . . 18
Development in transaction money demand in the South European countries . . . 28
Why are quarterly data used for the assessment of foreign trade? . . . 37
The impact of demographic processes on labour market indicators . . . 41
What explains the surprising expansion in employment? . . . 42
Do we interpret wage inflation properly? . . . 45
December 1999 Core inflation: Comparison of indicators computed by the National Bank of Hungary and the Central Statistical Office . . . 18
Owner occupied housing: service or industrial product? . . . 20
Activity of commercial banks in the foreign exchange futures market . . . 26
March 2000 The effect of the base period price level on twelve-month price indices – the case of petrol prices . . . 19
The government’s anti-inflationary programme in the light of the January CPI data and prospective price measures over 2000 taken within the regulated category . . . 21
The impact of the currency basket swap on the competitiveness of domestic producers . . . 51
June 2000 How is inflation convergence towards the euro area measured? . . . 14
Inflation convergence towards the euro area by product categories . . . 15
Boxes and Annexes in the Quarterly Report
on Inflation
Changes in the central bank’s monetary instruments . . . 23
Transactions by the banking system in the foreign exchange markets in 2000 Q2 . . . 26
Coincidence indicator of the external cyclical position . . . 39
How is the wage inflation index of the NBH calculated? . . . 47
September 2000 Background of calculating monetary conditions . . . 20
Foreign exchange market activities of the banking system in 2000 Q3 . . . 25
December 2000 Changes in the classification methodology of industrial goods and market-priced services . . . 25
Different methods for calculating the real rate of interest . . . 27
Changes in central bank instruments . . . 28
Foreign exchange market activities of the banking system in the period of September to November . . . 31
Hours worked in Hungarian manufacturing in an international comparison . . . 53
Composition effect within the manufacturing price-based real exchange rate . . . 57
March 2001 Foreign exchange market activities of the banking system from December 2000 to February 2001 . . . 30
Estimating effective labour reserves . . . 50
August 2001 1 New system of monetary policy . . . 35
2 Forecasting methodology . . . 37
3 Inflationary effect of exchange rate changes . . . 38
November 2001 1 The effects of fiscal policy on Hungary’s economic growth and external balance in 2001–02 . . . 39
2 Estimating the permanent exchange rate of forint in the May–August period . . . 41
3 How do we prepare the Quarterly Report on Inflation? . . . 41
February 2002 1 The effect of the revision of GDP data on the Bank’s forecasts. . . 50
2 Method for projecting unprocessed food prices . . . 52
3 What do we know about inventories in Hungary? . . . 53
Boxes and Annexes in the Quarterly Report on Inflation
A t its meeting of 18 February 2002, the Monetary Council discussed the latest issue of the Quarterly Report on Inflation and approved its publication.
Success in meeting the De- cember 2001 target
Members of the Monetary Council view 2001 as a successful year in terms of the path of inflation. In the two years since mid-1999, prior to changing the mone- tary policy regime, prices had increased at an annual rate of around 10%. In the wake of widening the forint’s exchange rate band and adopting an infla- tion-targeting system, the rate of inflation started on a downward trend, and at 6.8% in December 2001 it was lower than the target rate of 7%. The 4 percent- age-point drop in inflation achieved during a period of six months was partly due to factors outside the control of monetary policy, in particular the fall in the price of unprocessed foodstuffs and the world price for crude oil. At the same time, measures constructed by eliminating one-off effects also clearly reflected the reduction in inflation. The new core inflation index published by the Cen- tral Statistical Office fell from 10.5% in June 2001 to 8.1% in December 2001.
Slow adjustments on the cost side
In the judgement of the Council, recent experience suggests that economic agents have been relatively slow in adapting to the designated disinflation path.
Changes in nominal wages have not been completely consistent with the decline in inflation. This poses the risk that firms will not be able to maintain their com- petitiveness over the long run unless they take account of the prospective down- ward trend in sales prices when projecting nominal costs.
Changes in the exchange rate and interest rates in the period since the pre- vious report
The period since the publication of the previous inflation report has seen a tightening in monetary con- ditions. There has been an upsurge in global investors’
demand for forint invest- ments, resulting in a signifi- cant drop in the risk pre- mium. This enabled the Council to reduce the cen- tral bank’s key rates in sev- eral steps, consistent with the fall in inflation expecta- tions. Long-term yields kept pace with the reduction in the key rates, reflecting the rising credibility of the announced disinflation programme in the eyes of market participants. Despite the lower yields, the ex- change rate of the forint
Statement of the Monetary Council
0 1 2 3 4 5 6 7 8 9 10 11
Percent
0 1 2 3 4 5 6 7 8 9 10 11
Percent 01:Q1 01:Q2 01:Q3 01:Q4 02:Q1 02:Q2 02:Q3 02:Q4 03:Q1 03:Q2 03:Q3 03:Q4
Inflation projection based on increasing oil prices Year-on-year growth rate
* The fan chart shows the probability distribution of the outcomes around the central projection. The central band with the darkest shad- ing includes the central projection. The entire coloured area covers 90%
of all probabilities. Outside the central projection (centred around the mode), the bands represent 15% probability each. The uncertainty in- tervals have been estimated relying on the Bank’s historic forecast er- rors and the uncertainties perceived by the Monetary Council regarding the current forecast. The two white dots represent the inflation targets (7%, 4.5% and 3,5%); while the straight lines mark the ±1% tolerance in- tervals on either side of the target rates. The forecast is based on the as- sumption of increasing Brent oil prices in 2002 (to USD 24 / barrel by the end of the year) followed by constant oil price at that level in 2003.
against the euro has strengthened by roughly 4% over the past quarter, simulta- neously with a drop in exchange rate volatility compared with the summer and autumn of 2001, a period plagued by capital market crises.
Disinflation receives sup- port from the macroeco- nomic environment
Corporate managers and analysts are expecting the world economy to re-
cover from its current downturn in the second half of 2002. This means that the Hungarian economy is likely to grow at below its potential growth rate, at least for a couple of months of the year. In the first half, the less favourable world economic environment may dampen firms’ investment demand. Household consumption may continue to expand at a robust pace, which, in turn, may slow the further reduction in inflation primarily in the services sector. In the Bank’s projection, the expansionary effect of fiscal policy on demand will be more moderate in 2002 than in the previous year.
Changes in the inflation forecast
There has been a tightening of monetary conditions in the past quarter, as- sisting the faster reduction in inflation. However, this effect may be offset by the Hungarian economy adjusting to the inflation target at a slower pace than the Bank expected earlier. Based on recent experience, the Monetary Council has decided to take as a starting point a slower exchange rate pass-through in the future, more consistent with economic agents’ behaviour so far.
Rising oil prices may be another factor exerting upward pressure on infla- tion. In the Council’s judgement, higher oil prices than the current USD20 per barrel cannot be ruled out in the coming 18 months, as the world economy gathers momentum. Consequently, the Council’s inflation projection assumes the likelihood of oil prices returning to around USD24, taking into account in- ternational forecasts.
The central inflation pro- jection continues to be in line with the disinflation target
Assuming unchanged oil prices, inflation is expected to proceed along the path outlined in the previous Report. The central projection falls within the lower range of the target band at every horizon. The more conservative esti- mate, based on rising oil prices, depicts a somewhat less favourable picture. A 4-dollar increase in oil prices will cause inflation to be higher by an additional 0.6 percentage points. The impact on the inflation path depends on the timing of such an increase in prices. The forecast horizon does not include a period when the assumed price increase could push the central projection outside the target range. In the Council’s view, the uncertainties arising from the potential rise in oil prices currently do not call for a pre-emptive tightening of monetary conditions, although the resulting inflation risks require constant monitoring.
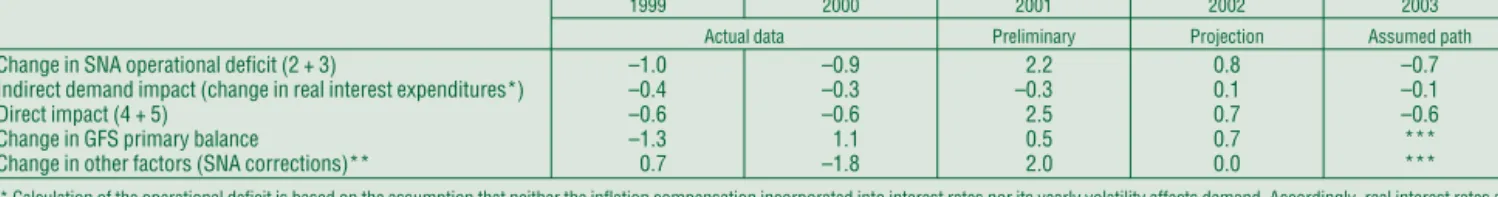
Developments in regulated prices and excise duties are one of the most important risk factors influencing inflation in 2003. The underlying assumption of the projection is that in 2003 regulated prices will rise at the yearly average inflation rate defined by the disinflation target.
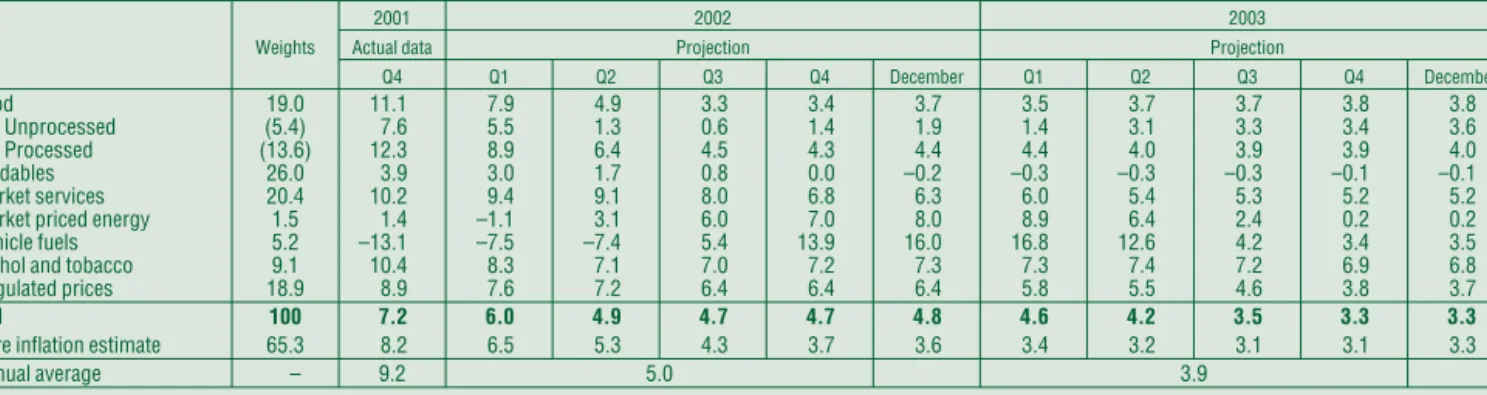
In view of the above considerations, the inflation projection based on the conditions viewed as having the greatest likelihood by the Monetary Council is as follows: following a rapid decline in the first half of 2002, inflation will be vir- tually stagnant in the second half due to the base effect and the presumed rise in oil prices. The average rate of inflation is expected to be 5.0% in 2002, with the Council expecting the December 2002/December 2001 consumer price index to be 4.8%.
Disinflation is expected to proceed slowly in 2003, at a yearly average rate of 3.9%, with the Council forecasting the December 2003/December 2002 con- sumer price index to be around 3.3%.
Budapest, February 18, 2002
Monetary Council of the National Bank of Hungary
Statement of the Monetary Council
Statement of the Monetary Council
Summary of forecasts
(Annual change, per cent; if not noted otherwise)
2001 2002 2003
Estimate Forecast
Consumer prices
CPI (December) 6.8 4.8 3.3
CPI (annual average) 9.2 5.0 3.9
GDP 3.8–3.9 3.0–4.0 3.5–4.5
of which: Domestic absorption 2.0–2.3 3.5–4.5 3.7–5.2
Household consumption 3.8–3.9 3.5–4.9 2.5–4.5
Gross fixed capital formation 2.5–3.0 (–1.0)–(3.0) 3.0–6.0
Exports 9.0–10.0 3.0–8.0 6.0–12.0
Imports 7.0–8.0 3.5–9.5 7.0–13.5
Current account balance
as % of GDP –2.2 (–2.7)–(–1.8) (–3.5)–(–2.4)
EUR billions –1.2 (–1.8)–(–1.2) (–2.5)–(–1.7)
General government
Impact on demand (% of GDP) 2.5 0.7 –0.6
Labnour market (private sector only)
Wage inflation 13.0 8.0–10.5 5.0–8.0
Employment 0.6 –1.0–(0.5) 0.5–1.5
I
n the second half of 2001, consumer price inflation declined at a rapid rate. The twelve-month rate of inflation dropped to 6.8% in December, in line with the monetary policy target of 7±1% set for December 2001. In contrast with the November Inflation Report’s projection of 7.5% inflation for December, this faster-than-expected disinflation was primarily due to the drop in world oil prices and slower inflation in unprocessed food prices.Accordingly, factors with high price volatility which cannot be directly influenced by monetary policy played a key role in this rapid decline in inflation. The Bank’s estimates suggest that the appreciation of the forint experienced since May resulted in the price index being roughly 0.8 percentage points lower in 2001 Q4 than it would have been, had the former exchange rate sys- tem remained in place. The estimated effect of the monetary re- gime change is however only a short-term effect, while the full disinflationary effect is expected only in the longer run.
Since forecasts of economic variables in theInflation Report are generally prepared on a quarterly basis, thisReportdoes not analyse the latest 6.6% consumer inflation rate of January 2002 in detail. It is however important to note that the new figure shows a somewhat more modest disinflation, as compared to the devel- opments in the fourth quarter of 2001. This can primarily be ex- plained by the temporary inflationary effects of some “noisy”
components in the consumer basket (seasonal unprocessed foodstuff and alcoholic drinks). Nevertheless, inflation in market services was lower than expected, while the core inflation index and the inflation measured among components on which mone- tary policy can have direct influence also show the continuation of the disinflation.
The annual rate of increase in the price of tradables and market services1 – accounting for about half of the consumer basket – continued to moderate (see Chart I-1). In contrast with the first three quarters of 2001, service price disinflation lost mo- mentum during the fourth quarter, causing the inflation differen- tial to increase relative to tradables prices (see Chart I-2). In the Bank’s judgement, the widening of the differential was due to the strong growth in consumer demand and the service sector wage inflation stagnating at a high level in the fourth quarter of the year.2
In addition to the disinflation in tradables and market services prices, the fourth-quarter decline in the overall consumer price
I Inflation – the NBH’s projection and latest developments
0 2 4 6 8 10 12 14 16
99:Q1 99:Q2 99:Q3 99:Q4 00:Q1 00:Q2 00:Q3 00:Q4 01:Q1 01:Q2 01:Q3 01:Q4
Percent
0 2 4 6 8 10 12 14 16
Percent
Non-tradeds Tradeds
Chart I-1 Market services and tradables price inflation
Percentage changes on a year earlier
1The NBH’s own CPI classification, which is different from that of the Central Statistical Office and similar to that of the European Central Bank Any inflation data in the Report is presented according to this classification.
2For a discussion of the wage-push inflation experienced in the service sector, see the relevant section of Chapter III/2.
index (CPI) was primarily due to two factors, namely the lower rate of food price increases and the plunge in vehicle fuel prices induced by lower world oil prices. In respect of food prices, which account for nearly 20% of the consumer basket, the factors behind the disinflation seen in 2001 H2 included the high base values of a year earlier and actual declines in unprocessed food- stuff prices, which, indirectly, also slowed down the rate at which processed food prices increased (see Chart I-3). The main force behind the fourth-quarter disinflation in unprocessed foodstuff prices was a plunge in the price of pork, which carries the largest weight in the food category.
Monetary policy has the greatest influence on prices that strongly correlate with the exchange rate or which are sensitive to aggregate demand. As the evolution of the CPI in 2001 was shaped to a great extent by factors that are not affected by monetary pol- icy, the Bank’s analysts have constructed a special category com- prised of goods influentable by monetary policy. This category of
“influentable” goods comprises tradables, market services and a specific component of vehicle fuel prices that is dependant on the forint/euro exchange rate (see Chart I-4).3The chart clearly illus- trates that the higher-than-expected fall in the CPI during the sec- ond half of the year can be broadly attributed to disinflation in prices that are not directly affected by monetary control. Similarly, the changes incore inflation4displayed in the chart suggest that the disinflation for the aggregate, constructed by eliminating high-volatility components (such as unprocessed foodstuffs, petrol, market energy and regulated prices) was smaller than the drop in inflation experienced by the overall consumer basket.
As noted above, factors not affected by the central bank had a marked influence on the path of inflation in 2001. In order to highlight the impact of changes in monetary conditions on infla- tion in the wake of the exchange rate band widening, a simula- tion has been carried out. The Bank estimated the probable de- velopment of the inflation path, if the narrow-band crawling peg system had remained in place. Under the crawling peg system, it is not only the exchange rate path that would have differed: the simulation also takes account of the fact that the parameter for the exchange rate pass-through was higher under the nar- row-band regime (an annual rate of almost 100%). The values used for other variables (such as oil prices, dollar/euro rate, un- processed food prices, real economic variables) were those ob- served during the course of the year.
The results of the simulation, shown in Table I-1, indicate that had the former exchange rate regime remained, CPI inflation in 2001 Q4 would have declined to 8%, instead of its actual rate of 7.2%. Accordingly, the rate of disinflation generated by monetary policy could be stated as being 0.8 percentage points, and only one-fourth of the disinflation recorded in the second half of 2001 can be viewed as falling under the direct influence of monetary policy. Nevertheless, over the longer term, monetary policy is ex- pected to make a much greater impact.
I Inflation – the NBH’s projection and latest developments
5 6 7 8 9 10 11
00:Q1 00:Q2 00:Q3 00:Q4 01:Q1 01:Q2 01:Q3 01:Q4
Percent
5 6 7 8 9 10 11
Percent
Headline CPI Core inflation
"Influentable" inflation
Chart I-4CPI, core inflation and “influentable”
inflation
Percentage changes on a year earlier 100
120 140 160 180 200 220 240
95:Q1 95:Q3 96:Q1 96:Q3 97:Q1 97:Q3 98:Q1 98:Q3 99:Q1 99:Q3 00:Q1 00:Q3 01:Q1 01:Q3
1995Q1=100
100 120 140 160 180 200 220 240
Unprocessed food Processed food Chart I-3Inflation in processed and unprocessed food prices*
*1995 Q1 = 100, seasonally adjusted price levels.
Table I-1Estimate for the rate of inflation in 2001 Q4 under the narrowband crawling peg regime*
Percentage changes on a year earlier
Actual data Simulation Difference
2001 Q4 Percentage points
Tradables 3.9 5.1 1.2
Market services 10.2 11.0 0.8
Vehicle fuel –13.1 –10.6 2.4
CPI 7.2 8.0 0.8
* The monthly rates of devaluation used in the estimation are 0.2% for May to September and 0.1% for October to December 2001.
3 In principle processed food prices are also influenced by monetary policy via its effect on aggregate demand and imported inflation. Food prices, how- ever, are very much shaped by exogenous supply side shocks which are hard to detect. So the “influentable” price index presented in this Report excludes all food prices and accounts for 52.1% of the consumer basket.
4The new core inflation index published by the Central Statistical Office in 2002.
0 1 2 3 4 5 6 7 8 9
99:Q1 99:Q2 99:Q3 99:Q4 00:Q1 00:Q2 00:Q3 00:Q4 01:Q1 01:Q2 01:Q3 01:Q4 Percentagepoints
Nontraded/traded inflation differential Chart I-2Differential between market services and tradables price inflation
Percentage changes on a year earlier
1 Inflation projection of the previous quarter versus the actual rate
T
he Q4 inflation projection published in the November 2001 issue of the Inflation Report exceeded the actual rate by 0.5 percentage points (see Table I-2). This overestimation was due both to stronger-than-expected disinflation in food and in vehicle fuel prices. On the other hand, the projection underesti- mated inflation of market service prices.The difference between the November projection and the ac- tual rates can be attributed to two factors. First, the assumptions for the exogenous developments determining inflation did not correspond to actual developments. Second, the forecast model failed to properly capture the economic mechanisms underlying changes in consumer prices.
In contrast with the assumptions of the November projection, the exogenous factors which determine the inflation forecast tended towards disinflation during Q4, with the exception of the dollar/euro exchange rate imported tradables prices and regu- lated prices (see Table I-3). In respect of fuel prices, which ac- count for 50 per cent of the discrepancy between the forecast and the actual data, the explanation lies in the special assumptions made regarding the exogenous variables. In projecting the world price for oil, which has the greatest impact on vehicle fuel prices, the technical assumption – applied pursuant to a rule formulated by the Monetary Council – is that prices remain at the average level of the last full month prior to the projection. The plunge in the price of Brent oil relative to this technical assumption and the strengthening of the forint/euro exchange rate account for the difference between the projection and actual vehicle fuel prices.
The difference between the inflation projection for food prices and the actual rate was due to difficulties in forecasting unprocessed foodprices. Agricultural producer prices governing unprocessed, and, in an indirect way, processed foodstuff prices are highly volatile and relevant projections are surrounded by a great deal of uncertainty. Hence, the November projection did not view the Q3 disinflation in food prices as a lasting trend and assumed that inflation would decline less slowly during the fourth quarter. The main reason that developments in the fourth quarter ran contrary to the assumption was a surprise fall in the price of pork, with a large weight in the unprocessed food cate- gory.
In contrast with the November assumption, theforint/euro ex- change rate, which has a crucial impact on CPI inflation (even though this impact is mainly felt over the longer term), also ex- erted downward pressure on price increases. In accordance with the rule which assumes that the exchange rate remains constant at the average rate measured during the last full month prior to the date of the projection, the assumption was 255.9 forints per euro. However, the average exchange rate in the fourth quarter was 1.7 per cent higher. A strengthening exchange rate of the fo- rint exerts direct and indirect disinflationary pressure on the price of tradables and other imported goods (including oil and a number of foodstuffs) and prices of market services, respec- tively. Despite the exchange rate being stronger than the Novem- ber assumption, tradables price inflation projected for the fourth quarter did in fact correspond to actual rates. This was partly be-
I Inflation – the NBH’s projection and latest developments
Table I-2Central inflation projection and actual data in 2001 Q4
Category Weight
Actual data
November projection
Differ- ence* Effect of
difference on CPI Percentage changes
on a year earlier
Food 19.0 11.1 12.7 –1.6 –0.3
Unprocessed 5.3 7.6 10.5 –2.8 –0.2
Processed 13.7 12.3 13.5 –1.1 –0.2
Tradables 26.8 3.9 4.0 –0.1 0.0
Market services 20.3 10.2 9.9 0.3 0.1
Market-priced
household energy 1.3 1.4 –0.7 2.1 0.0
Vehicle fuel 5.0 –13.1 –6.9 –6.2 –0.3
Alcohol and tobacco 9.1 10.4 10.6 –0.2 0.0
Regulated prices 18.6 8.9 8.7 0.2 0.0
CPI 100.0 7.2 7.7 –0.5 –0.5
* Difference = actual data minus projection; in percentage points. Rounded values.
Table I-3Assumption of the November forecast versus actual data in 2001 Q4
Assumption November
forecast 2001 Q4
Forint/euro exchange rate (HUF) 255.9 251.4
Brent crude oil (USD/barrel) 25.5 19.3
Dollar/euro exchange rate (cents) 91.0 90.0
Imported tradables inflation* 0.5 1.7
Unprocessed food price inflation** 10.5 7.6
Including: prices for pork*** 0.0 –4.7
Regulated prices** 8.7 8.9
* Tradables price inflation in Germany, annualised quarter-on-quarter index.
** Annual price index.
*** Average of monthly price increases.
cause the full impact of a strengthening (the exchange rate pass-through) on domestic prices can only unfold gradually, over a longer period of time, and partly because imported tradables inflationappeared to exert stronger-than-expected in- flationary pressure in the reviewed period (see Table I-3).
As the August projection also underestimated inflation in tradables and market services prices, and the November pro- jection did not overestimate tradables price inflation even in the face of a weaker exchange rate assumption, the Bank staff felt that it was desirable to review the forecasting model used for these two categories. Under the model, tradables prices are primarily influenced by the forint/euro exchange rate and im- ported tradables inflation, while other factors (such as household demand and wage costs) are of lesser importance. The results of the review suggest that even if the Bank had been aware of the actual development of exogenous factors, the inflation of tradables and market services prices would have been systemati- cally underestimated in the second half of 2001. This confirms the assumption that the strengthening of the exchange rate does not cause tradables price inflation to decline at the rate previ- ously assumed, in other words, the exchange rate pass-through is of a smaller magnitude than previously thought. Conse- quently, the new projection estimates the size of the exchange rate pass-through at a lower rate than in the previous two infla- tion reports. For more on this revision, see Chapter IV.
In terms of the Bank’s model, over the long term, the inflation ofmarket service pricesis determined via the Balassa-Samuelson effect, i.e. the differential relative to tradables price inflation is primarily due to the productivity gap between the two sectors. In addition, market service prices are also influenced by domestic consumer demand over the long term, while, the effects of other factors, such as wages, food and energy prices, are also taken into consideration over the short term. Although the underesti- mation of market service prices is largely explained by the under- estimation of tradables price inflation, the inflation differential between services and tradables was also underestimated. The Bank feels that this underestimation of the inflation differential can be attributed to the rapid rise in domestic consumer demand and the higher than expected end-year inflation in service sector wages. Accordingly, the Bank perceives no need to revise the projection methodology used in the treatment of market ser- vices.
I Inflation – the NBH’s projection and latest developments
1 International economic environment and risk perception
A
lthough widening the exchange rate band has enlarged the central bank’s leeway to influence monetary conditions, the timing of interest rate moves and their impact on the forint/euro exchange rate are affected, to a significant degree, by the interest rate changes carried out by the European Central Bank (ECB) and by fluctuations in the risk premium on forint investments.Changes in yields within the euro area, which are of vital im- portance to Hungarian monetary policy, have been determined by the ECB’s easing of monetary policy. With sluggish growth and falling oil prices having significantly eased inflationary pres- sures, the European central bank made another 50-basis-point cut in its key rates on 8 November. In 2001, the key rate was re- duced by 150 basis points altogether, from 4.75% to 3.25%.
Despite an expected decline in inflation and deepening reces- sion in Germany and Italy, market participants do not appear to expect another rate cut in the first quarter of 2002.
The risk perception of Hungarian investments is governed by changes in international investors’ appetite for risk. In addition to country-specific factors relating solely to Hungary, risk percep- tion is also influenced by investors’ appetite for risk in the region (Central and Eastern Europe), in emerging markets and in devel- oped countries.
The already high uncertainty due to the difficulty in predicting the evolution of the business cycle in developed countries fur- ther intensified in the aftermath of the terrorist attack against the USA on 11 September. However, rapid military success in Af- ghanistan helped to restore market confidence to a certain de- gree, and by late November, in both the USA and Western Europe indicators of investor appetite for risk had returned to levels seen before the terrorist attacks (see Chart II-1). Nevertheless, there was no considerable improvement in the American markets sub- sequently, with great uncertainty remaining about the likely date of a recovery starting in the American economy.
Just as that of the developed world, the risk perception of emerging markets did not take long (only until end-No- vember) to recover from the spectacular loss of confidence suf- fered in the immediate aftermath of the terrorist attacks. How- ever, subsequently there was no improvement, with the EMBI spread – which reflects the risk premia on emerging country sov- ereign debt – even reflecting some renewed worsening in De- cember (see Chart II-2). This renewed loss of confidence was probably associated with the escalation of the economic and po-
II Monetary policy, interest rates and the exchange rate
500 600 700 800 900 1000 1100 1200
Basispoint Percent
01.00 04.00 07.00 10.00 01.01 04.01 07.01 10.01 01.02
10 15 20 25 30 35 40 45 50 55
Spread of risky U.S. corporate bonds (S&P U.S. Industrial Speculative Grade Credit Index)
S&P100 index option implied volatility (VIX; right-hand scale) Chart II-1 Global risk indicators
7 8 9 10 11 12
Percent Basispoint
01.05.00 04.14.00 07.23.00 10.31.00 02.08.01 05.19.01 08.27.01 12.05.01
500 550 600 650 700 750 800 850
3-year HUF yield EMBI spread (right-hand scale) Chart II-2 EMBI spread and the three-year forint yield*
* The weighting applied in the construction of the index was changed by J.P. Mor- gan, the constructor of EMBI, as of 5 December 2001. The weight assigned to Argen- tina was reduced considerably, simultaneously with an increase in the weights for several other countries. To ensure comparability, the chart shows the historical val-
ues recalculated using the new weights.
litical crisis in Argentina. One must add however, that for the time being, the size of the deterioration does not suggest serious con- tagion effects. It seems that after the Argentine default, interna- tional investors made a distinction between individual emerging countries. This is in contrast to previous practice, notably the contagion phenomena following the South-East Asian and Russian crises in the late 1990s. Central and Eastern Europe, as an emerging region in particular, experienced no negative effects following the Argentine default.
With respect to the regional risk perception of Central and Eastern Europe, the only available non-Hungarian indicator is the average spread on Polish USD-denominated sovereign bonds. These spreads show that just as in the developed coun- tries, the effect of the loss of confidence in the wake of the terror- ist attacks had disappeared in Poland by late November, with no considerable improvement thereafter.
The interest premium on Hungarian deutschmark bonds, Hungary’s country-specific indicator of risk, moved broadly in conjunction with the risk indicators for developed countries until late November (see Chart II-3). However, the subsequent period saw the emergence of a number of country-specific effects, which caused the spreads to narrow during the second half of December. By mid-January 2002, this index was back at the low level seen at mid-2001, prior to the flare-up of the Argentine and Turkish economic problems. Meanwhile long-term forint yields fell to a much greater extent, to far below their level at mid-2001.
This was predominantly due to the better risk assessment of Cen- tral and Eastern Europe, and particularly of Hungary. The rising confidence in Hungarian investments has been predominantly due to country-specific factors, such as the better-than-expected current account1and inflation performance in the last quarter of 2001.
2 Short-term interest rates
T
he central bank’s interest rate changes influence monetary conditions partly in a direct and partly in an indirect manner, via the exchange rate. In the judgement of the central bank, ex- change rate expectations exert the most direct influence on the path of inflation. Consequently, adjustments to risk premium fluctuations, i.e. smoothing the exchange rate, play a key role in deciding on the interest rate policy to be pursued.The risk perception of forint investments has improved considerably since the publication of the last Inflation Report.
This has enabled the Bank to make several cuts in the base rate, in line with the lower inflation expectations. From October 2001 to end-February 2002, the base rate was reduced by a total of 225 basis points, from 10.75% to 8.5% (see Chart II-4). Despite lower forint rates, the exchange rate volatility typical in the past has also subsided, with the rate strengthening steadily since No- vember.
The forward yields derived from the yield curve and the Reuters’ poll provide a good source of information on market participants’ expectations of changes in the Hungarian central bank rate. The implied forward yields suggest that at end-
II Monetary policy, interest rates and the exchange rate
5 6 7 8 9 10 11 12
Percent Percent
01.05.03 01.05.17 01.05.31 01.06.14 01.06.28 01.07.12 01.07.26 01.08.09 01.08.23 01.09.06 01.09.20 01.10.04 01.10.18 01.11.01 01.11.15 01.11.29 01.12.13 01.12.27 02.01.10 02.01.24 2 2.5 3 3.5 4 4.5 5 5.5 6 6.5 7
3-month HUF yield NBH base rate 3-month EUR yield
(right-hand scale)
ECB MRO rate (right-hand scale) Chart II-4 Official interest rates and short-term market yields
1A significant upward correction of the 2001 current account deficit was an- nounced on February 18, 2002.
30 35 40 45 50 55 60 65 70 75 80
Basispoint 01.01 02.01 03.01 04.01 05.01 06.01 07.01 08.01 09.01 10.01 11.01 12.01 01.02 02.02
Chart II-3 Average spread on DEM-denominated Hungarian sovereign bonds
October market participants tended to overestimate the level of interest rates for early 2002, but since then there has been a steady reduction in inflation and, simultaneously, interest rate expectations. Market participants are expecting another 50-basis-point cut in interest rates by June 2002. The Reuters’ sur- vey of 18 January reflects higher interest rate expectations than suggested by the yield curve, with the average for analysts’ ex- pectations amounting to 8.3% (see Chart II-5 ).
The steadily lower interest rate expectations caused the three-month forint yield to decline from around 10.5% in early November to 8.5% in late February. As the forint yields fell more than euro yields of a similar maturity over the period under re- view, the interest rate differential, which had been over 700 basis points in late October, fell to close 500 basis points (see Chart II-6).
3 Capital flows
and the exchange rate
A
fter the effect of the September terrorist attacks tapered off, from October to end-January the exchange rate of the forint appreciated steadily, except for a few days of downturn. As noted above, this strengthening of the exchange rate was due to both country- and region-specific factors.Analysts expect this strong level of the exchange rate to be lasting. Over the period since the publication of the previous In- flation Report, the Reuters’ poll’s exchange rate expectations, for the same future dates, have increased month by month. While expectations relating to the end of the year 2002 suggest only a slight appreciation in the exchange rate, those for shorter maturi- ties reflected increasingly stronger expectations parallel to the strengthening of the spot rates indicating that market participants consider the level of the exchange rate seen in January sustain- able. This caused the expectations’ curve to tilt around the longer horizons, with the segment for the shorter maturities rising up- wards. Chart II-7 displays the average of the November 2001 and January 2002 monthly polls (forecasts for the end-2003 exchange rate are requested from December onwards).
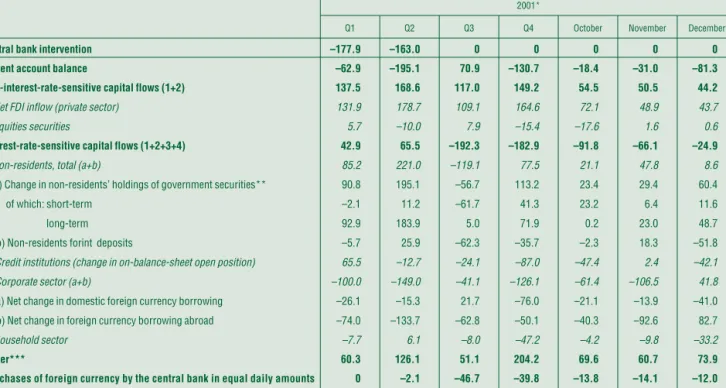
Simultaneously with the strengthening of the forint (see Chart II-8) there was a shift in the composition of capital flows. From September to January, the seasonally adjusted current account deficit showed a slightly deteriorating trend. Still, the annual cur- rent account deficit was smaller than in 2000. Financing this defi- cit causes no difficulties, after the temporary downfall in the third quarter, non-interest-sensitive capital picked up again, due pri- marily to a higher inflow of direct investment (see Table II-1).
Available data show that only October witnessed some outflow of equity capital during the reviewed period.
The outflow of interest-sensitive capital first seen in July and August continued until the end of the year. However, from Sep- tember on, this outflow of funds was due not so much to non-residents’ demand for foreign currency: the demand can be attributed to firms’ repayment of foreign currency debt to non-residents until November end to the increase in household foreign currency deposits in December. However, the bulk of the increase in household forex deposits was due to the introduction
II Monetary policy, interest rates and the exchange rate
230 235 240 245 250 255 260 265 270
02.01.01 02.04.01 02.07.01 02.10.01 02.01.02 02.04.02 02.07.02 02.10.02 02.01.03 02.04.03 02.07.03 02.10.03
HUF/Euro HUF/Euro
230 235 240 245 250 255 260 265 270
Prompt HUF/Euro
Analysts exchange rate expectations - January Reuters poll Analysts exchange rate expectations - November Reuters poll Chart II-7 Forint exchange rate and analysts’
expectations of future exchange rate movements
230 240 250 260 270 280
06.19.01 07.19.01 08.19.01 09.19.01 10.19.01 11.19.01 12.19.01 01.19.02
Forint/euro
230 240 250 260 270 280
Forint/euro
Forint/euro Central parity Chart II-8 Exchange rate of the forint
500 550 600 650 700 750
Basispoint 01.05.03. 01.06.03. 01.07.03. 01.08.03. 01.09.03. 01.10.03. 01.11.03. 01.12.03. 02.01.03. 02.02.03.
3-month interest rate differential vis-á-vis the eurozone Chart II-6 Three-month interest rate differential vis-à-vis the euro area
7 7.5 8 8.5 9 9.5 10 10.5 11 11.5 12
03.00. 06.00. 09.00. 12.00. 03.01. 06.01. 09.01. 12.01. 03.02. 06.02. 09.02. 12.02.
Percent
2-week NBH deposit
Reuters poll. 18 Jan.
11 Oct. 2001
19 Feb. 2002
Chart II-5 Central bank base rate expectations:
the yield curve and the Reuters’ poll
of euro notes and coins, since households tried to dispose of for- mer eurozone member currency cash partly by placing it on euro bank accounts. According to NBH estimates this effect accounted for a HUF 7,5 billion and HUF 34,7 billion increase in households’
forex bank deposits in November and December, respectively.
Although included in Table II-1 for technical reasons, these trans- actions did not affect foreign exchange supply and demand.
The value of corporate sector net foreign currency borrowing from non-residents was negative during the September to No- vember period. It seems likely that the slowdown in the econ- omy and the cutbacks in investment exerted downward pressure on firms’ financing demand. This tendency has stopped in De- cember: while redemption of domestic foreign currency debt ac- celerated, net foreign currency borrowing from non-residents has increased.
Non-residents’ government securities holdings continued to decline in September, but the sales of long-term government se- curities typical of previous months came to an end. Conse- quently, the downward trend in the average maturity of non-residents’ government securities holdings stopped (see Chart II-9). However, from October on, there was an upward shift in the value of both short-term and long-term government securities holdings, primarily due to Hungary’s better risk rating and investors’ customary portfolio reallocation at the beginning of the year. In the course of December and January, in addition purchases of long-term government securities, non-residents in- vested strongly in short-term government securities, causing a temporary fall in the average maturity of non-residents’ govern- ment securities holdings.
Until October, banks held nearly closed total foreign ex- change positions , which then gradually evolved into long posi-
II Monetary policy, interest rates and the exchange rate
Table II-1Components of foreign exchange demand and supply
HUF billions 2001*
Q1 Q2 Q3 Q4 October November December
I Central bank intervention –177.9 –163.0 0 0 0 0 0
II Current account balance –62.9 –195.1 70.9 –130.7 –18.4 –31.0 –81.3
III Non-interest-rate-sensitive capital flows (1+2) 137.5 168.6 117.0 149.2 54.5 50.5 44.2
1 Net FDI inflow (private sector) 131.9 178.7 109.1 164.6 72.1 48.9 43.7
2 Equities securities 5.7 –10.0 7.9 –15.4 –17.6 1.6 0.6
IV Interest-rate-sensitive capital flows (1+2+3+4) 42.9 65.5 –192.3 –182.9 –91.8 –66.1 –24.9
1 Non-residents, total (a+b) 85.2 221.0 –119.1 77.5 21.1 47.8 8.6
a) Change in non-residents’ holdings of government securities** 90.8 195.1 –56.7 113.2 23.4 29.4 60.4
of which: short-term –2.1 11.2 –61.7 41.3 23.2 6.4 11.6
long-term 92.9 183.9 5.0 71.9 0.2 23.0 48.7
b) Non-residents forint deposits –5.7 25.9 –62.3 –35.7 –2.3 18.3 –51.8
2 Credit institutions (change in on-balance-sheet open position) 65.5 –12.7 –24.1 –87.0 –47.4 2.4 –42.1
3 Corporate sector (a+b) –100.0 –149.0 –41.1 –126.1 –61.4 –106.5 41.8
a) Net change in domestic foreign currency borrowing –26.1 –15.3 21.7 –76.0 –21.1 –13.9 –41.0
b) Net change in foreign currency borrowing abroad –74.0 –133.7 –62.8 –50.1 –40.3 –92.6 82.7
4 Household sector –7.7 6.1 –8.0 –47.2 –4.2 –9.8 –33.2
V Other*** 60.3 126.1 51.1 204.2 69.6 60.7 73.9
VI Purchases of foreign currency by the central bank in equal daily amounts 0 –2.1 –46.7 –39.8 –13.8 –14.1 –12.0
* Based on the adjusted balance of payments data published on February 18th, 2002.
** The change in non-residents’ holdings of government securities may differ from the depository statistics of KELER due to government securities repo transactions with non-residents.
*** The entry ‘Other’ includes the Bank’s and general government’s transactions as shown in the current account, other monetary financial institutions’ demand for foreign currency and the statistical error.
2.1 2.3 2.5 2.7 2.9
06.20.01 06.30.01 07.10.01 07.20.01 07.30.01 08.09.01 08.19.01 08.29.01 09.08.01 09.18.01 09.28.01 10.08.01 10.18.01 10.28.01 11.07.01 11.17.01 11.27.01 12.07.01 12.17.01 12.27.01 01.06.02 01.16.02 01.26.02 02.05.02
Years
750 850 950 1,050 1,150
HUFbillions
Outstanding stock (right-hand-scale) Average maturity (left-hand-scale) Chart II-9 Volume and average maturity
of non-residents’ government securities holdings
-200 -150 -100 -50 0 50 100 150 200
03.07.00 14.08.00 25.09.00 08.11.00 20.12.00 05.02.01 21.03.01 03.05.01 15.06.01 27.07.01 10.09.01 24.10.01 07.12.01 24.01.02
-200 -150 -100 -50 0 50 100 150 200
Total open position (5-day moving average) Off balance sheet position (5-day moving average) On balance sheet position (5-day moving average)
HUFbillions HUFbillions
Chart II-10 Commercial banks’ open foreign exchange positions
(excluding the Hungarian Development Bank)