The Efficiency of Utilization of Dietary Proteins
JAMES B. ALLISON
Bureau of Biological Research and The Department of Physiohgy and Biochemistry, Rutgers, The State University, New Brunswick, New Jersey
Page
I. Introduction 97 II. The Dynamic State of Protein Metabolism 98
A. Body "Protein Stores" or "Reserves" 98
B. Endogenous Metabolism 98 C. Nitrogen Balance 100 III. Maintenance of Nitrogen Equilibrium 101
A. Nitrogen Balance Indexes 102
B. Biological Values 102 C. Adaptation of Nitrogen Balance 104
D. Correlation with Amino Acid Pattern 105
IV. Repletion of "Protein Stores" 107 A. The Nitrogen Balance of Repletion 107
B. Repletion of Plasma Proteins 109 V. Growth as a Measure of Nutritive Value of Dietary Proteins I l l
A. The Protein Efficiency Ratio and the Nitrogen Growth Index . . I l l
B. Plasma Proteins 113 C. Protein Efficiency and Growth of Neoplasms 113
D. Nitrogen Balance and Growth 114
References 115 I. INTRODUCTION
Dietary proteins supply the amino acids for cellular protein synthesis and for other metabolic purposes. Protein synthesis can be correlated with three related activities of the living system, one involving main- tenance, another repletion of depleted tissues, and the third the growth of new cellular proteins. Given the necessary constituents in the diet, the efficiency of utilization of dietary proteins for synthesis is primarily a function of four variables which are: the patterns of amino acids pro- vided by the diet, the nitrogen intake, the caloric intake, and the physi- ological state of the individual. The efficiency of utilization of dietary proteins will be discussed, therefore, in relation to maintenance, to repletion, and to growth, including in the discussion a consideration of the four variables which have a more or less direct effect upon protein metabolism. Such a discussion will be most meaningful, however, if it is developed from the concept of the dynamic state of protein metabolism.
97
II. THE DYNAMIC STATE OF PROTEIN METABOLISM
Amino acids may enter into one of two metabolic pathways which have been called anabolism and catabolism. Through anabolism, for example, amino acids are organized into cellular proteins. Catabolism is the reverse process, involving the hydrolysis of proteins into amino acids which, in turn, may be broken down into still simpler products, some of them formed irreversibly and excreted as waste products. Thus the tissue proteins are, to a varying degree, in a dynamic state (Whipple, 1948) contributing to and taking amino acids from an over-all "metabolic pool." This concept of a "pool" has a certain experimental reality
(Rittenberg, 1948-1949) which will be developed throughout this dis- cussion of the efficiency of utilization of dietary proteins. The "pool,"
however, should not be considered as a disorganized fluid component of the body but rather as a mechanism for transfer of amino acids from one tissue to another. The data demonstrate also that some tissues are highly labile, entering into and drawing from the pool continually;
others are less active in the dynamic state, while still others are "one- way streets," being essentially irreversibly formed, thereby taking from but contributing little to the "pool" (Greenberg and Winnick, 1948).
A. BODY "PROTEIN STORES" OR "RESERVES"
Some body proteins, particularly plasma albumin, and many cyto- plasmic proteins of the soft tissues rise or fall in amount as the dietary protein intake increases or decreases. These tissue proteins have been called the labile "protein reserves" or "protein stores" (Whipple, 1948).
Such a dynamic state can result, therefore, in a shift in amino acids from one tissue protein to another through the "metabolic pool." This process of tissue catabolism and resynthesis also leads to an irreversible break- down of some of the amino acids to yield energy to the living system, urea being one of the end products of this irreversible catabolism. The amino acids, so catabolized, must be replaced by the diet or synthesized from dietary constituents. If dietary protein intake is restricted, the continual catabolic activity of the living system results in a reduction in amino acid supplied to the "metabolic pool," thereby decreasing the
"protein stores" (Allison, 1953a).
B. ENDOGENOUS METABOLISM
The variation in excretion of urinary nitrogen with the magnitude of the "protein stores" is illustrated in Fig. 1. These data were obtained while feeding a protein-free diet to adult dogs; first, while they were in a so-called normal state, second, while they were depleted in "protein stores," and, third, after they had been repleted in those "stores."
Since all of the nitrogen excreted during these periods of feeding a protein-free diet came from body cellular metabolism, this urinary nitro- gen can be considered to be endogenous in origin. These shifts in excretion of endogenous nitrogen are primarily the result of variations in catabolism of amino acids in that part of the "metabolic pool" which contributes to the formation of urea. Change in urea nitrogen excretion, however, can be of body nitrogen origin (endogenous) or of food nitro- gen (exogenous) origin and be associated with a number of metabolic
<
o »- 100
_ J o
cr
o o
u_ O
*-°
2 50
LU
O cr
>-
cr <
cr ID 0
CONTROL D E P L E T E D REPLETED
FIG. 1. Urinary nitrogen excreted (expressed as % of control) in adult dogs fed a protein-free diet while they were in normal, depleted, and repleted states.
pathways. An interesting shift, for example, in amino acids from the site of formation of urea to muscle cells may be associated with carbo- hydrate metabolism. To quote Munro (1956): "After giving carbo- hydrate, amino acids are preferentially deposited in muscle and this causes a reduction in their level in the blood. The amino acid supply to other tissues is thus curtailed, with two consequences. First, urea pro- duction by the liver is reduced, so that a fall in urinary output occurs, and, secondly, the tissues other than muscle have a reduced supply of amino acids for synthesis. This later is reflected in the slightly reduced protein content of the liver." Munro suggests that these responses to carbohydrate metabolism are the result of insulin called forth by incom-
ing dietary carbohydrate. Other shifts in hormonal balance can also alter the interrelationship between anabolism and catabolism to either increase or decrease the excretion of urea depending upon the metabolic pathways involved in the response (Leathern, 1958). The variations in excretion of urea, associated with amino acid deficiencies, amino acid imbalances, or other alterations in dietary amino acid patterns will be considered in detail later. The general conclusion can be stated, how- ever, that amino acids, not used for anabolic purposes, may enter into the urea forming metabolic cycle so that the excretion of urea nitrogen will rise or fall, not only with changes in cellular protein (endogenous) but also with dietary protein (exogenous) metabolism. The excretion, on the other hand, of compounds containing nitrogen such as creatinine are approximately constant (see Fig. 1) and independent of catabolism of amino acids which enter the urea cycle. Folin (1905), for that reason, emphasized the endogenous origin of creatinine.
C. NITROGEN BALANCE
This dynamic catabolic, anabolic interrelationship can be integrated into a nitrogen balance which is defined by Eq. (1)
B = I - ( U + F) (1) where B is nitrogen balance, I is nitrogen intake, U is the excretion
of urinary nitrogen, and F, the excretion of fecal nitrogen. Nitrogen balance, therefore, is the difference between nitrogen intake and the nitrogen excreted. If nitrogen balance is positive, the riving system is gaining in protein, either through the growth of new tissues or the repletion of depleted "stores." Negative nitrogen balance means a loss in tissue nitrogen through excess catabolism, the dietary protein intake being insufficient to meet the needs for maintenance of the body pro- teins. When the intake I just equals excretion ([/ + F) the system is in equilibrium and is said to be maintaining the status quo, catabolic activity being nicely balanced with anabolism.
Nitrogen balance, however, is the integrated sum of the gains and losses involving all the tissue proteins of the body. It is possible, in such a dynamic state, to have the system go into positive balance and still have some tissues losing nitrogen. Conversely, the system may drift into negative balance but some individual tissues may still be in positive balance. Since urea nitrogen excretion can reflect so many different changes in metabolic pathways, associated with both exogenous and endogenous metabolism, including the effects of responses of the en- docrine system, nitrogen balance responds to many variables. Indeed,.
the following discussion will emphasize a consideration not only of the
direction but also the rate of change of nitrogen balance as an indication of shifts in nitrogen metabolism within the body of an animal.
III. MAINTENANCE OF NITROGEN EQUILIBRIUM
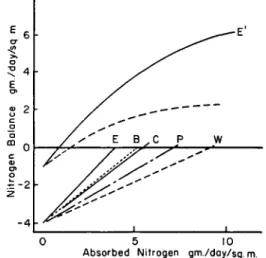
The effect of nitrogen intakes upon nitrogen balance is illustrated in Fig. 2. These curves were obtained while feeding different dietary protein sources at various nitrogen intakes over short periods of time to adult dogs so that the "protein stores" and overall tissue catabolic activity would be essentially constant. The lower curves in negative
Absorbed Nitrogen gm./day/sq. m.
FIG. 2. Lower curves illustrate nitrogen balances produced while feeding (over short periods of time) egg proteins, E; beef, B; casein, C; peanut flour, P; and wheat gluten, W. Upper curves illustrate type of data while feeding a protein of high nutritive value (Ε') and low nutritive value (dashes) to protein-depleted dogs (taken from Allison, 1957).
balance illustrate the type of data obtained while feeding dogs with full "protein stores" and maximum excretion of urinary nitrogen. The dietary protein sources are indicated by the letters at the ends of the curves where E represents egg; B, beef; C, casein; P, peanut flour;
W, wheat gluten. These curves do not extend into positive balance because the stores of these adult dogs were filled and nitrogen retention, represented by positive balance, could not take place. The upper curve, extending into positive balance and ending at E', illustrates the type of data obtained while feeding different amounts of egg protein to an individual depleted in "protein stores." The dashed line, also extending into positive balance, illustrates the type of data obtained while feeding a protein of low nutritive value to a protein-depleted animal. The stores
cannot be filled as rapidly with protein of low nutritive value as can be developed with the protein of higher nutritive value. In general, the greater the degree of positive balance that can be produced by feeding a given protein to an adult, the greater the degree of depletion in body proteins. This problem of repletion will be discussed in more detail later but the data in Fig. 2 emphasize the decreased excretion of nitrogen associated with the depleted state and also the relatively small amount of nitrogen required to establish nitrogen equilibrium in the depleted animal. The amount of nitrogen necessary to maintain nitrogen equili- brium in an adult dog, depending upon the magnitude of the "protein stores," can vary from approximately 1 gm. per day to over 4 gm. per day per square meter of body surface area. Possibly the minimum excretion of body nitrogen would be equal to approximately 2 mg. of nitrogen per basal calorie in a normal individual. Such a minimum is supported by the work of Terroine (1936), Smuts (1935), Mitchell
(1929), and Bricker et al (1945).
A. NITROGEN BALANCE INDEXES
The curves in Fig. 2 have been represented as linear in the region of negative and low positive balance becoming curvilinear as they are extended into positive balance. Experimentally, the curves are not always found to be linear over so much of the range of nitrogen balance;
but regardless of the shape, the curves represent the rate of nitrogen retention with respect to nitrogen intake. The tangent of the curve at any intake, therefore, has been called the nitrogen balance index of that intake (Allison et al., 1946). The curves also can be considered as essentially semilogarithmic over the whole range of intakes, thereby expressing the general observation, which can be called the "law of diminishing returns." This concept, applied to protein metabolism, has been emphasized by Almquist (1954) and developed still further by Flodin (1957). Thus the intake producing maximum nitrogen balance would fill the "protein stores" of the body most rapidly.
B. BIOLOGICAL VALUES
The nitrogen balance indexes of dietary proteins, illustrated in Fig. 2, represent the fraction of absorbed nitrogen retained in the body of the animal provided the excretion of endogenous nitrogen, represented by zero nitrogen intake, is constant and independent of nitrogen intake.
The fraction of absorbed nitrogen retained in the body has been defined as the "biological value" of the protein, a concept that has been so well developed by Mitchell and his associates (Bricker et al., 1945). The
"biological values" or indexes for nitrogen equilibrium when the stores
were full were: egg, 1.14; beef, 0.77; casein, 0.73; peanut flour, 0.56;
and wheat gluten, 0.44 (Allison, 1955).
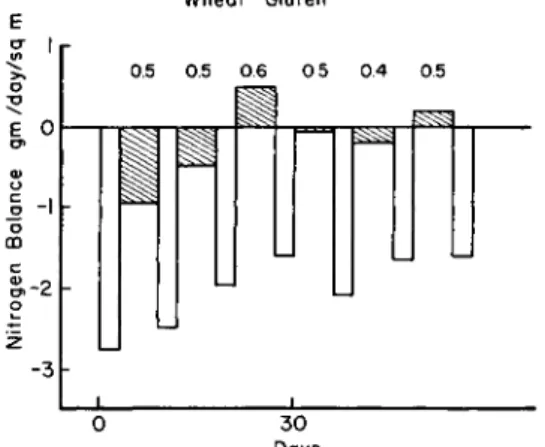
The data illustrated in Fig. 3 demonstrate the adaptive characteristics of nitrogen balances together with the rather constant index obtained during this adaptation. The white bars record the negative nitrogen balance associated with periods of feeding a protein-free diet to adult dogs. The bars with slanted lines record the nitrogen balances obtained while feeding a constant amount of wheat gluten nitrogen in alternate periods to those involving feeding of the protein-free diet. The first white bar is sufficiently negative to express a catabolic activity of
σ |Γ
E 0
-lh
Wheat Gluten
0.5 0.5 0.6 0 5 0.4 0.5
HTM
^ ^0 30 Days
FIG. 3. Effect of feeding a protein-free diet (white bars) alternately with wheat gluten nitrogen (bars with slanted lines). Figures above bars are indexes (taken from Allison, 1953b).
endogenous metabolism that is within the so-called normal range. The wheat gluten nitrogen intake was not sufficient to produce nitrogen equilibrium under these conditions. The negative balance associated with both the protein-free and nitrogen feeding periods resulted in a reduction in the excretion of nitrogen so that the third period of feeding wheat gluten produced a positive balance. From then on, the animals were close to nitrogen equilibrium during the periods of feeding wheat gluten, an adaptation which is illustrated also by the reduced excretion of nitrogen during the periods of feeding the protein-free diet. The indexes presented above each period of nitrogen feeding were calculated fromEq. (2)
Index = B Bo (2)
where B is the nitrogen balance produced by the nitrogen intake (I) and Bo is the nitrogen balance established during associated periods of
feeding the protein-free diet. The tendency for the index to increase when the animal has been depleted may account for the rise to 0.6 during the third period of feeding the wheat gluten. Certainly in the depleted animal the indexes increased quite markedly in value. In the depleted dog, for example, the index for egg was still close to unity (1.12) but the index for casein had increased to 0.84 and the index for wheat gluten was raised most markedly to 0.74 (Allison, 1949). These higher indexes for proteins fed to the depleted animal indicate that potential anabolic processes are raised. Data have been obtained, for example, to demonstrate an increased uptake of S35-labeled methionine in many of the tissue proteins in the dynamic state of the depleted animal (Allison et ah, 1958b).
C. ADAPTATION OF NITROGEN BALANCE
The data in Fig. 3 illustrate one kind of adaptation of nitrogen balance to shifts in catabolic, anabolic interrelationships. Adaptations of the living system to changing conditions of both exogenous and endogenous origins are often reflected by alterations in nitrogen balance and interpretations of the significance of any particular balance should take into consideration adaptive processes. For example, in a growing individual, the balance should be positive and essentially constant while feeding intakes of dietary protein, sufficient to establish the growth response. If, however, a change in diet is made and the individual goes into positive balance for a short period of time and then drifts into a more negative balance, this adaptive procedure may indicate a deficient amino acid pattern. The best balance of amino acids will produce an adequate positive balance and retain that balance for optimum growth.
Thus the direction of change in nitrogen balance, representing adap- tation, can reveal additional information concerning the significance of the response. In many experimental designs these adaptive processes can be very rapid. Another type of adaptive mechanism may represent a shift in body fluids and in the excretion of urea nitrogen. Mention has already been made to the shifts in urea nitrogen formation and excretion that are associated with incoming carbohydrate. It is possible for an initial change in nitrogen balance to represent an alteration in excretion of urea from the body pool rather than in nitrogen retention. An indi- vidual, for example, could go into a negative nitrogen balance in re- sponse to a change to a lower intake of a better quality protein, even though the body tissues may be in positive balance. The negative balance would be the result of excretion of the relatively excess urea nitrogen formed during the previous period of feeding the higher intake of a protein of low nutritive value. The negative balance just described,
however, should be followed by a rapid shift into more positive balance in the presence of the protein of high nutritive value.
D. CORRELATION WITH AMINO ACID PATTERN
The magnitude of the balances also can be correlated with the pat- tern of essential amino acids provided by the dietary proteins to the body, essential amino acids being defined by Rose (1936) as those which cannot be synthesized by the body from dietary sources in adequate amounts to meet the metabolic needs. Essential amino acids must, therefore, be provided in the daily diet in sufficient quantities and in proper proportions to meet the demands for synthesis as well as for other special metabolic roles. Alteration of the pattern of essential amino acids in the dietary protein can change markedly the retention of dietary nitrogen in the body. For example, if lysine is added to wheat gluten, the index can be increased to 0.8. Adding methionine to casein increased the index to values equal to those found for egg proteins.
The nitrogen balance index of unity obtained for egg proteins has been interpreted to mean that the pattern of essential amino acids pro- vided by these proteins is ideal for protein anabolism. All of the dietary nitrogen may be considered to be retained in the body of the animal for purposes of synthesis. Thus the pattern of essential amino acids in egg protein has been used as a reference for the calculation of the nutritive value of other dietary proteins. Mitchell and Block (1946) and Block and Mitchell (1946-1947), using egg protein with a "biological value"
of 100, compared the percentage of each essential amino acid to that found in egg protein. A "protein score" was calculated to be the relative amount of the amino acid showing the largest deficit to the correspond- ing value in egg protein. These "protein scores" were highly correlated with the "biological values" determined experimentally. Oser (1951) sought to improve this type of calculation by taking into consideration, through a geometric mean, the pattern of essential amino acids, thereby expressing nutritive value in terms of an "Essential Amino Acid Index."
Mitchell (1954) calculated a "modified amino acid index" as the geo- metric mean of the relative deficits of all the essential amino acids pres- ent in smaller quantities than occurs in egg proteins. The correlation between this calculation and experimentally determined "biological values" suggested that the single amino acid most limiting may not entirely determine the nutritive value but that several deficits may contribute to the establishment of this value.
The estimation, therefore, of nutritive values through a search for the most limiting amount of each essential amino acid needed for main- tenance, repletion, or growth is a most important feature of the study
of protein nutrition. Such minima have been sought through the use of mixtures of amino acids. A reference pattern of amino acid, for example, has been developed by the Committee on Protein Requirements of the Food and Agricultural Organization (Protein Requirements, 1957) from studies of amino acid requirements for maintenance and growth in man (Rose, 1957; Leverton et ah, 1956; Swendseid et ah, 1956; Holt and Snyderman, 1956; Jones et ah, 1956). This pattern, expressed as milligrams of amino acid per gram of nitrogen is isoleucine, 270; leucine, 306; lysine, 270; phenylalanine, 180; tyrosine, 180; total sulfur amino acids, 270; methionine, 144; threonine, 180; valine, 270; tryptophan, 90.
It was hoped that such a group of minimum requirements would be helpful in determining essential amino acid deficiencies in dietary pro- teins. These requirements could vary with the age and physiological state of the individual but, for a first approximation, one provisional pattern was suggested to estimate deficiencies. The pattern was called provisional to emphasize the need to determine more accurately the absolute requirements of amino acids and the ratios between them.
Obviously, shifts in relative rates of absorption of amino acids, resulting from delayed digestion or from other causes would also alter the sig- nificance of a fixed reference pattern. Analysis of the data in the liter- ature, however, demonstrate that this provisional pattern is very useful in estimating essential amino acid deficiencies and "Biological Values"
of dietary proteins.
Although this pattern for amino acid requirements represents a first approximation based upon amino acid studies in man, the pattern even- tually developed for protein anabolism will probably be quite similar for most animals. The nitrogen balance indexes of dietary proteins for the rat, for the dog, and for man are similar (Allison, 1957) except that the rat and the dog require a higher sulfur amino acid intake than man
(Cox et ah, 1947) and the rat requires less lysine for maintenance (Mitchell, 1947). Other exceptions occur when large amounts of pro- teins of unusual composition must be synthesized such as wool and feathers. The chick lacks ability to synthesize sufficient arginine and glycine to meet the needs for protein metabolism. The data presented by Nässet (1957) also emphasize the similarity of the essential amino acid requirements for rat and man when placed upon the basis of metabolic body size. These experiments involving minimum require- ments of essential amino acids suggest that when nitrogen needs are met, excesses of some of the essential amino acids may occur in proteins of high nutritive value. If excesses do exist, they would contribute to the need for so-called nonessential amino nitrogen but they also could, at times, represent safety factors to control the intake of essential amino
acids under various physiological conditions. This report emphasizes the large number of variables that can effect the utilization of amino acids, one of the most important of these variables being the rate of absorption of one amino acid with respect to another, thereby controlling the actual pattern presented to the body. The value, however, of a reference pattern of minimum requirements of essential amino acids, such as the one proposed by FAO, for estimation of dietary deficiencies in those acids cannot be overemphasized. The preliminary studies by Scrimshaw and associates (1957) illustrate the usefulness of the refer- ence pattern to researches on amino acid deficiencies and supplementa- tion in children suffering from protein malnutrition.
IV. REPLETION OF "PROTEIN STORES"
The interrelationship between patterns of amino acids provided by the diet, the nitrogen intake, and the caloric intake can be illustrated nicely by the effects of these variables upon repletion of depleted "pro- tein stores" in the adult dog. The animals were depleted by feeding a protein-free diet for 4 weeks (Allison and Wannemacher, 1957) and then repleted by feeding the same diet with constant protein and caloric intakes until nitrogen equilibrium was reached.
A. THE NITROGEN BALANCE OF REPLETION
The positive nitrogen balance produced in the depleted dog by feeding protein was a function of the nitrogen intake, the caloric intake, and the pattern of amino acids provided by the dietary protein.
1. The Effect of Nitrogen Intake
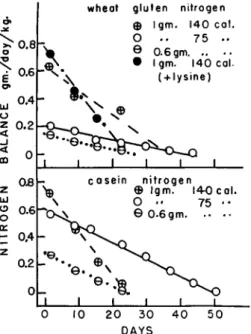
The circles with horizontal bars in Fig. 4 (Allison, 1958a, b) record the nitrogen balances produced in depleted dogs by repleting with 0.6 gm. of casein nitrogen or of wheat gluten nitrogen per day per kilo- gram of body weight. The slopes of the lines record the rate of reple- tion; the areas under the lines represent the amount of dietary nitrogen retained in the body. The caloric intake was maintained constant at 75 calories per day per kilogram of body weight, a caloric intake that is considered adequate for the normal adult animal kept under laboratory conditions. Increasing the nitrogen intake to 1 gm. per day per kilogram of body weight and keeping the caloric intake at 75 calories resulted in a greater nitrogen balance and amount of repletion but the slopes of the repletion lines (illustrated by the open circles) were not altered from the slopes observed at the lower nitrogen intakes (0.6 gm. per day per kilogram B.W.).
2. The Effect of Caloric Intake
Increasing the caloric intake to 140 calories per day per kilogram of body weight increased the rates of repletion markedly, illustrated by the lines drawn through the circles with cross bars. This high caloric intake is essential also for rapid growth of new tissue in the young animal. Continued feeding, however, of such a high caloric intake beyond the time necessary for repletion of the depleted stores resulted in the development of reactions of obesity. These reactions are charac-
^ 0 . 8 o
ω °'4 o z 0.2
GO Oh
z °*
UJ » 0.6 o or H- 0.4
0.2
wheat gluten nitrogen 0 Igm. 140 cal.
O . . 7 5 -
"to θ 0.6 gm. ..
Λ \ · Igm. 140 cal.
\ ( + lysine)
_|_
casein nitrogen Θ Igm. 14-Ocal.
O ·· 75 · · Θ 0.6gm
0 | -
I 20 30 4 0 DAYS
FIG. 4. The nitrogen balances produced in depleted dogs by repleting with casein nitrogen or wheat gluten nitrogen (see Allison, 1958a, b ) .
terized by hypercholesterolemia, hyperphospholipidemia, and with an increase in the lipid migrating electrophoretically with plasma globulins (Allisons at, 1958a).
3. The Effect of Amino Acid Pattern
The data illustrated in Fig. 4 demonstrate the increased rates of repletion associated with the feeding of casein compared to the results obtained while feeding wheat gluten. For example, feeding 0.6 gm. of casein nitrogen per day per kilogram of body weight resulted in an initial nitrogen balance of 0.26; the slope of the repletion line was 0.011, and 3.2 gm. of nitrogen per kilogram of body weight was retained in the body during repletion to nitrogen equilibrium. Feeding 0.6 gm. of
wheat gluten nitrogen per day per kilogram of body weight resulted in an initial nitrogen balance of 0.14; the slope was 0.003, and 2.9 gm. of nitrogen per kilogram of body weight was retained during repletion.
Approximately 1 gm. of casein nitrogen per day per kilogram of body weight increased the initial balance to 0.75, the slope to 0.03, and the amount of repletion at equilibrium to 9.5 gm. of nitrogen per kilogram of body weight. Supplementing the 1 gm. of casein nitrogen with methionine raised the initial nitrogen balance to 0.84, the slope to 0.045, but the amount of repletion, when equilibrium was reached, was still 9.5 gm. of nitrogen per kilogram of body weight. Feeding approximately 1 gm. of wheat gluten nitrogen per day per kilogram of body weight resulted in an initial nitrogen balance of 0.63; the slope of repletion line was 0.019, but the amount of repletion, when nitrogen equilibrium was re-established, was approximately the same as that reached by feeding casein. Supplementing the wheat gluten with lysine increased the initial nitrogen balance to 0.72 and the slope of repletion to 0.034, making the repletion with the supplemented wheat gluten the same as was obtained with casein. These data on repletion suggest that if unsupplemented wheat gluten is fed for a sufficient length of time to reach equilibrium the adult "stores" can be filled with nitrogen in amounts equivalent to those retained during repletion with casein.
Further studies are needed, however, to determine the effect of high intake of a deficient protein upon the balance between various tissue proteins and fat stores. Evidence is being obtained to demonstrate an imbalance of repletion associated with deficient amino acids, particularly if the nitrogen balance index is less than 0.6. Such imbalances will be illustrated in part with the data involving the effects of the pattern of amino acids upon growth in young animals. The effect of dietary pat- terns upon the rates of formation of individual tissue proteins can be illustrated also by the following data on repletion of plasma proteins.
B. REPLETION OF PLASMA PROTEINS
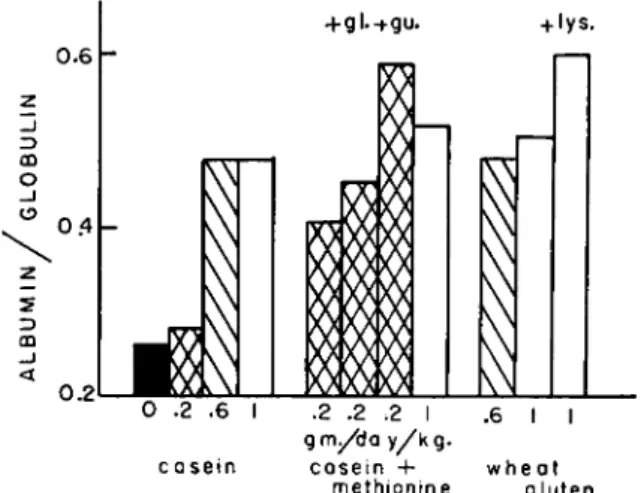
The black bar in Fig. 5 records the average plasma albumin/globulin ratio in dogs after having been fed a protein-free diet for a period of 4 weeks. The dogs were repleted over a period of 4 weeks by feeding different amounts of casein, sometimes supplemented with other amino acids, or wheat gluten with or without lysine. Feeding 0.2 gm. of casein nitrogen per day per kilogram of body weight to these depleted dogs produced only a slight positive balance so that they were kept in a depleted state and the albumin/globulin ratio remained at a low level (illustrated by the bar with crossed lines over casein). Increasing the intake to 0.6 gm. of casein nitrogen per day per kilogram of body weight
did not fill the protein stores completely but the albumin/globulin ratio was raised to approximately 0.5, as recorded by the bar with slanted lines over casein. Feeding 1 gm. of casein nitrogen per day per kilogram of body weight to the depleted animals over a period of 4 weeks filled the protein stores but did not raise the albumin/globulin ratio (illus- trated by the white bar over casein) above the value obtained while feeding the lower nitrogen intake. The development of a low albumin/
globulin ratio, even in the presence of relatively full "protein stores," is characteristic of repletion with casein (Seeley, 1945; Chow et al., 1948).
0.6 z
- j
O CD
z
CD _J
<
0.2
0 .2 .6 I .2 .2 Z I .6 1 1 g m / d a y / k g .
casein casein 4- wheat methionine gluten
FIG. 5. Albumin/globulin ratios produced during repletion with different amounts of casein and wheat gluten nitrogen fed to protein-depleted dogs (see text for details) (taken from Allison and Wannemacher, 1957).
The bars over wheat gluten in Fig. 5 demonstrate the more marked effect that this dietary protein has upon the albumin/globulin ratio, especially when the gluten is supplemented with lysine. A similar re- sponse to the synthesis of plasma albumin in growing rats fed wheat gluten will be recorded later in this report. The formation of plasma albumin was increased by supplementing the casein with methionine, illustrated by the bars over casein plus methionine. Even when the intake was only 0.2 gm. of casein nitrogen per day per kilogram of body weight and repletion of body "protein stores" was quite limited, the albumin/globulin ratio was increased markedly by supplementing the casein with methionine. Adding more nitrogen in the form of glycine with the methionine did not increase the ratio above the value recorded for dogs fed casein supplemented with methionine alone. Supplementing the low casein diet, however, with methionine plus guanidinoacetic acid increased the ratio to normal values even in dogs that were still rela-
+gl.-fgu. +lys.
J
tively low in "protein stores" (Allison, 1956; Allison and Wannemacher, 1957). This response to the addition of guanidinoacetic acid with methionine to casein was observed only in animals that had been de- pleted in one way or another in "protein stores." These results suggest the possibility of altering the rates of repletion of specific tissue proteins, possibly for therapeutic purposes, by using various mixtures of dietary amino acids. (Whipple et al.9 1946, Sebrell and McDaniel, 1952). These data also re-emphasize the possibilities that some tissue proteins may be in more positive balance than others during a process of repletion.
The best over-all pattern of amino acids could be the one that promoted the repletion of old or the growth of new tissues in rates balanced most advantageous to the development of some particular physiological state.
V. GROWTH AS A MEASURE OF NUTRITIVE VALUE OF DIETARY PROTEINS
Gain in body weight, as a measure of the nutritive value of dietary proteins, has been most popular. Osborne and associates (1919) devel- oped the concept of protein efficiency which has been defined as the grams gained in body weight per gram of nitrogen or protein intake.
A. THE PROTEIN EFFICIENCY RATIO AND THE NITROGEN GROWTH INDEX
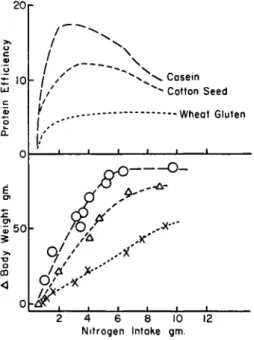
The variations in protein efficiency for casein, for cottonseed meal, and for wheat gluten with nitrogen intake in rats are illustrated in Fig. 6. These data were obtained by feeding these proteins in a purified diet to female rats from weaning over a period of 28 days (Allison et ah, 1958a). The nitrogen intake then represents the total intake over this 4-week experimental period. Osborne and associates recommended that the nutritive value of dietary proteins be expressed as the maximum ratio, a recommendation emphasized also by Barnes and Bosshardt
(1946). The rise and fall of the protein efficiency ratio with nitrogen intake is the result of the shape of the body weight gain curves, illus- trated in the lower part of Fig. 6. The open circles record the body weight gains of the female rats fed different amounts of casein over the 4-week feeding period. The triangles demonstrate similar data recorded while feeding groups of female rats different intakes of cottonseed meal protein. The crosses illustrate data obtained while feeding increasing intakes of wheat gluten nitrogen. The curves do not pass through the origin since a certain amount of nitrogen was necessary for maintenance of body weight. The quantity of nitrogen needed for maintenance was a large fraction of the total intake when nitrogen was restricted so that a protein efficiency ratio started low and then rose to a maximum as the nitrogen intake and body weight gain increased. As soon as max-
imum gain in body weight had been reached, increasing the nitrogen intakes resulted in a decreasing protein efficiency (Sure, 1957).
The rate of increase in body weight, with respect to nitrogen intake, was essentially linear at the lower nitrogen intakes so that the slopes of the curves, correlating body weight with nitrogen intakes, are a good measure of the nutritive value of the dietary protein. These slopes may be called nitrogen growth indexes. Such indexes are of particular value in the rat because growth in this animal is highly correlated with nitro-
20
£ 10
5 50
CO <
"
l*~"
1 1 1 '*
h / '
i'
Γ / *
< * / O/..* j *
U£_
^ \ \ \
— ^ \
^ v ^ \ Casein
^ Cotton Seed
_J 1 1 1 1
ci $**
\s '
6 ''
if ..*"
/ Δ X'
>'''' s*
—1 1 1 1 1
2 4 6 8 10 12 Nitrogen Intake gm.
FIG. 6. Data resulting from feeding different amounts of casein, cottonseed meal, or wheat gluten nitrogen to female rats from weaning over a period of 4 weeks.
gen retention (Hegsted and Worcester, 1947). The index for the linear portion of the casein curve is 19; for cottonseed meal, the index is 14;
and for wheat gluten, the index is 6. Supplementing the casein with methionine increased the growth index to 35. A similar experiment involving male rats resulted in the following growth indexes: egg, 35;
casein, 22; cottonseed meal, 14; wheat gluten, 7. Supplementing casein with methionine increased the index for casein to be equivalent to egg, and adding lysine to wheat gluten raised the index toward the value for casein (Allison et al., 1958a). There is need, however, to determine the optimum amounts of these amino acids needed for supplementation to produce specific effects at low and high nitrogen and calorie intakes.
Such a study, involving methionine and lysine supplementation, has been
reported by Rosenberg (1957), who found that methionine and lysine requirements increased with the energy content of the diet, data which emphasizes again the importance of caloric intakes upon nitrogen reten- tion (see also Bressani and Mertz, 1956).
B. PLASMA PROTEINS
The effects of increasing nitrogen intake upon the formation of plasma proteins are illustrated by the data recorded in Table I.
These data demonstrate the tendency for the development of a rela-
TABLE I
SERUM PROTEINS IN RATS F E D DIFFERENT AMOUNTS OF CASEIN OR OF W H E A T GLUTEN IN A PURIFIED D I E T OVER A PERIOD OF FOUR WEEKS
Serum proteins Nitrogen
intake (grams)
0.99 1.62 4.80 9.16 10.41 1.26 1.88 4.20 7.55
Albumin (A)
1.87 2.22 2.43 2.89 2.62
αι Casein
0.88 0.71 0.79 0.78 0.77
Globulins a2 ß
(grams %)
0.46 0.57 0.61 0.56 0.60 Wheat gluten 2.24
2.43 2.91 3.47
0.61 0.58 0.69 0.65
0.58 0.50 0.59 0.50
1.26 1.14 1.21 1.03 1.27
1.07 1.09 1.17 1.13
(G) Y
0.66 0.85 0.60 0.69 0.53
0.90 0.98 0.67 0.75
A/G
0.57 0.68 0.75 0.95 0.82
0.71 0.77 0.99 1.15 tively low albumin/globulin ratio in animals fed casein, the ratios being higher in rats fed wheat gluten, even though the growth of those fed the gluten was poor.
C. PROTEIN EFFICIENCY AND GROWTH OF NEOPLASMS
Three transplanted tumors in rats have been used to study the effect of diet upon growth of neoplasms (Allison et al.y 1956). The Flexner- Jobling carcinoma transplanted into the rat, for example, responded to dietary protein in much the same way as a growth response of a normal tissue. Twenty-eight days after transplantation, this carcinoma had grown to 5.3 gm. in rats fed wheat gluten. The tumor reached 11.3 gm.
in rats fed casein but was 20 gm. in size in animals fed egg proteins.
The plasma lipids in these animals were essentially normal. A trans- planted sarcoma, on the other hand, grew to 24.7 gm. in rats fed wheat
gluten, to 30.4 gm. in those fed casein but was reduced to 20 gm. in animals fed egg. Similarly, the Walker carcinoma 256 grew at maximum rate in rats fed 12% casein, being reduced in size in those fed either 12% wheat gluten or 12% egg. There was a marked increase in lipid migrating electrophoretically with the plasma globulins in rats with either the sarcoma or the Walker neoplasm. Both of these tumors developed most rapidly in rats fed 12-18% casein in the diet, the rate of development being reduced in animals fed smaller or larger amounts of casein. The difference in the rate of development with casein nitrogen intakes was correlated largely with the early establishment and growth of the tumor to reach the stage of most rapid growth, an early establish- ment that could be called the induction period. Further studies demon- strated that supplementing the casein with methionine increased the length of this induction time, thereby slowing down the development of the tumor. Supplementing with methionine plus guanidinoacetic acid reduced the rate of development still more by not only increasing the induction time but also reducing the rate of growth of the tumor during the semi-logarithmic phase (Allison et al., 1956, 1957). These results of diet upon tumor development emphasize the importance of kinds and amount of dietary protein upon the dynamic state of the living system, a dynamic state where some tissues may at times grow at the expense of others.
D. NITROGEN BALANCE AND GROWTH
Gain in body weight is not always a good measure of the growth of new tissue proteins. Some puppies, for example, were fed a purified diet containing either egg, casein, or wheat gluten as the source of protein (Allison, 1949). The grams gain in body weight per gram of nitrogen eaten was approximately 9 regardless of the source of protein but the nitrogen balance per gram of nitrogen intake varied with the source, being 0.5 in dogs fed the egg protein, 0.43 in those fed casein, and 0.18 in those fed wheat gluten. The animals fed egg were lean and lively, while those fed the wheat gluten were fat and less active. In general, the more positive the nitrogen balance produced by the dietary source, the better the pattern of amino acids for growth. However, correlation of amino acid patterns with nitrogen balance must take into consideration the concept of adaptation discussed previously in this report. A well balanced pattern, with adequate intake of nitrogen should sustain growth and positive balance in young animals. Shifting from one pattern to another may produce a response into positive balance but if the pattern is not adequate for sustained protein anabolism, the nitro- gen balance will not be maintained but may even drift into negative
balance. The living system does have remarkable abilities to adapt to dietary situations but if the imbalances in the diet are too great, whether they be between amino acids or between other constituents in the diet, the system develops a condition called malnutrition. Possibly the prin- ciple result of malnutrition is an inefficient living system, inefficient in its responses to endogenous and exogenous changes in environment.
Thus the maintenance of balance in all dietary constituents for the development of the most efficient living system is the function of good nutrition.
REFERENCES
Allison, J. B. (1949). Advances in Protein Chem. 5, 155-200.
Allison, J. B. (1953a). Borden s Rev. Nutrition Research 14, 61-69.
Allison, J. B. (1953b). 5th Congr. intern, med. trop. et paludisme Istanbul, Turkey pp. 465-486.
Allison, J. B. (1955). Physiol Revs. 35, 664-700.
Allison, J. B. (1956). In "Some Aspects of Amino Acid Supplementation" (W. H.
Cole, ed.), pp. 69-85. Rutgers Univ. Press, New Brunswick, New Jersey.
Allison, J. B. (1957). /. Am. Med. Assoc. 164, 283-289.
Allison, J. B. (1958a). Ann. Ν.Ύ. Acad. Sei. 69, 1009-1024.
Allison, J. B. (1958b). Voeding 19, 119-138.
Allison, J. B., and Wannemacher, R. W., Jr. (1957). In "Amino Acid Malnutri- tion" (W. H. Cole, ed.), pp. 1-13. Rutgers Univ. Press, New Brunswick, New Jersey.
Allison, J. B., Anderson, J. A., and Seeley, R. D. (1946). Ann. N.Y. Acad. Set.
47, 245-271.
Allison, J. B., Wannemacher, R. W., Jr., Prosky, L., and Crossley, M. L. (1956).
/. Nutrition 60, 297-308.
Allison, J. B., Wannemacher, R. W., Jr., Spoerlein, M. T., and Middleton, E.
(1958a). Federation Proc. 18, 516.
Allison, J. B., Wannemacher, R. W., Jr., Russell, T., and McCoy, J. (1958b).
Cancer Research 18, 394-397.
Almquist, H. J. (1954). Arch. Biochem. Biophys. 48, 482-483.
Barnes, R. H., and Bosshardt, D. K. (1946). Ann. N.Y. Acad. Set. 47, 273-296.
Block, R. J., and Mitchell, H. H. (1946-1947). Nutrition Abstr. 6- Revs. 16, 249- 278.
Bressani, R., and Mertz, E. T. (1956). Federation Proc. 15, 544.
Bricker, M. L., Mitchell, H. H., and Kinsman, G. M. (1945). J. Nutrition 30, 269-283.
Chow, B. F., Seeley, R. D., Allison, J. B., and Cole, W. H. (1948). /. Biol. Chem.
16, 69-78.
Cox, W. M., Jr., Mueller, A. J., Elman, R., Albanese, A. A., Kemmerer, K. S., Barton, R. W., Holt, L. E., Jr., Drone, K. R., Sloat, D., Sein, M., and Davey, H. W.
(1947). /. Nutrition 33, 437-457.
Flodin, N. W. (1957). Metabolism Clin. and Exptl. 6, 350-364.
Folin, O. (1905). Am. J. Physiol. 13, 117.
Greenberg, D. M., and Winnick, T. F. (1948). /. Biol. Chem. 173, 199-204.
Hegsted, D. M., and Worcester, J. (1947). /. Nutrition 33, 685-702.
Holt, L. J., Jr., and Snyderman, S. E. (1956). In "Amino Acid Supplementation"
(W. H. Cole, ed.), pp. 60-68. Rutgers Univ. Press, New Brunswick, New Jersey.
Jones, E. M , Baumann, C. A., and Reynolds, M. S. (1956). /. Nutrition 60, 549- 562.
Leathern, J. H. (1958). Recent Progr. in Hormone Research 14, 141-182.
Leverton, R. M., Brodovsky, E., Chaloupka, M., Ellison, J., Gram, M. R., Gesch- wender, D., Johnson, H., Mitchell, A., Pazur, J., and Schmidt, F. (1956). /.
Nutrition 58, 59-81, 83-93, 219-229, 341-353, 355-365.
Mitchell, H. H. (1929). Natl. Research Council Bull. No. 67.
Mitchell, H. H. (1947). Arch. Biochem. 12, 293-300.
Mitchell, H. H. (1954). Abhandl. deut. Akad. Laudwirtschaft 5, 279-325.
Mitchell, H. H., and Block, R. J. (1946). /. Biol. Chem. 163, 599-620.
Munro, H. N. (1956). Scot. Med. J. 1, 285-293.
Nässet, E. S. (1957). J. Nutrition 61, 555-569.
Osborne, T. B., Mendel, L. B., and Ferry, E. L. (1919). /. Biol Chem. 37, 223- 229.
Oser, B. L. (1951). /. Am. Dietet. Assoc. 27, 396-402.
"Protein Requirements." (1957). Report of Committee of Food and Agricultural Organization of the United Nations, Nutritional Studies No. 16.
Rittenberg, D. (1948-1949). Harvey Lectures 44, 200-219.
Rose, W. C. (1936). Physiol. Revs. 18, 109-136.
Rose, W. C. (1957). Nutrition Ahstr. 6- Revs. 27, 631-647.
Rosenberg, H. R. (1957). /. Agr. Food Chem. 5, 694-700.
Scrimshaw, N. S., Squibb, R. L., Bressani, R., Behar, M., Viteri, F., and Arroyave, G. (1957). In "Amino Acid Malnutrition" (W. H. Cole, ed.), pp. 28-59.
Rutgers Univ. Press, New Brunswick, New Jersey.
Sebrell, W. H., Jr., and McDaniel, E. J. (1952). /. Nutrition 47, 477-486.
Seeley, R. D. (1945). Am. J. Physiol. 144, 369-377.
Smuts, D. B. (1935). /. Nutrition 9, 403-433.
Sure, B. (1957). /. Agr. Food Chem. 5, 463-464.
S wendseid, M. E., and Dunn, M. S. (1956). /. Nutrition 58, 507-517.
Terroine, E. F. (1936). Quart. Bull. Health Organization League of Nations 5, 427-492.
Whipple, G. H. (1948). "Hemoglobin, Plasma Protein and Cell Protein: Their Production and Interchange." American Lecture Ser. No. 11. C. C Thomas, Springfield, Illinois.
Whipple, G. H., Robscheit-Robbins, F. S., and Miller, L. L. (1946). Ann. Ν.Ύ.
Acad. Sei. 47, 317-326.