ROLANDNAGY*1 ANDISTVÁNSZALAI1
1Institute of Mechatronics Engineering and Research, University of Pannonia, Gasparich Márk utca 18/A, Zalaegerszeg, 8900, HUNGARY
This article describes the design of a vibration data acquisition system which can be mounted on the undercarriage of a vehicle to acquire information about the quality of and defects in road surfaces. It is important to be able to deduce the condition of a road section from its data. For practical reasons, a microcontroller-based control unit was used and a separate power supply created. Bumps in the road were detected by a piezoelectric accelerometer. Once the system was completed, different measurements were made and the results analyzed. According to the results, it can be stated that the whole system worked well since they are identical to reality. The bumps in the road were clearly visible on the diagrams. It was concluded that the completed vibration data acquisition system is more than capable of detecting bumps in roads. The advantage of the system is that it can be easily mounted on any car which does not need to be driven at low speeds.
Keywords: road vehicle, vibration, data acquisition, microcontroller, accelerometer
1. Introduction
Road vehicles are continuously subjected to vibrations which have very important and serious consequences.
These vibrations should be dampened as they have a detrimental effect on both mechanical properties and ve- hicle occupants. Vibrations can significantly reduce the lifetime of mechanical and electrical components. The ef- fects of degradation are greatly increased if the frequency of the vibration is identical to that of a component. These resonances cause health issues for passengers in the car, e.g. back pain is a frequent complaint. Vibrational fre- quencies of between4and8Hz are the most dangerous for the human body [1].
Such vibrations can be caused by poor road surfaces and the engine of a car. The former reason is more signif- icant, so this issue will be tackled. Due to the important role of vibrations that can occur in road vehicles, it is important to know the condition and characteristics of a road network.
In Hungary, the measurement of road quality is based almost exclusively on visual observations and manual data recording. Inspectors observe the roads and record any defects in a database. Even though hardly any auto- mated survey equipment is used, these vehicles have the advantage of faster assessment and more objective evalu- ation. The purchase of one of these automated measure- ment systems could cost hundreds of millions of Hungar-
*Correspondence:nagy.roland@mk.uni-pannon.hu
ian forints [2].
Our goal is to design and build a vibration data ac- quisition system that can be used on road vehicles. The system should easily be mountable on any vehicle and measurements recorded at any speed. The system should be simple, but the measurement results must contain in- formation about the quality of the road section [3].
2. Experimental
2.1 Tools of implementation
First, a design analysis was carried out and the structure of the system designed accordingly. A compact and light design is important, moreover, the housing should be suf- ficiently massive. Reliability and a constant sampling rate are also crucial. A block diagram of the system is shown inFig. 1.
The system is based on an ATMega328P Microcon- troller. The device is optimal for the control task as it supports several communication standards to connect the units to each other as well as possesses an inner A/D converter, PWM channels and several digital pins. The main microcontroller is responsible for managing com- munication between the individual units and handles the input data. A 16 MHz external oscillator IC is necessary to generate the clock signal and the supply voltage has to be stabilized at5V. As the microcontroller possesses a watchdog timer, a reset button is unnecessary. Along
with it, due to stable and robust operation, a pull-up re- sistor was placed in connection with the microcontroller’s reset pin. In addition, an FTDI connector is placed near the microcontroller which enables it to be programmed in the programming language C++. The wiring diagram of the ATMega328P Microcontroller is shown inFig. 2.
Vibrations caused by road defects were detected by a 805M1-0020 piezoelectric accelerometer. The sensitiv- ity of the sensor is100 mV/g with an offset voltage of 2.5V. Previous studies suggest that accelerations of up to 2gare expected, and because the analog-to-digital con- verter has a measuring range of0−5V, a voltage gain of approximately16dB was necessary to ensure the ana- log signal fill the measuring range. For this purpose, an INA128P instrumentation amplifier was used, where the voltage gain was determined by the external resistorRG between pins1 and 8. The measuring amplifier ampli- fied the potential difference between the two inputs. In this case, due to the2.5V offset voltage of the acceler- ation sensor, a voltage reference IC that provided2.5V was used. This voltage reference was connected to the
Figure 2:A wiring diagram of the ATMega328P Micro- controller
inverter input of the amplifier, which caused the ampli- fication to change linearly under different accelerations.
An AD580 voltage reference IC was used. The output of the instrumentation amplifier is referred to as the output reference terminal. With2.5V connected to this pin, the offset voltage of the analog signal was in the middle of the measuring range. A wiring diagram of the amplifying section is shown inFig. 3.
Following the amplifying section, the analog signal was digitized. Due to the increase in resolution, the volt- age resolution was 5000/4096, therefore, a change in voltage of1.22mV was detected instead of the previous 5mV. The MAX186 is a successive-approximation con- verter with 8-channel single-ended or 4-channel differen- tial inputs. The single-ended input mode was used, so the input signal voltages are referred to as AGND. It should be noted that the device worked in unipolar mode, there- fore, an analog input signal of between 0V and VREF could be converted. VREF was5V in our application [4].
Firstly, in terms of programming the MAX186 pro- cess, the parameters were set with the first 8input bits.
These bits were expected to shift synchronously with the clock signal. Once set up, the bits of digitized signal could be read out. The read-out process consisted of a12- times repetitive ‘For cycle’, which reads out the digitized value bit by bit. It can be seen that the microcontroller ob- tains the value of the most significant bit (MSB) first. All the input bits have to shift left and must connect to each other with a Logical OR connection to yield the original measurement of the accelerometer. Eventually, the con- version process ends with the A/D converter chip select pin level changing to logic HIGH. A wiring diagram of the MAX186 is shown inFig. 4.
In addition to the accelerations, the GPS coordinates were also collected to help identify road humps and pot- holes that were detected by the accelerometer. For this task, a NEO-6M GPS module was used that provides mo- mentary velocity and altitude data in addition to longi- tudinal and latitudinal coordinates. To control this GPS module, another ATMega Microcontroller was installed which was necessary as a debugging process associated with the GPS communication was present. Its purpose was to verify the adequacy of the data and the connec- tion with the satellites. As a result, the running time and sampling rate of the program cycle became quite slow.
Figure 4:A wiring diagram of the Analog-to-digital con- verter
Following the installation of a second microcontroller, the program could be run synchronously, which a sin- gle ATMega328P Microcontroller would have been un- able to do. As a result, the main microcontroller could be defined as the Master and the controller that controls the GPS as the Slave. The GPS unit communicated with the Slave controller by using a standard universal asyn- chronous receiver-transmitter (UART).
The two microcontrollers were connected by a BUS system, using the I2C protocol which could only handle 8bits of data in one cycle that corresponded to a number between0and255in the decimal system. As the GPS co- ordinates had to be transferred, which were16bits long in the binary system, these needed to be converted into3 bit arrays that each contained8bits of data. The C++ pro- gram of the Slave controller handled these numbers in the binary system. First, it executed the Right Shift by a16- bit command, which was followed by the bitwise AND command, masked by 0xff, the hexadecimal number FF.
In this way, the first array was obtained, followed by the second array with a Right Shift using an8-bit command and finally the last array by masking only. No conver- sion was needed for data concerning speed and elevation, because these values were only8bits long. The Master controller decoded the input arrays to the original 16-bit- long data. The data from the first input array had to Left Shift by8bits then perform a bitwise OR operation us- ing the 8 bits of the following array to yield the original 16-bit-long data. Therefore, the GPS data from the Slave controller immediately became available, resulting in a much faster sampling frequency.
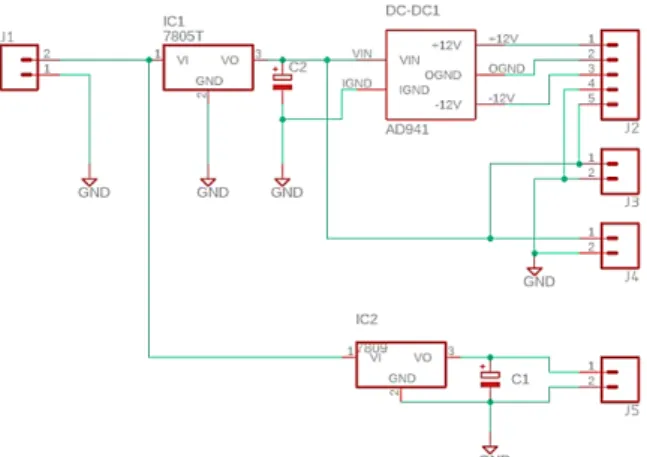
Figure 5:A wiring diagram of the power supply unit
Throughout the measurement process, the accelera- tion and GPS data were collected on an SD card using an ARM-MCU SD card module slot socket reader, which communicated with the Master controller by applying a standard SPI interface.
The Master controller’s C++ program specified the sampling frequency of the accelerometer, i.e.60Hz, but is only suitable up to30Hz according to Shannon’s law.
The power supply of the system was provided by its own integrated power supply. A maximum of35V could be connected to the power input connection of the power supply, thus, the system could be connected to the car’s cigarette lighter. A NEE 78H05ASC voltage regulator converted5V from the input voltage. As±12V needed to be supplied to the instrumentation amplifier, an AD941 DC-DC converter was used to convert5 V into±12 V.
Furthermore, 5 V was available from the output of the power supply unit to supply the microcontrollers, other units and sensors. A wiring diagram of the power supply unit is shown inFig. 5.
2.2 Construction of the system
After designing the system and circuit diagrams, a printed circuit board was planned. Given the complexity of the panels, a double-sided PCB was designed. All of the in- tegrated circuits (ICs) were used with the housing of the Dual Inline Package (DIP). The design rules were set for a CNC machine as the PCBs were handled using an en- graving needle. The width of the wiring track was0.9mm at5V and 1.3mm at12V. The clearance between the wiring tracks and solder pads was1mm and0.4mm, re- spectively. By taking into account insulation against elec- trical noise, larger copper surfaces were left on both sides of the PCB and placed on ground potential. The PCB was designed using Eagle CAD software.
After the design process, the CAM programs were generated from CAD files. PCB panels were made by an ISEL ICP 4030 3-axes CNC-milling machine. All parts of the system were placed in an IP-protection box. Two switches were placed on one side of the box, enabling the
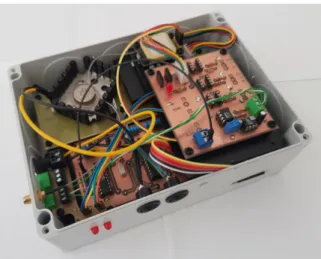
Figure 6:The completed data acquisition system
system to be turned on and the data acquisition process started. The complete system is shown inFig. 6.
To check the output signal waveform in the relevant frequency bandwidth, a frequency response function of the amplifier unit was applied. The input signal was in the form of a sine wave within the frequency bandwidth of 10 Hz to 3 MHz with an amplitude of 40 mV. The data obtained is shown inFig. 7. The natural frequency was approximately700kHz, so the frequency response function of the system performed well in the relevant fre- quency bandwidth.
Furthermore, amplification of the instrumentation amplifier was checked. The frequency of the input signal was5Hz with an amplitude of400mVpp and an offset voltage of2.5V. The amplification factor was set at6.5 V/V. The data obtained is shown inFig. 8. By plotting the data, the difference between the amplified and orig- inal signals can be seen. The waveform of the amplified signal was unchanged and by reading the amplitudes it can be seen that the voltage gain (G) was preset to6.5 V/V.
3. Results and Analysis
Following inspections, the sensor was placed in a car and fixed to the rear control arm to avoid the presence of any damping object between the wheel and sensor [5]. After
Figure 7:The frequency response function of the amplifier unit, whereω0= 1Hz
installing the data acquisition system, several measure- ments were carried out by vehicle-to-record data on dif- ferent road surfaces. The results of the measurements are as follows:
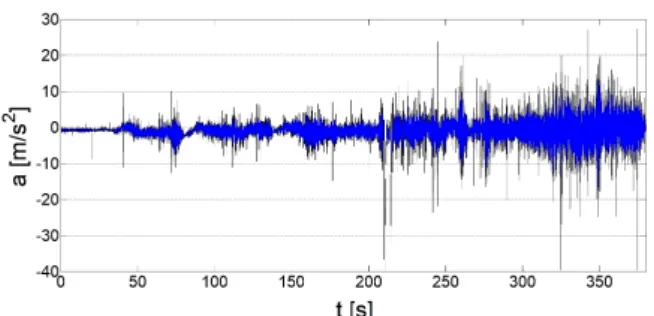
The first measurement was taken in the vicinity of Zalaegerszeg on a5.5 km stretch of road. The data was saved on an SD card as a TXT file and plotted. The GPS coordinates helped to analyze the data, through which the exact location of each acceleration value was determined.
The voltage gain was set at16dB (6.5V/V) [6] and the data from the accelerometer was visible on the diagram without amplification. From the first route, whilst driving in a populated area at the beginning of the measurement period, it can be concluded that the quality of the road surface was generally good with only a few significant potholes and cracks. Later, while leaving the town, the poorer quality of the road became immediately obvious given the increase in amplitudes. The road surface con- sisted of flange grooves and creases. According to the dia- gram, road defects continued to increase since the highest accelerations occurred towards the end of the measure- ment period. The acceleration data from the first mea- surement period is shown inFig. 9.
The conditions of the second set of measurements were the same as those of the first. The initial section of this measurement period was identical to that of the first set of measurements (Fig. 10). The quality of the road surface was initially quite good as only accelerations of1 gwere recorded, but after leaving the populated area, the quality of the road surface also deteriorated. At the end of the route, several wearing courses, bonding layers and spotting errors were identified on the road surface.
The third stretch of road was 3km long. Compared to the other measurements, the quality of the road surface here, which was covered in potholes, patches and surface sinks, was the worst. Consequently, inFig. 11, almost all the accelerations reached the limit of1g, moreover, for a moment, accelerations of2g were also recorded. The right side of the diagram shows that when arriving in a populated area, the amplitudes reduced significantly as the quality of the road substantially improved. Only mi- nor cracks were visible on the surface.
A small degree of asymmetry can be observed in the graphs, which is caused by the car’s shock absorbers. As
Figure 9:The acceleration of the first set of measurements plotted as a function of time
Figure 10:The acceleration of the second set of measure- ments plotted as a function of time
Figure 11:The acceleration of the third set of measure- ments plotted as a function of time
the damping force of the shock absorbers is less in the negative direction, higher accelerations might occur than in the positive direction. This is also supported by the characteristics of the shock absorbers.
4. Conclusion
The aim of our research was to design, build and program a vibration data acquisition system suitable for measuring the quality of a motor vehicle. This task involved numer- ous requirements: the measuring system had to function
was made. The advantages of the system are that it can be easily mounted on any model of car and does not require driving at low speeds.
Acknowledgements
This research was supported by the European Union and co-financed by the European Social Fund under the project EFOP-3.6.2-16-2017-00002.
REFERENCES
[1] Souissi, H.; Hamaoui, A.: Effect of Human Ex- posure to Whole-Body Vibration in Transport, Neuroergonomics, 2018, 229 DOI: 10.1016/b978-0-12- 811926-6.00049-x
[2] Szántó, M.: Közúti adatbázisok valós idej˝u fris- sítése közösségi megoldás alkalmazásával, Útügyi Lapok, 2017, 5(1), 13-19 http://utugyilapok.hu/
wp-content/uploads/2017/06/ul_5_c2_SZM.pdf
[3] Brown, J. C.; Robertson, A. J.; Serpento, S. T.:
Motor Vehicle Structures (Butterworth-Heinemann) 2001, 4–84ISBN: 978-0-7506-5134-9
[4] William, B.: Programmable Logic Controllers, (El- sevier Books)2015ISBN 01-28-0-2929-3
[5] Bidgoli, M. A.; Golroo, A.; Nadjar, H. S.; Rashid- abad, A. G.; Ganji, M. R.: Road roughness measure- ment using a cost-effective sensor-based monitoring system,Automat. Constr., 2019,104, 140–152DOI:
10.1016/j.autcon.2019.04.007
[6] Kennedy, J.; Oakley, C.; Sumon, S.; Parry, I.;
Wilkinson, E.; Brown, J.: Impact of road humps on vehicles and their occupants,TRL Report, 2004, 614, 3–16 https://trl.co.uk/sites/default/files/
TRL614%281%29.pdf