CHAPTER 8
Food Energy and the Metabolism of Nitrogen
1 P E A R L S W A N S O NDepartment of Food and Nutrition, Iowa State College, Ames, Iowa Page
I. Introduction 195 II. Influence of Total Energy Value of Diets on Protein Metabolism . . . . 197
A. Effect of Protein-Containing Diets When Fed to Adult Subjects . . 197
B. Effect of Varying the Protein Stores of the Animal 198 C. Effect of Protein-free Diets When Fed to Adult Subjects 199
D. Effect of Varying the Sources of Food Calories 199 III. Influence of Nonprotein Calories on Endogenous Nitrogen Metabolism 201
A. Experimental Conditions 201 B. Dietary Fat and Nitrogen Catabolism 202
C. Level of Caloric Intake 205 D. Quantity of Fat in the Diet 205 E. Patterns of Catabolism and Survival 206
F. Body-Sparing Properties of Various Fats 209 G. Components of the Fat Molecule 211
H. Pathways of Metabolism 214 I. Role of Methionine 217 IV. Summary and Comments 219
References 222
I. INTRODUCTION
The demonstration by Magendie in 1816 of the unlike nutritive value of the three major groups of foodstuffs (Magendie, 1816) spearheaded, in the latter half of the nineteenth century, an era of research activity relating to the influence of the nonprotein calories of the diet on the course of protein metabolism. The literature is dotted with the names of the great investigators of the period—Bischoff, Rubner, Voit, Lusk, At- water, and many others. It is not surprising that the work of men of this caliber culminated in concepts that have been more or less generally accepted even up to recent times. Many have the familiarity of textbook statements. For example, we may read: Protein is metabolized less eco- nomically as a sole dietary constituent than it is in the presence of car- bohydrate or fat; although both carbohydrate and fat have protein- sparing characteristics, carbohydrate is the more efficient of the two;
the nonprotein foodstuffs spare protein by virtue of their caloric prop-
1 Paper, No. J-3596 of the Iowa Agricultural and Home Economics Experiment
Station, Ames, Iowa; Project 995.
195
erties; and the total energy value of the diet determines the level at which the protein metabolism proceeds.
A bringing together, however, of the old and the new literature sug- gests that many factors not appreciated by the early workers in the field influence the effect nonprotein calories may exert on protein metabolism (Munro, 1951). As a result, the picture has been enlarged, many of the seeming contradictions cleared, and inconsistencies with the isodynamic law explained. But at the same time, new problems and new questions have arisen.
The better understanding that has come in recent years of the role of calories in the regulation of nitrogen metabolism has its roots in our concept of the living cell as a steady or dynamic system rather than as one of equilibrium (Schoenheimer et al., 1939). And as such, it is an open system; materials enter and leave and the state is determined by kinetic factors—a situation quite in contrast to the closed state of a ther- modynamic equilibrium (San Pietro and Rittenberg, 1953). This dynamic state has been viewed as an ebb and flow of nitrogenous constituents from one tissue to another (Whipple, 1948). In this system, both dietary and tissue proteins contribute amino acids to a metabolic pool which supplies in turn all of the amino acids needed for both anabolic and catabolic processes. Actually this pool represents the "summation of pro- tein metabolism in many centers integrated into the dynamic state of the body as a whole" (Allison, 1957).
In addition, certain tissue proteins notably those of the liver, in- testines, and plasma are more labile than others and have, in addition, the capacity of holding in reserve varying amounts of protein. In this fluidity of the protein metabolism and its immediate response to physi- ological, dietary, and environmental variables is found the body's adap- tive abilities and its power to shift the course and the intensity of metabolic processes in response to normal, subnormal, and surfeit condi- tions of various origins.
Within this conceptual framework, it, therefore, becomes imperative to define observations relating to the influence of nonprotein calories on the protein metabolism in terms of the experimental conditions imposed
—the age of the test animal, its physiological condition, the size of the stores of protein, fat, and glycogen within its body, the relative adequacy of the diet offered, and the scheme of the dietary regime to which the test animal is subjected including pre-feeding techniques, duration of the experimental period, and length of intervals between dietary phases of the experiment.
FOOD ENERGY AND THE METABOLISM OF NITROGEN 197
II. INFLUENCE OF TOTAL ENERGY VALUE OF DIETS ON PROTEIN METABOLISM
Recent studies (Rosenthal and Allison, 1951; Calloway and Spector, 1955; Forbes and Yohe, 1955; Schwimmer and McGavack, 1948; Leverton et al., 1951) emphasize the importance of balance between the energy- producing and protein components of the diet in protecting the integrity of body tissue under normal conditions. Labile protein in body reserves through catabolic processes provides energy as well as amino acids in support of activities both anabolic and catabolic, in the metabolic pool.
In general, a restriction in the energy value of the diet is associated with an increased catabolism of labile protein in the effort of the animal to correct the caloric deficiency in the metabolic pool.
Conversely, increments in food energy value permit improved utiliza- tion of food nitrogen for synthesis and conservation of body protein, but there appears to be an optimum caloric intake associated with maximum retention at various levels of dietary protein (Calloway and Spector, 1954).
Also an optimum level of calories seems to exist for the maintenance of an efficient balance between fat stores and lean body mass (Allison and Wannemacher, 1957). For example, puppies gained essentially the same body weight per gram of nitrogen ingested on diets containing either egg protein or wheat gluten as a source of protein. The puppies fed wheat gluten, however, retained only 0.08 gm. of nitrogen per gram of nitrogen intake whereas those given egg protein retained 0.5 gm. per gram of nitrogen consumed. The gluten-fed puppies were obese and inactive; the egg protein-fed animals, lean and active.
Whether catabolism or anabolism predominates in the body following caloric restriction depends on the degree to which the energy value of the diet has been reduced, the quantity and nutritive value of the dietary protein, the physiological state of the animal in respect to body reserves of protein and fat, the age of the animal, and in some instances the dietary sources of energy. It is not difficult to see therefore, that no one metabolic picture defines the response of an experimental animal to a reduction of food energy. However the many and complicated metabolic adaptations that an animal may make under various conditions of caloric restriction are becoming clear as evidence accumulates in various lab- oratories. Emerging concepts have been summarized by Allison (1958).
A. EFFECT OF PROTEIN-CONTAINING DIETS WHEN FED TO ADULT SUBJECTS
When food ingested is of constant protein value and body stores of protein are filled, reduction of food energy below the amount needed for maximum protein anabolism results first in a state marked concomitantly
by an increased catabolism of body protein and continued efficiency of utilization of food protein for anabolism—as shown by negative nitrogen balance and no alteration in the value of the nitrogen balance index of the dietary protein (Allison et al., 1946). Tissue synthesis reflecting such utilization may occur even with extreme reduction of caloric value when the protein content of the diet is low (Allison et al., 1946; Swanson, 1951;
Benditt et al., 1948; Cox et al., 1953). But the body will burn any addi- tional protein added to the diet as fuel, if caloric restriction is continued
(Allison et al., 1946; Swanson, 1951).
B. EFFECT OF VARYING THE PROTEIN STORES OF THE ANIMAL
That there are alternative pathways in metabolism is illustrated by differences in the way in which animals with full and depleted body stores of protein respond to a caloric deficiency.
Caloric requirements are maximum when protein stores are filled.
With restriction of food energy, an animal possessing such stores will dip deeply into its reserves, catabolize them for energy, eliminate in the urine nitrogen arising in the process, and thereby slip into nitrogen deficit even though there may be simultaneous anabolism of food pro- tein (Rosenthal and Allison, 1951).
As body stores of labile protein are reduced following restrictions in the energy value of the food provided, the caloric requirement seems to decrease permitting more effective utilization of amino acids for anabolic processes (Rosenthal and Allison, 1951, 1956). Thus, with continued limitation of calories some adaptation seems to occur, as shown by drifts toward equilibrium and even in some instances, attainment of a positive nitrogen balance.
Indeed, the first response of a protein-depleted animal to protein feeding and a deficiency of calories may be positive nitrogen balance.
However, such adaptations as occur are but transitory. Eventually in its search for sources of energy, the organism is forced to burn not only food but tissue protein for fuel, as shown by an alteration in the nitrogen balance index and a markedly increased negative nitrogen balance. The increased catabolism leads to irreversible tissue changes, exhaustion, and finally, death of the animal.
Resistance to the final damaging response in which both food and body nitrogen are used for energy purposes is much greater under the stress of reduced calories when initial body reserves are full rather than depleted.
The filling of reserves in the protein-depleted animal presents another interesting example of protein-calorie relationships. Allison and Wanne- macker (1957) present clear-cut evidence showing that "the filling of the
FOOD ENERGY AND THE METABOLISM OF NITROGEN 199
protein reserves must be described in terms of three dimensions; namely, (I) the nutritive value of the dietary protein, (2) the nitrogen intake, and (3) the caloric intake."
C. EFFECT OF PROTEIN-FREE DIETS WHEN FED TO ADULT SUBJECTS
The catabolism that follows the feeding of a protein-free diet repre- sents, after the initial adjustment, an endeavor on the part of the organism to secure nitrogenous metabolites essential for the maintenance of life
(Brush et ah, 1947). Labile stores of nitrogen are first drawn upon and then, upon their exhaustion, the more stable masses of body protein.
When protein-free diets are administered to adult rats, nitrogen balance does not serve as a sensitive indicator of the energy content of the diet. Altering the caloric consumption of adult rats in a range close to the maintenance requirement has very little influence on the quantity of nitrogen excreted in the urine (Mitchell, 1924; Treichler and Mitchell, 1941). Only with marked reductions in caloric value of the diet are there increments in nitrogen output.
With standardized protein-depleted rats, a catabolism greater than that characteristic when the full-calorie protein-free diet is fed does not occur until the calories have been reduced by more than one-half (Will- man et al., 1947). Human subjects consuming protein-free diets respond similarly to decreases in the energy value of the food (Johnson et al.9 1947; Calloway and Spector, 1954).
The dog appears to have the capacity to react favorably to super- maintenance levels of energy-producing foods when subsisting on a protein-free ration (Allison and Anderson, 1945).
D. EFFECT OF VARYING THE SOURCES OF FOOD CALORIES
The relative efficiencies of carbohydrate and fat in the sparing effect of nonprotein calories on the utilization of protein and on the course of nitrogen metabolism have been studied under a variety of experimental conditions over the years (Munro, 1951; Maignon, 1933). The adaptive responses and variations in metabolic mechanisms, already discussed as functions of the energy and protein values of the diet, explain in part at least, divergence and confusion in data reported in the literature con- cerning the respective values of carbohydrate and fats in protecting the protein metabolism.
The preponderance of evidence to date suggests that, in general, the nitrogen-conserving effects of carbohydrate and fat calories are equiva- lent in normal adult animals when diets contain protein, providing meas- urements of retention are made for sufficiently long periods of time. The increase in urinary nitrogen that has been observed when fat is ex-
changed isocalorically for carbohydrate appears to be a transitory phenomenon (Thomson and Munro, 1955).
The equivalence in the protein-sparing effects of carbohydrate and fat is apparent in rats at various levels of caloric intake (Calloway and Spector, 1955; French et ah, 1948) and in dogs receiving 50% or more of their food energy requirements (Allison et al, 1946; Rosenthal, 1952).
In the case of the dog, neither the utilization of the dietary protein (nitrogen balance index) nor the rate of catabolism seems to be altered with changes in the fat content of the diet when its caloric value is optimal (Rosenthai, 1952). However, when the intake of energy food meets only 25% of the requirement, both the utilization of dietary protein and the nitrogen balance are affected unfavorably if the diet is rich in fat—a response that is offset when dietary protein is increased.
Some of the contradictions in the literature have been cleared by observations that separation in time of eating the protein and carbo- hydrate components of the food results in a deterioration of the nitrogen balance (Cuthbertson and Munro, 1939; Geiger et al., 1950; Munro, 1949). Thomson and Munro write that the initial accelerating effect on nitrogen metabolism of the isocaloric substitution of fat for carbohydrate may be due essentially to removal of carbohydrate from the protein- containing meal and not to an adverse effect of feeding fat with protein
(Thomson and Munro, 1955).
These observations, together with others on the influence of surfeit isodynamic amounts of either fat or protein superimposed on adequate basal diets, led Munro and Wikramanayake (1954) to conclude that utilization of protein is affected in two ways by the carbohydrate present in the diet. The first effect is specific, and is one not observed with lipids. A close proximity in time of eating carbohydrate and protein is necessary if retention of nitrogen is to be influenced favorably. The sec- ond effect is nonspecific; carbohydrate and fat act interchangeably as energy sources in sparing protein and to exert this sparing action do not need to be taken along with dietary protein.
It has been more or less accepted from limited evidence reported in the early literature that when rations are deficient in protein, nitrogen metabolism proceeds with less detriment to the animal when high-carbo- hydrate rather than high-fat diets are ingested (Landergren, 1903; Cath- cart, 1922). However, diets were inadequate in many respects, and it was not always recognized that response is a function of the total energy value of the diet and physiological reserves of fat, glycogen, and labile protein.
More recent evidence indicates that fat possesses, under specific ex- perimental conditions, nutritive properties over and beyond the furnish-
FOOD ENERGY AND THE METABOLISM OF NITROGEN 2 0 1
ing of energy that are not exhibited by carbohydrate (Swanson, 1951;
Willman et al, 1947; Swanson et al, 1959).
The response of protein-depleted rats to the simultaneous elimination of dietary protein and restriction of food calories, as observed in the Iowa State College laboratories, is providing evidence of the inextricable interweaving of the nitrogen and energy metabolism and an interesting opportunity to study alterations in metabolic pathways which may occur when stress conditions are imposed.
III. INFLUENCE OF NONPROTEIN CALORIES ON ENDOGENOUS NITROGEN METABOLISM
A. EXPERIMENTAL CONDITIONS
Adult male rats of Wistar strain, with body reserves of labile protein reduced under standard conditions, were the reactors in the Iowa State College experiments to the triple stress of previous protein-depletion, continued feeding of a diet devoid of protein, and insufficient food energy.
Two basic diets were used—one containing 20% of fat with the lipid constituent in most cases providing about 36% of the total calories; the other, nearly fat-free. Although the caloric densities of the two rations differed, quantities of food consumed equalized the caloric values of the food ingested each day when the two diets were fed ad libitum (Table
TABLE I
COMPOSITION OF LOW-NITROGEN BASAL DIETS
High-fat diet Low-fat diet
Dietary components (grams) (grams) Dextrin 73 93 Lard 10 0 Butterfat 10 0 Osborne & Mendel salts 4 4 Sodium chloride 1 1 Ruffex 2 2 Calories per gram 4.8 3.8 Average calories provided per day, 49 (18 rats) 49 (36 rats)
ad libitum ingestion
1). These basal diets were supplemented daily with all of the known vitamins including choline and with 50 mg. of cottonseed oil as a source of essential fatty acids.
Various sources of fat have supplied the fat moiety over the course of the experiment. We have used a mixture containing butterfat and lard in equal proportions, Wesson oil, butterfat alone, lard alone, pure cot- tonseed oil of known origin and composition, a low-pressure distillation
fraction of cottonseed oil, a low pressure distillation residue of cotton- seed oil, and three preparations of a partially hydrogenated cottonseed oil. A mixture of butterfat and lard served as the source of fat in the first series of experiments.
The rats were maintained on the two protein-free diets offered ad libitum until stabilization of nitrogen excretion showed adjustment to lack of dietary protein (Swanson, 1951). It was believed that steady excretion of nitrogen signified a reduction not only in the size of body stores of protein but in their catabolic activity. Excretion of urinary nitrogen was fairly constant from the nineteenth through the thirty-fifth day of protein restriction. Metabolism experiments involving caloric re- duction were conducted in this interval.
The first nitrogen balance test, initiated on the nineteenth day, cov- ered a period of 5 days, the animals having full access to one of the nitrogen-low rations. This experimental interval is designated as Period I in the tables in which data are presented.
In many experiments the animals in both the high-fat and low-fat groups were divided into two groups at the end of Period I. The first group received daily a quantity of food that represented the average amount consumed ad libitum per day during the first balance test, i.e., adequate calories. The second group received a quantity of food reduced to some fraction of the amount consumed in Period I, i.e., restricted calories. Each group was maintained on the designated dietary regime for 4 days—an interval long enough to permit adjustment of the animals on reduced caloric intakes to the new dietary manipulation. Then nitro- gen balances were again determined for either one or two intervals, each 5 days long (Periods II and III).
The plan permitted comparisons of the performance of a single group of rats receiving full or restricted calories (longitudinal) as well as com- parisons between different groups fed the two diets in exactly the same interval of the experiment (cross sectional). Except in survival studies all experimental groups throughout the entire investigation contained at least 6 rats.
Due to the uniformity of the nitrogenous composition of the fecal excretions under the experimental conditions imposed, urinary nitrogen excretion only was used as the index of response to the test diets in some of the experiments.
B. DIETARY FAT AND NITROGEN CATABOLISM
That a mixture of butterfat and lard consistently exerts a specific sparing effect on the nitrogen catabolism of a standard protein-depleted rat is clear from data presented in Table II covering seven years of study,
TABLE
II F GROUP O BALANCE NITROGEN MEAN AND NITROGEN URINARY MEAN
S O F RAT S PARTIALL Y DEPLETE
D O F BOD Y RESERVE S
OF PROTEI N
WH EN L OW -F AT AND H IG H-F AT RATIONS AR
E FE D*
Group A B A B
Source o f dat a
All rat s livin g an d non
- f ex d o t en moribund a - ) 0 rats periment (6
Rats meetin g specifi
c a physiological criteri
All rat s livin g an d non
- f ex d o t en moribund a - ) 4 rats periment (4
Rats meetin g specifi
c a physiological criteri
Adequate calorie a
s i n Perio
d I . d lard t an of butterfa
Date
of ment experi-
Period I
Urinary nitroge n (m
i
1946 1947 1947 1950
1952 Mean
1950
1952 Mean
190 178 220
148
149 177
151 151
151
Low-fat ratio n
Period II
illigrams pe r i
679 585
685 695 478
624
395 386
390
Nitrogen balance s (milligram
s pe r
1946 1947 1947
1950 Mean
1950
—310
—225
—285
—246
—266
—241
—724
—725 —635 —739
—706
—434
and restricte d calorie
s i n Perio d II ,
Increase i n I to Period I catabolism: Period I
5 days )
489 407
465 547
329 447
244 235
239 5 days )
414 500
350
393 440
193
Period I
236 207
173 207
191 203
173 193
183
—231 —235 —303 —239 —252
—239
and wit h dietar y fa t ]
20%-fat ratio n
Period II
406 390
388 313
444 388
313 377
345
—418
—412
—417
—343
—397
—343 provided b y ι
Increase i n I to Period I catabolism: Period I
170 183
181 140 253
185 140
184 162
187 177
114
104 145
104 a 1:
1 mixtur e
**i O
o
Ö M O
>
z Ü H
B s
s §
o *1
2 J H
O
o 2
to
8
Restriction of the calories provided by either diet to 25% of the required number is accompanied by acceleration of catabolic activities as shown by comparison of excretions of urinary nitrogen and nitrogen balances in Periods I and II (Group A). But, at this caloric level, incorporation of fat in the diet inhibits the extent of the acceleration. For example, the increase in the negativity of the nitrogen balance is 440 mg. in the 5-day metabolism period for the animals receiving the low-fat diet, and only 145 mg. for the rats maintained on the fat-containing diet.
In this connection, other data show that nitrogen balances vary only in the range of ± 10 to 15 mg. in Periods I and II when the experimental animals are continued on the protein-deficient diet without limitation of caloric consumption in Period II.
However, the possibility that the nitrogen catabolism reflects the physical condition of animals subjected to these harsh experimental con- ditions rather than the diet can not be dismissed. Some rats exhibited severe infections of the lungs at necropsy. Qualitative appraisal sug- gested that size of fat depots varied. Occasionally, animals lost weight precipitously during the period of calorie restriction.
It seemed important, therefore, to restrict comparisons to the healthier individuals in each group. A plan was developed for scoring the physical condition of the animals.
Data pertaining to any rat were withdrawn if two or more of the following conditions prevailed: moderate to severe lung infection, marked loss in weight, or absence of body fat (peritoneal, subcutaneous, and intramuscular). Data describing the remaining animals are sum- marized in Group B, Table II.
Comparisons of Groups A and B show that rats receiving the restricted protein-free diet low in fat in Period II are affected particularly by the withdrawal procedure. However, the distinction between the fat-fed group and those relying on carbohydrate for their food energy is not lost.
Whether this screening of data is justified in the interpretation of results is a moot question. It should be noted that certain of the symp- toms on which the screening was based, represent advanced symptoms of protein deficiency and that the screening especially affected the rats fed the diet containing carbohydrate only. The tearing down of body tissue that occurs in these rats may be a true reflection of a difference in the nutritive value of the carbohydrate and fat diets as fed in this in- vestigation, and may represent inabilities of individual protein-depleted rats to cope with the added insult of omission of dietary fat. Data also show that mortality of the rats fed the high-carbohydrate diet is higher even on full calories than it is among rats receiving the fat diet (Swanson, 1951). We continue to note in recent experiments that the presence of
FOOD ENERGY AND THE METABOLISM OF NITROGEN 2 0 5
fat in the ration in all instances delays death of the animal beyond the experimental period.
C. LEVEL OF CALORIC INTAKE
There is a level of caloric intake associated with the sparing effect exerted by dietary fat on the endogenous metabolism when a mixture of lard and butterfat is used in the ration (Fig. 1). The nitrogen catabolism
+ 50 H o h-
£ -50 h
>»
ω -100 E o -150 o
© -200
ex
Φ
S -300 m σ c -350
a>
σ» o
ί - 4 0 0
Energy Value of Rations in
% of Days Requirement 100 75
J
50 25[S%1 Low-fat Π 20% fat
■ I
■ I
ill III
"1 1
FIG. 1. Nitrogen balances when protein-free rations of varying fat content are fed to protein-depleted rats at different caloric levels.
is not accelerated greatly when the caloric value of the day's ration is reduced to one-half that of the full ad libitum intake, providing the ration contains fat. Such is not the case when the animal must rely on carbohydrate as its source of energy. A 50% reduction in the number of calories furnished by the diet results in a marked increase in catabolic processes, which is accentuated upon further reduction in the energy value of the food intake (Willman et ah, 1947; Swanson et al, 1959).
D. QUANTITY OF FAT IN THE DIET
Also, the quantity of fat in the diet is important in the protective action exerted against the disintegration of body tissue that is induced by severe caloric restriction in protein-depleted rats given rations low in
nitrogen (Willman et al., 1947; Swanson et al.y 1959). Seemingly, the diet must carry at least 15% of fat if it is to exert nitrogen-sparing activity against severe restriction of calories (Fig. 2). In this case, a 1:1 mixture of lard and butterfat represents the lipid component of the ration.
- 50 -100
-200 l·
w - 2 5 0
Φ o.
g -300
I -350 c
-Q
£ - 4 0 0
σ» o
| - 4 5 0 h -500 -550
Colories Ingested in % of Normal Intake
2 0 % Fat 100 75 5025
15% Fat 100 75 5025
10% Fat 100 75 50 25
5 % Fat 10075 50 25
No Fat 10075 5025
"™1
I
FIG. 2. Nitrogen balances following the feeding of protein-free rations of vary- ing fat content and of graded caloric value to protein-depleted rats.
E. PATTERNS OF CATABOLISM AND SURVIVAL
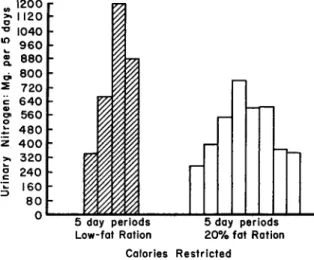
The shifting nature (Rosenthal and Allison, 1956) of the nitrogen metabolism in rats possessing reduced stores of body protein when low- calorie, protein-deficient diets are fed over a prolonged period is ap- parent from the data depicted in Fig. 3 (Fox et al., 1959a; Fox, 1954). However, fat in the diet alters the general metabolic response;
animals receiving this nutrient seemingly have a capacity to adjust both the caloric and protein economies in a way that delays the eventual out- come, death.
The inclusion of fat in the ration (Wesson oil) maintains the catab- olism at a fairly low plane over the entire remaining life span of the rat.
Of interest is the adaptation indicated by the marked reduction in the over-all catabolic activity during the last 10 days of life. When fat is absent from the diet, this final adaptation is not accomplished. Indeed,
FOOD ENERGY AND THE METABOLISM OF NITROGEN 207
early nitrogen losses are insurmountable and death ensues relatively quickly.
Apparently, a total loss in body nitrogen in the neighborhood of 3500 mg. can be tolerated by the protein-depleted animal before death inter- venes after caloric restriction (Table III). However, it is the rate at which this loss occurs that determines length of life, and in this case, we note the favorable influence of dietary fat.
•
,20° r
£ 1120 h
Ό 1040 f-
* 960
• 880 h σ» 800 l·
2 720 c 640 1- S 560 I-
£ 480 z 400
>> 320
| 240 i 160
80
0f 5 day periods
Low-fat Ration 5 day periods 20% fat Ration Calories Restricted
FIG. 3. Mean quantities of nitrogen excreted in urine in successive 5-day inter- vals by groups of protein-depleted rats when the energy value of a protein-deficient diet is restricted to 25% of the requirement (4 rats per group).
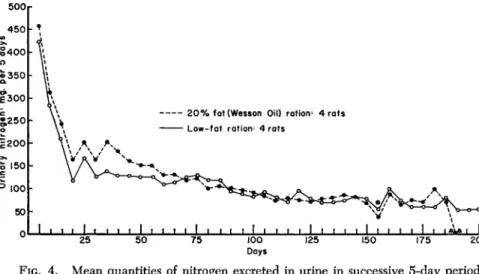
On the other hand, the feeding of a protein-free ration at full caloric value reverses the situation (Fig. 4) and the sparing effect of dietary fat on the endogenous nitrogen metabolism is lost (Fox et ah, 1959a).
The quantity of nitrogen excreted in the urine is greater for a fairly long interval of time (about 70 days) when fat is included in the diet than when it is omitted. At the end of this period, however, catabolism of the fat-fed rats steadies and resembles that of the animals given the carbohydrate diet.
The greater catabolic activity occurring in the initial phases of the test in depleted fat-fed rats receiving ample calories but deprived of protein is reflected in time of survival. The records in Fig. 4 are of special interest in that they show the extent to which the metabolism, both energy and protein, is reduced with the passing of time as the animal attempts to maintain life. It is remarkable that an animal with limited body reserves of protein can survive for as long as 200 days when protein deficiency is imposed. These data also point up, that due
TABLE
III D LOSSE , AN Y NITROGEN N BOD S I D LOSSE E, CUMULATE TIM SURVIVAL S I
N BOD Y WE IG HT OF RAT S FE D VARIOU S DIET
S
FROM T IM E THA T CALORI C RESTRICTIO
N WA S INITIATE D UNTI
L DE AT H
0
Diet Low-fat:
12 Cal./da y
20%
fat: 12 Cal./da y
Number of rat s
4 5
6 8 Mean
35 36
37 38 Mean
Survival o n (days) regime experimental
24 27
31 29 28
42 46
39 46
43
Losses i n bod y nitrogen (mg.
)
Total 3049 2904 3580 3401 3233
3972 4038
3573 3571 3789
Per da y
127 108
115 117
115
95 88
92 78
88
Losses i n bod y ) weight (gm.
Total
114 122
142 135
128
127 141 128
140 134
Per da y
4.8 4.5
4.6 4.6
4.6
3.0 3.0
3.3 3.0
3.1
► a
w j S 3 4
>
1
C/5 o 2
FOOD ENERGY AND THE METABOLISM OF NITROGEN 2 0 9
to the changing nature of the nitrogen metabolism with the progression of time, any statements regarding the relative nitrogen-sparing properties of carbohydrates and fats should take time-intervals in experimental his- tory into consideration.
500|
450
«A
-§400 to
• 350
Q.
£300
| 2 5 0 o i 2 0 0
σ 150
3 100 50
\\ Λ Λ
2 0 % fot (Wesson Oil) ration: 4 rats Low-fat ration: 4 rats
1 1 I 1 1 1 I 1 1 I 1 I I I I 1 I 1 I I I I I 1 I I I I I I t I I I I t \
25 50 75 100 125 150 175 200 Days
FIG. 4. Mean quantities of nitrogen excreted in urine in successive 5-day periods by groups of rats fed different protein-free rations ad libitum. The symbol * denotes that rats began to die at this point. From the 155th day, values are for surviving rats; ΔΔ denotes that all rats receiving the high-fat diet are dead.
F. BODY-SPARING PROPERTIES OF VARIOUS FATS
Some of the divergence of opinion regarding the relative protein- sparing properties of carbohydrate and fat may be traced to the kind of fat used in the formulation of the ration. Fats as a group do not consti- tute a nutritional entity. Sources of the fat components of an experimental diet need to be defined as explicitly as sources of protein. Failure of in- vestigators to recognize this fact has clouded many issues, particularly since specific fats obtainable in local markets vary in nature and com- position from time to time.
Early tests in this laboratory (Fox et al., 1952) suggested that al- though certain irregularities in response were observed, fats derived from various sources may vary in their protein-sparing effect on the endogenous nitrogen metabolism of a calorie-deficient rat.
Replication of the experiments using fats of known origin in rations for which heats of combustion were determined indicated that while body-sparing activity is inherent in all fats, certain fats seem to possess the property to a somewhat greater degree than others (Table IV).
Butterfat and lard each appear to be more effective than either pure
TABLE
IV RATS PROTEIN-DEPLETED BY URINE IN EXCRETED NITROGEN
FOLLOWING CALORIC
RESTRICTION OF A PROTEIN-FREE
CARBOHYDRATE RATIO N AN
D O F RATION S CONTAININ
G VARIOU S INDIVDDUA
L FATS
»
Fat use d in ration
None Cottonseed oi l l Butterfat Lard Wesson oi
Nitrogen excrete d in
urine (mg . pe r
Period I : calories adequate
198 243 240
190 194
Period II : calories restricted
324 448
315 277 278
Period III : calories restricted
774 474 422
355 335
5 days )
Total 10 days : d II Periods II an I
1222
798 737
632 613
Increments i n
From Period I to Perio d I I
81 250
71 87
84
urinary nitroge n (mg.
)
From Period I
I d II to Perio I
326 150
78 107
57
r
I
C/3
$ 2 O 2
FOOD ENERGY AND THE METABOLISM OF NITROGEN 2 1 1
cottonseed oil or a Wesson oil purchased on the local market and of unknown composition.
The greater efficiency of these fats is not apparent immediately upon restriction of calories to 25% of the day's needs (Period II) but builds up with continued maintenance on the low-calorie diet. Thus, butterfat and lard each maintain the increment in urinary nitrogen associated with the prolongation of restricted calorie feeding into Period III at a lower level than is the case when either low-fat or 20% cottonseed oil rations are fed (Table IV). Also, the total nitrogen excreted during the two periods of low-calorie feeding (II and III) by rats receiving either butterfat or lard is about one-half the quantity excreted by the rats on the low-fat diet; that excreted by animals fed cottonseed oil is about two-thirds this amount.
But, it should be noted that the total energy value of the diet in- fluences the relative body-sparing properties of specific fats. For ex- ample, rations in which an oil represents the lipid constituent, accelerate excretion of urinary nitrogen to a greater extent in Period I when full- calorie diets are fed than is the case when the ration contains no fat
(Table IV). These data are in accord with those depicted in Fig. 4.
The samples of pure butterfat and lard used in these experiments do not show this accelerating action, catabolism being of the same order as in the carbohydrate-fed rats.
Thus, as a result of properties possessed by butterfat and lard under the conditions of adequate and restricted feeding imposed in this ex- periment, the total effect of these fats appears to be somewhat greater than that of oils in depressing rate of catabolism.
G. COMPONENTS OF THE FAT MOLECULE
The data presented in Table V may be interpreted to mean that both the saponifiable and nonsaponifiable fractions of a cottonseed oil of known origin are effective in reducing losses of body nitrogen under conditions of semi-starvation and protein deprivation (Fox et al., 1959b).
The nonsaponifiable material fed represented the first of three low- pressure distillation fractions. The amount provided in the ration
(1.25%) was equivalent to the nonsaponifiable substances present in the ration containing 20% of cottonseed oil. The saponifiable materials were in the residue remaining after the removal of the three distillation frac- tions. This residue was incorporated into the diet so as to provide the same quantity of saponifiable material as the 20% cottonseed oil ration.
Both fractions maintain the excretions of nitrogen in the urine in Periods II and III at levels markedly below those characteristic of the rats given the high-carbohydrate diet in the same periods. Differences
NITROGEN EXCRETED
IN URINE
CARBOHYDRATE RATION
TABLE
V RATS PROTEIN-DEPLETED BY
FOLLOWING CALORIC
RESTRICTION OF A PROTEIN-FREE
AND OF RATION S CONTAININ
G VARIOU S INDIVIDUA
L FAT S AN D FA T FRACTION S
fco to
Fatty componen t
Nitrogen excrete d i
n urin e (mg . pe r 5 days)
Total fo
r s o 0 day : 1 d III : Perio d II : Perio Period I n d restricte d restricte adequate restricte d s s calorie s calorie calories calorie Increments i
n urinar y nitroge n (mg.
)
From From Period I Period I
I d II o Perio I t d I to Perio I
(1) Non e 19 8 44
8 77 4 122
2
(2) Cottonsee d oi
l ^ n 24 of ratio 20%
3 32 4 47
4 79 8
(3) First low-pressur e dis
- : tota tillation fraction l n n s i of ratio 1.25% (2) 15 lipid o =0 nonsaponifiable 2 28
7 32 6 61
3
(4) Low-pressure distilla
-f ) 24 % o 0 = 20 e = tion residu ration (saponifiables 8 27
4 34 4 61
8
(5) Nonsaponifiable s plu
s ) plu 3 saponifiables ( s
(4) (6) Butterfat
(7) Butterfa t plu
s ponifiables (3 )
Lard (8)
2 50 8 1
1 35 2 6
3 26 1 50 3 9 70
nonsa- 213
190 178 194
320 277 312 278
307 355 328 335
627 632 640 613
107 87 134 84
—13 78 16 57
E
O
FOOD ENERGY AND THE METABOLISM OF NITROGEN 2 1 3
in the total response to the two fractions is not significant, particularly when it is noted that the large increment in urinary excretion from Period I to Period II in the rats receiving the nonsaponifiable fraction is due to an unusually low excretion of nitrogen in the urine of these rats before caloric restriction. It is interesting that when full calories are fed, the first low-pressure distillation fraction seems to behave like butter- fat and lard in maintaining catabolism at a low level.
However, the data suggest that the nonsaponifiable material, i.e., Fraction (3) in Table V, may possess some chemical entit(y)ies which are useful to the rat in adjusting its metabolic processes when stresses are continued into Period III. The addition of this fraction to the non-
H
^ 300
1
?200
FIG. 5. Increases in urinary nitrogen induced by caloric restriction of various protein-free diets; one contained carbohydrate only as a source of calories and each of the others, a lipid constituent.
saponifiable fraction, to butterfat, or to lard stabilizes excretion as caloric restriction is continued. There is, for example, essentially no increase in the excretion of nitrogen in the urine from Period II to Period III (—13, 16, and 8 mg. per 5 days, respectively).
Degree of saturation of the fat does not seem to be associated with the sparing effect on excessive body protein degradation occurring under the conditions of this experiment (Fig. 5) (Arnrich and Vesely, 1958).
It would seem, in general, that although dietary fats and combina- tions of lipid components may differ in their effectiveness in depressing protein losses, the presence of fat per se may be of greater importance than structural characteristics. If any one constituent is more important than another, the nonsaponifiable fraction might be so considered. Its
high concentration of vitamin E (Fox et al, 1959b) may be responsible for favorable adjustment upon prolongation of dietary stress.
I.V. 9 0 IV. 100 r—1 IV. 70
I Carbohydrate Diet
Cotton- Seed Oil
Saponi- fiable Residue
Hydrogenated Cottonseed Oil 2 0 % F o t Diets
H. PATHWAYS OF METABOLISM
1. Nitrogen
In a series of experiments in which the partition of nitrogen in the urine was studied (Hoover, 1950; Hoover et al., 1949), rations were made into slurries of the same caloric density and portions of each ad- ministered by stomach tube in amounts that provided daily either 56 or 14 calories per 300-gm. rat. Also, groups were fed the full-calorie diet in Period II to permit comparisons in the same interval of experimental history. The fat fed was a 1:1 mixture of butterfat and lard.
Shifts in the relative amounts of the various nitrogenous constituents present in the urine suggest that the use of carbohydrate in a restricted protein-free diet introduces blocks in metabolic patterns (Table VI).
The calorie-starved, protein-deficient rat in the absence of dietary fat is unable to carry acidic intermediaries, that arise in the catabolic release of amino acids, through the metabolic steps required for their utilization.
The acidity of the urine was not measured, but a 10-fold increase in the amount of ammonia excreted is indicative of an excessive elimination of acidic substances, possibly organic acids.
On the other hand, if the caloric value of the diet is adequate, the presence or absence of fat in a protein-free diet fed to rats partially depleted of body reserves of nitrogen does not seem to alter appreciably the pathways of nitrogen excretion (Table VI).
The deteriorating influence of the carbohydrate diet may be seen also in the increase in the amount of creatinine nitrogen, undoubtedly de- picting irreversible breakdown of functional nuclei of the muscle mass.
2. Carbohydrate
Glucose tolerance data presented in Table VII indicate that animals fed the high-carbohydrate diets providing no protein seemingly lose mechanisms important in the metabolism of carbohydrate even before the energy value of the diet is reduced. That the incorporation of fat in diets of adequate energy value preserves these mechanisms also is evi- dent, for utilization of glucose by rats receiving these diets proceeds at an approximately normal rate. But, when the caloric value of the fat diet is reduced, the metabolism of the sugar is retarded. Thus, not only the fat content but the energy value of the diet seems to control the car- bohydrate metabolism of these protein-depleted animals (Hoover, 1950;
Hoover et al, 1949).
The disturbance in the ability of the rats receiving restricted amounts of the low-fat, protein-free diet to utilize carbohydrate may have a parallel in the failure of diabetic animals to handle this nutrient. It is known that diabetic-like syndromes are associated with nutritive inani-
TABLE
VI E O N URIN N I OF NITROGE PARTITION AND BALANCE NITROGEN
F PROTEIN-DEPLETE D RAT
S WH EN PROTEIN-FREE
DIETS
CONTAINING OR DEVOID OF FA T AR E FE D A T TW O CALORI C LEVEL
S I N TH E SECON D 5-DA Y METABOLIS M
TE ST
(PERIOD II)
a
Energy valu e o f die
t I d I in Perio Not restricte d :Q: energ y valu e o f foo
d : 5 d I n Perio provided i 6 y r da Cal. pe
Not restricte d O energ y valu
e o
f d y n Perio r da d i . pe 6 Cal food provide I: 5 Restricted
=£: 1/
4 o f energ y valu
e d i d provide of foo n . pe 4 Cal : 1 Period I r day Restricted
1/4 o z£i
f energ y valu
e n . ped i 4 Cal : 1 d provide of fooPeriod I
r day
Protein-
free diet fe
d 20%
fat Low fat
20%
fat Low fat
Nitrogen
balance (mg.per
5 days )
—- 28 8
— 29 0
— 51 4
—1465
Partition o f
Total Ure a N
180 79
~
180 8 5
459 33 0
1389 87 5
nitrogen i n urin e (mg .
Allan- Am - toin moni
a N N
80 5 61 2 71 4 2
81 34 9
per 5 days) Creati- Amino nin
e N N
4 ϊϊ~
11 1 8
9 1 4
4 2 8
o o
G
3 o
>
G H
s
w o g O
1—
I
3
o2
The lipi a
d constituen t i
s a 1:1 mixtur e o
f butterfa t an
d lard
bo .
h-»
tion. Indeed, it was observed 40 years ago that patients with diabetes mellitus fared better on high-fat diets than on high-protein or normal diets (Allen, 1917; Newburgh and Marsh, 1920). It also has been shown that rats made diabetic with alloxan behave similarly (Burn et al., 1944).
One interpretation may be that the diabetic organism has limited ability to synthesize fat—a deficiency that is compensated for by increases in fat intake. This idea is supported by experimental work showing the pos- sibility that a major function of insulin is to increase the synthesis of fat in the organism (Drury, 1940; Pauls and Drury, 1942).
TABLE VII
AVERAGE GLUCOSE TOLERANCES OF GROUPS OF RATS F E D A STOCK RATION AND Two LOW-NITROGEN DIETS AT Two LEVELS OF CALORIC INTAKES
Energy value of diet in Period II Ad libitum 56 Cal./300 gm.
rat/day 56 Cal./300 gm.
rat/day 14 Cal/300 gm.
rat/day 14 Cal./300 gm.
rat/day
Diet fed Stock control 20% fat Low fat 20% fat Low fat
Mg.%
0 90 93 130 150 140
• : Minutes after 30
252 290 306 305 290
60 230 241 282 281 272
injection 120 176 206 251 236 243
of glucose 180 135 157 202 209 190
240 112 106 162 176 170
3. Adrenal-Cortical Activity
Adjustments made to the triple stress imposed by this experiment are complex and all must be taken into account in trying to understand the adaptations made by the experimental animal. Recent studies in our lab- oratory show that hyperemic, enlarged adrenal glands and low concen- trations of adrenal cholesterol are coupled with the high excretions of urinary nitrogen characteristic of rats receiving limited quantities of the diet in which carbohydrate is the source of energy.
Decreased concentration of cholesterol in the adrenal glands is be- lieved indicative of increased adrenal-cortical activity (Long, 1947). It appears that the presence of fat in the low-calorie, protein-deficient diet lessens, at least in part, the stress to which the animal is subjected be- cause the adrenal glands of rats receiving this diet have normal con- centrations of cholesterol. If the markedly lower values for adrenal cholesterol observed in the rats fed the high-carbohydrate diet signify hyperactivity, this in turn, may explain the increased catabolism of pro- tein that occurs when fat is eliminated from a protein-free diet of in-
FOOD ENERGY AND THE METABOLISM OF NITROGEN 2 1 7
adequate energy value. However, it also is possible that the adrenal response is secondary to the stress of large losses of body nitrogen. Or again, fat may provide precursor substances for the synthesis of adrenal hormones.
I. ROLE OF METHIONINE
The effectiveness of methionine in the sparing of body tissue of the rat when added to a protein-free ration containing 20% of fat was re- ported from our laboratories in 1947 (Brush et at, 1947). Nevertheless, the observation that methionine may serve in lieu of fat in averting the
+50 o -50 -100 -150 E i -200 o c
"5-250 m
c-300
<D σ» o
£ -350 z
-400 L
Energy Value of Rations in % of Day's Requirement 100
No +4mg.
Supplement Meth N
J J
75
No ♦ 4 mg.
{Supplement Meth N
J
5 0
No + 4mg.
Supplement Meth N
Wi
2 5
No +4mg.
Supplement Meth N.
□ 20% fat E3 low-fat
FIG. 6. Nitrogen balances when protein-free rations of varying fat content are fed to protein-depleted rats at different caloric levels with or without methionine as a dietary supplement.
catastrophic effects of feeding protein-free diets of reduced caloric value to rats with low reserves of body protein came as more or less of a sur- prise. In these experiments, methionine in a quantity equivalent to 4 mg.
of nitrogen each day was offered to rats at the beginning of the second metabolism period.
The data depicted in Fig. 6 show that methionine in amounts pro- viding only 4 mg. of nitrogen per day exerts some protective influence on metabolism when supplementing either of the low-nitrogen basal diets when calories are adequate (Hoover, 1950; Hoover et al, 1949). But it is even more potent under conditions of caloric restriction. It behaves like fat in depressing the excretion of urinary nitrogen when the food consumed provides only one-fourth of the needed energy.
The ameliorating influence of methionine in rats fed the various pro- tein-free diets used in these investigations can be detected in various phases of the metabolism.
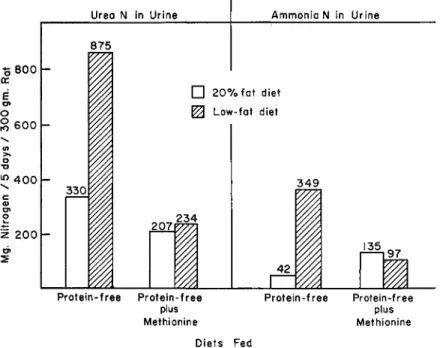
Its presence in the diet is associated with a reduction in the excretion of urea by rats fed restricted amounts of either the 20% fat or the low- fat diet (Fig. 7), but is particularly effective in preventing the tremen- dous outpouring of urea that occurs when dietary fat is absent. Very interestingly, although dietary methionine alleviates the high production
Urea N in Urine
S 8 0 0 h a:
8 6001-
^ 400 c
Q) σ»
o
z 200 h k_
2
875
330
Ammonia N in Urine
□ 2 0 % fat diet 0 Low-fat diet
2 0 7 f ^ ~
3 4 9
135 97 Protein-free Protein-free
m
plus Methionine
Protein-free Protein-free plus Methionine Diets Fed
FIG. 7. Urea nitrogen and ammonia nitrogen in urines of rats fed protein-free diets of restricted value (14 calories per 300-gm. rat per day).
of ammonia by rats in the low-fat group, it augments its production by rats receiving fat. As a result, the proportion of urinary ammonia to urea nitrogen remains abnormal during methionine feeding in both groups on the restricted feeding regime.
Dietary methionine appears to modify the course of the carbohydrate metabolism under the conditions of the present experiment. It may be significant that it does not seem to exert its full regulating effect unless fat is present in the diet. Hoover, for example, has shown with glucose tolerance tests (Hoover, 1950; Hoover et al., 1949) that when methionine is added to the full-calorie, protein-free diet containing fat the average glucose tolerance curve matches that of normal rats fed the regular stock